Exponential Moving Average (EMA)


EMA200 and EMA50 are probably not crossing in June--Target 45KFollowing the slope of EMA200 to check if we are in the bullish phase or bearish phase.
Currently the slope of EMA200 is slightly sloping upwards.
Next target is 45K on BTC then a check of the EMA50.
Absent world events like a cyber pandemic (internet is vastly shut off) I suspect that BTC is onwards to the path of $100K in 2021.
Even if vast parts of the internet are shut off, the spot prices for BTC might still be high on the remaining P2P markets.


VeChain at supportThe VeChain / Bitcoin pair is at HTF support confluent with the 200D EMA right below.
Let's see what happens, we bet on it to move back up.

Doge; 200 daily EMA In my last doge post, I stated what we needed to do in order to continue upwards but, if doge couldn't achieve those said goals then we were to meet the 200 Daily EMA.
WELL, here we are! At the 200 Daily EMA after doge failed the box phase. 📦
Expect volatility now which could be good for swing trades.
I'm looking for DOGE to recoup big off the 200 with a higher low povit incoming but ain't gonna be hasty just yet.
I'll make a new phase to study soon but for now,
let's see what happens!

BTC is STILL BEARISHBitcoin is in very important situation.
It has the resistant area of 41k to 42k ahead and also EMA-200 an daily chart.
EMA-50 is already crossed the EMA-100 downside on daily chart
the RSI indicates that Bitcoin probably is going for lower prices.
in this scenario , the next support level (between 30k and 31k) on daily chart can respond to sellers and bounce the price up again.
So trade whit caution and remember anything is possible.

ETH Price Decline ETH has rejected the EMA 50 and bounced off it at $2378 again
There is also a Death cross appearing on the 50 and 200 EMA...
Now it seems to be breaking its major support and price decline will begin a Bearish market for ETH
It seems that Bullish sentiment could be fading and more accumulation to come as ETH breaks lower support...
Disclaimer:* Not a financial advisor. Please inform your investment decisions off of your own analysis.

AJ Trady 5 min ema and macd strategy.A new strategy that I have developed. Only enter when EMA crosses one of the longer term EMA's + a bullish cross is forming on the MACD. Ideally, you should wait for ema 8 to cross both ema 21 and 34 with a bullish cross formed/forming on MACD. Use alongside normal Support and Resistance for SL and TP levels. If used on crypto I mainly suggest just BTC as alt setups easily ruined by BTC doing what it wants.


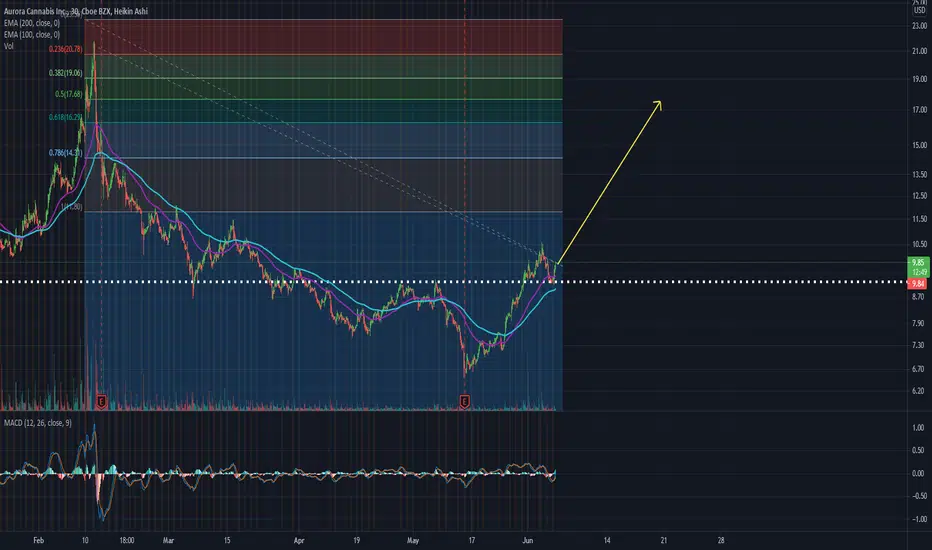
ABC nice bounceABC bounced on 9$ again - perfect.
If we ride on the 100 EMA next target will be 14$ then 17.60$. Overall there is an started uptrend.
ETHUSD 4H timeframe | Bearish buildupMarket in last 24hrs
ETHUSD broke the support of the Bollinger Bands midline. Historically, in the short timeframe of 4H, ETHUSD has respected the midline.
Today’s Trend analysis
ETHUSD could continue its bearish momentum, and move further downwards towards the lower band of the Bollinger Bands.
Price volatility remained high at approximately 6%, with the day's range between $2559.18 — $2762.91.
Price at the time of publishing: $2580.63
ETH's market cap: $310.94 Billion
Indicator summary signals bearish momentum.
Out of 15 Moving average indicators, 12 are giving a SELL signal.
ETHUSD could be expected to oscillate between the lower band of Bollinger Bands and the resistance at midline. MACD line has given a downward crossover. RSI has furiously descended to 50. Further downward momentum below 40 gives a 'SELL' trigger.
Volumes have remained low in the past 24 hours.
----------------------------------------------------------------------------------------
The analysis is based on signals from 26 technical indicators, out of which 15 are moving averages and the remaining 11 are oscillators. These indicator values are calculated using 4Hr candles.
Note: Above analysis would hold true if we do not encounter a sudden jump in trade volume .
----------------------------------------------------------------------------------------
Feel free to provide your feedback. It would allow me to improve my analysis further!


2.68R EURUSD Target Price 1.23495 (158.0 Pips)EURUSD Entry Price 1.21915 Take Profit 1.23495 (2.68R)


Using the Moving Average Convergence Divergence (MACD)MACD – What it is
The Moving Average Convergence Divergence (MACD) is the momentum indicator that shows the relationship between two different moving averages:
1. The 12 period exponential moving average – On Tradingview it is the Fast Length.
2. The 26 periods exponential moving average –On Tradingview it is the Slow Length.
The MACD line is calculated by subtracting the 26 period EMA from the 12 period EMA.
The Signal line is the 9 period exponential moving average.
These two lines are then plotted on top of each other. These are the two lines you see when you turn on the MACD indicator.
Additionally, there is a histogram that shows the distance between the two lines. Larger bars tell us that the MACD and Signal are further apart.
When it comes to candles, size matters. The larger the candle the more momentum the trend has.
The histogram will turn green when the MACD line is above 0 (bullish) and it will turn red when the MACD line is below 0 (bearish).
Very bearish momentum is shown above. Photo was taken May 23, 2021.
How to use the MACD
The most important thing to know about the MACD is how to read the relationship between the two lines.
I’ve found that the best timeframe to use the MACD with is daily. This is because the MACD is a lagging indicator and using daily data prevents a lot (not all) of false buy and sell signals.
These signals are:
• When the MACD line crosses above the signal line it is a buy signal
• When the MACD line crosses below the signal line it is a sell signal
Additionally, it is best to use the MACD in a trending market; a market with a clearly defined up or down trend.
Using the MACD with trend lines is a very powerful combination.
The reason for this is that if the market is moving sideways, you can see small fluctuations where the MACD and Signal Line cross but the price does not really go anywhere. These are false breakouts.
Therefore, these signals are not automatic buys and sells.
There are ways of confirming the indications from the MACD chart.
One way is a strategy that uses the RSI and MACD together (which is beyond the scope of this text, but I will discuss in my next article).
Another way is to use the MACD with the current trend. So, if you are in an uptrend and then you see a bullish cross, then this is confirmation that you are likely to go higher.
The same is true in reverse.
Also, please note that the cross over happens well after the price either stabilizes or rises. Again, this is because the MACD is a lagging indicator.
Leading Indicator?
Since the MACD and Signal lines are lagging indicators is there something that can be used in a predictive way?
Some traders use the histogram as a way to predict when a reversal will occur.
Since the MACD is a momentum indicator it can show us when sell pressure is alleviating. Meaning it might be a good time to buy.
This doesn’t always work of course, but with good risk management (stop losses) you can often get into a position well before its breakout.
Conversely, it can show you when your long position is running out of steam and can warn you when to get out.
MACD Divergence
Another useful way to use the MACD is to spot divergences.
A bullish divergence, very similar to the RSI, is when the short-term price trend is going down but, the MACD is going up.
Bearish divergence, also very similar to the RSI, is when the price trend is going up but, the MACD is going down.
Trading this way is sometimes not a good idea because you are trading against the trend. Please practice good risk management if you are trading reversals.
Also, notice the buy signal right before the sell signal that is circled. I really want to hammer home the point that the signals are not automatic buys and sells.
Price action is a great way to confirm the reversal (to the up or down side) of a trend. Because simply spotting a divergence does not guarantee the price will follow.
Final thoughts
As you can see there are different ways of successfully using the MACD. I hope I’ve made a few of these ways clear in this beginner guide.
Please let me know if you have any questions and if you like it, please hit the thumbs up and be sure to follow for more.
Links to my Fibonacci Retracement and RSI guides are below.
Thanks for reading!


#NIFTY forming ascending triangle maybewill be looking to buy the dips if we get it, setup valid as long as we don't have any weekly candle close above Resistance
21ema have supported well so far, if we break out from the triangle target will be around 172xx
lets see what we get next few weeks
