Exponential Moving Average (EMA)

AUDUSD Target Price 0.75318Wait for the breakout before committing to a short position. Trade in the direction of the breakout. Use a rejection candle as the entry signal.

AUDUSD Target Price 0.80072Wait for the breakout before committing to a long position. Trade in the direction of the breakout. Use a rejection candle as the entry signal.

CertiK CTK breaking out 💪 Certik CTK a midsize market cap with Circulating Supply 4M of 100M is breaking out above both 50 EMA and 100 EMA at the same time after a very long consolidation with increasing bullish volume over the time.
How high will it go? What do you think? Feel free to share your thoughts.

Microsoft hodling the last lineSince the COVID march 23rd sell-off, we have not closed below the 100ema for over 2 days.
There has been 7 successful pullbacks.
Tomorrow we could witness failed breakdown to shake weak hands placing tight stops, so I recommend entering with smaller positions that you usually do.

Fear&Greed index is extremely low, Will 20 weekly EMA save us ?Fear and Greed Index is at extreme fear now at 20, and it will go lower most probably by the close of today. I am longing BTC heavily now with a stop low below 20 Weekly EMA at 45,000 if we close daily below it.
20 Weekly EMA has been supporting BTC for the previous bull market , and with this very low Fear and Greed index , it makes so much sense to buy now. ( Buy with others are fearful , Sell when others are greedy ).
Let me know what you think , Will the 20 weekly EMA save us this time too , or this is the end of bull market ?

NZDJPY New Zealand Dollar Japanese Yen Target 358.2 PipsNZDJPY Measured Move Is 358.2 Pips. Watch For Buying Opportunities Above 79.212. Look for entries inside the EMA 10 EMA 20 area. Look for closing prices inside the Exponential Moving Average area.

Dogecoin/USDollar EMA 10 EMA 20 Pin Bar H4 ChartThe open|close price is beneath the EMA 10 and above the EMA 20. Open|Close Price is in the EMA 10 EMA 20 area. The high price is above the EMA 10 EMA 20. The pin bar is located at a higher low.

DOGEUSD Dogecoin Entry Price near OHLCOn the H4 Chart, the best entry was at the closing price on 18 Apr '21 at 19:00. Wait for the next Pin Bar to occur on the H4 Chart. The Pin Bar to trade should have the Open High Low Close near the EMA 10 EMA 20 values.
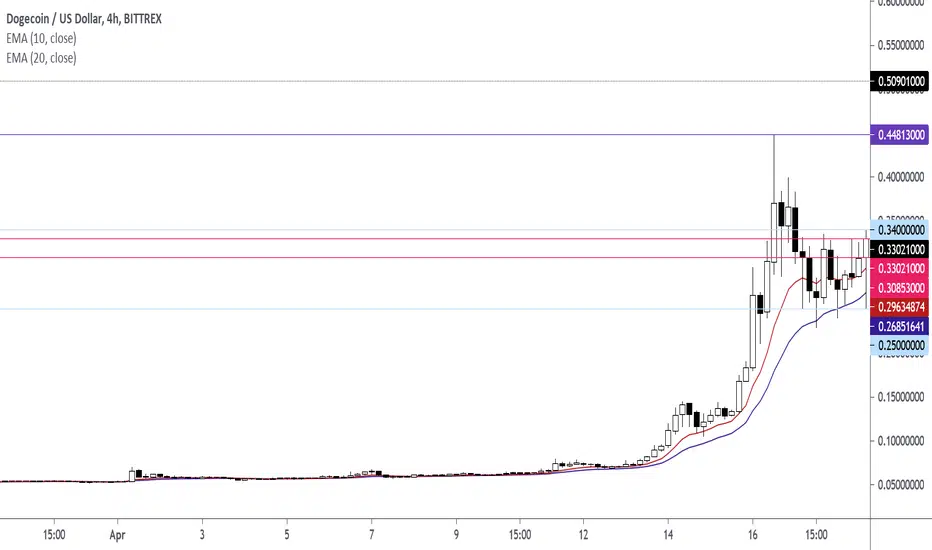
DOGEUSD (Dogecoin / US Dollar) DOGEUSD (Dogecoin / US Dollar)
Entry 0.24939000 Closing Price
Target 0.44813000 Previous High Price
Optimal Entry is WHEN the Close Price, Open Price, High Price, and EMA 10 EMA 20 numeric values are close together. Candlestick Bar is a Pin Bar or Rejection Candlestick Bar like a Hammer.
Target Price is previous swing high.


SUGARUSD EMA 10 EMA 20 Pin Bar TradeAfter a break out, wait for the right moment to enter. Don't be in a rush to enter the market. Wait for confirmation of the trade set up. If trade signal does not occur, then do not enter the market.
For SUGARUSD, the confirmation signal occurred on February 4, 2021. See Pin Bar located at the EMA 10 EMA 20. After price breaks a horizontal key level, wait for the trade signal. Price may bounce around the horizontal support resistance key level. The signal may not fall neatly on support resistance level. Remember support resistance levels are areas. Be patient and wait for a signal to form in the area.

ROST in pullbackEma 50 Daily (yellow) will be the first test.
Ema 21 Weekly (white) will be the last.
Will try a swing at those levels or at the recover of the daily 21.

AUDUSD Support Resistance LevelsWatch These Price Levels For A Buy
0.78360 EMA 10
0.78131 EMA 20
0.78182 Horizontal Support Resistance

LTCUSD Litecoin; Pin Bar; EMA 10; EMA 20For Litecoin LTCUSD Trade Idea, Enter Where The Open & Close Is Inside The EMA 10 EMA 20 Area. See Pin Bar At 7 May '21 23:00 as an example.
The Pin Bar Candlestick Price is: 345.86 Open 345.32 Close
When A Pin Bar Forms At Horizontal Support Resistance, Exponential Moving Average Period 10, Exponential Moving Average Period 20; Execute A Buy Order.

LTCUSD Entry Price Levels At Support & Resistance Wait For A Pull Back To These Price Levels For A Buy Entry.
334.58 EMA 10
306.79 EMA 20
335.32 17 Apr '21 High


XAGUSD Target Price 28.32856XAGUSD Silver
Exponential Moving Average Period 10 is above Exponential Moving Average Period 20 on Monthly, Weekly, Daily, H4, and H1 Chart.


Jump on the Bitcoin train now, next stop may be higherHi everybody!
This time I want to focus on similarities to last two cycles and explain you, why i believe we already hit the bottom of this local cycle.
First compare this chart to the very same moment od the last, 2017 bullrun:
You will notice, that in both cases, after 4 consecutives ATHs we reached the top and then bottom with very similar pattern, having higher lows on the price chart and lower lows on RSI chart which is known as "bullish divergence". Both cycles were made within ~60 days and the price action first crossed 1D EMA 50 and then hit the bottom right after crossing 1D EMA 100.
In both cases growth to drop factor was/is ~2:1.
Tell me what you think and I'll publish my another idea with wider view, showing how similar these two bullruns are, what should we expect in the near future and where may it takes us :)
Hit the thumb button and follow me if you liked it!
