Exponential Moving Average (EMA)

LTCUSD Litecoin ; Trend ; Pin Bar ; EMA 10 ; EMA 20Litecoin (LTCUSD) Mean Reversion Trade Set Up.
Enter after pin bar formed. Enter at the closing price of pin bar. Target previous swing high for take profit. Placed stop loss at pin bar low.

Pullback In A Trend | EMA 10 | EMA 20 | Pin Bar | ETHUSDETHUSD Ethereum
Enter at Pin Bar Close. Exit At Previous Swing High For Take Profit. Place Stop Loss At Pin Bar Low. H1 Chart.

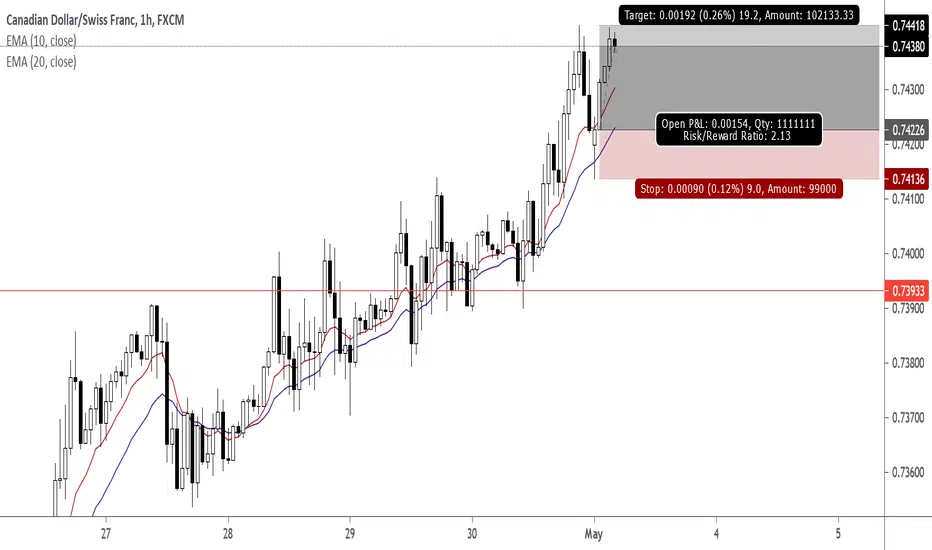
Pullback In A Trend | EMA 10 | EMA 20 | Pin Bar | CADCHFCADCHF
Enter at Pin Bar Close. Exit At Previous Swing High For Take Profit. Place Stop Loss At Pin Bar Low. H1 Chart.
Pullback In A Trend | EMA 10 | EMA 20 | Pin Bar | EURSEKEnter at Pin Bar Close. Exit At Previous Swing High For Take Profit. Place Stop Loss At Pin Bar Low. H1 Chart.

Pin Bar, EMA 10, EMA 20, Rectangle, Momentum 29 APR '21 0:00 Pin Bar
Entry at Pin Bar, EMA 10, EMA 20, and Horizontal Support Resistance Line. Entry at Pin Bar Closing Price 84.594 at 0:00.
Entry Price 84.594
Take Profit Price 84.867
Stop Loss Price 84.491
2.65 R-Multiple

FILEcoin long setuoMost alt coins have had a unprecedented bull run over the last 8 months (as many assests have). So caution always needs to be applied but we can see that the 50 ema has not been violated by any bar closures and we can see strong bullish action on the chart.
With a space between the entry and the next two targets

GBPUSD Target Price 1.39764GBPUSD Entry came on the Pin Bar closing price. Pin bar high, open, close is inside the area of EMA 10 and EMA 20.

GBPUSD Target Price 1.41384 Entry Price 1.39289GBPUSD Trade idea is pin bar, ema 10, ema 20, trend, and momentum.

NZDCHF Target Price 0.66450 Entry Price 0.66066NZDCHF Trade Idea is confluence with EMA 10, EMA 20, Pin Bar, Trend, and Momentum.


EURZAR Pin Bar + EMA 10 + EMA 20 | Target Price 17.32788EURZAR Pin Bar + EMA 10 + EMA 20 + Trend Line + Momentum


Trading between the 55 and 100 EMA, short position on GBPUSD D1.My system is to buy when a new candle opens above EMA 55 and close at profit when the price touches EMA 100, but it's not like that only, before the trade should open a line must be drawn on the EMA 55 and that line must touch a tail of a candle in the previous down trend and a formed previous Zigzag indicator touching the 55 EMA but not reaching the 100 EMA yet, and the stop loss should be under the last bottom. The sell trade is the same in the other direction.
P.S: The entry should not be directly when the new candle of the same time frame opens above the 55 EMA , because we must work with 2 time frames, the actual + the one before (1D + 4H) or (4H + 1H) or (1H + 15M) or (15M + 5M), so if the candle tail touches the 55 EMA and close above it, we must watch the previous time frame and open a sell trade when touching the 55 EMA and only when a new candle open under it, so it will be a sell limit order with price touching the 55 EMA , or just sell market price when touching the 55 EMA .


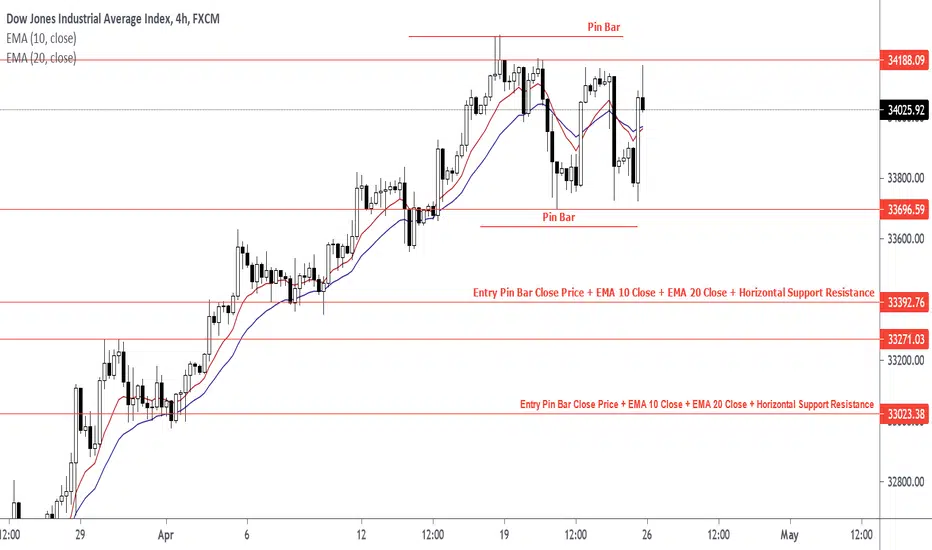
US30 ; Wait For Price To Close Above 34188.09US30 ; After A Close Above 34188.09, watch for a price action signal like a pin bar to form. Pin Bars located at a higher low for long positions and pin bars located at a lower high for short positions perform the best.
Crypto Market Turning Bear — A Huge SignThe crypto market has been on a very consistent bull trend for the last 5 months. This has changed recently with Bitcoin leading the bears out of hibernation. Yesterday, for the first time since October, the entire crypto market closed it’s daily candle below it’s 50 day EMA.
Investors should understand the risk of opening and holding long positions with this broad indicator turning bearish. This could be a temporary blip in an even longer bull run but it is now slightly more likely that we are indeed entering a bearish trend.
This is simply my analysis, not financial advice.

IF YOU HAVE JUST SAVE ITIN LONG TERM IT WILL RISE.GOOD FUNDAMENTAL GOOD TECHNICAL SO WHAT ELSE DO YOU WANT?!

Trading between the 30 and 55 EMA, short position on EURJPY D1.My system is to buy when a new candle opens above EMA 30 and close at profit when the price touches EMA 55, but it's not like that only, before the trade should open a line must be drawn on the EMA 30 and that line must touch a tail of a candle in the previous down trend and a formed previous Zigzag indicator touching the 30 EMA but not reaching the 55 EMA yet, and the stop loss should be under the last bottom. The sell trade is the same in the other direction.
P.S: The entry should not be directly when the new candle of the same time frame opens above the 30 EMA, because we must work with 2 time frames, the actual + the one before (1D + 4H) or (4H + 1H) or (1H + 15M) or (15M + 5M), so if the candle tail touches the 30 EMA and close above it, we must watch the previous time frame and open a sell trade when touching the 30 EMA and only when a new candle open under it, so it will be a sell limit order with price touching the 30 EMA, or just sell market price when touching the 30 EMA.

What is up with Bitcoin ? key Points explained :)Hey guys
These are some key levels that we should pay more attention to, especially 41K-43K because there is a massive volume profile.
>>><<>Key points<><<<<<
1- This is the first time that the price closed a daily candle under the EMA (55) since the 10.5K break out.
2-This is the first time that we are observing a death cross between EMA(26) and EMA (13) Since 10.5K break out.
3-If we see a daily close under 50K then it confirmed a Lower Low for the first time in this bull run.
> >Trend is your friend < <
4- there is a CME gap ( check the Ticker BTC1 ) around 57K-59K. Watch out !!!!!

BTC is Below The 50 EMA! Here's a quick update on BTC daily chart. As we can see, the price broke down from the rising wedge. Also the price is currently below the 50 EMA. The 50 EMA Has worked as a very strong support throughout this bull run. We have to close above it! Otherwise we are looking for some some more downside! Last time the price went below the 50 EMA was back in October last year when the price was 10k!
The target of the downside break of the rising wedge is at 43k. The price really needs to close above 56k to stay above the 50 EMA, To avoid further downside!
Follow me for daily profitable trading setups
BTC dictates the market. If BTC falls, then Alts will fall as well. Trade safe!

