BTC flipped the 200EMA back to bullish - Was this a bear trap?Due to alts humming and breaking massive gains by throwing darts at a board we can see that we may have actually be in a bear trap.
BTC 4he 200ema flipped and now a hammer is forming off resistance/ 200EMA.
This could get back to 9000-9100 and higher if we gain momentum and some of that alt gain money flows back into BTC.
Trade, Chart, Learn, Repeat,
Coach K
@coachkcrypto
Exponential Moving Average (EMA)


AUDUSD // Fibunacci levels // Support Resistance // Trend lines* Retracement to key support at .618
+ if it holds and bounces great opportunity for longs
- otherwise if it breaks a short opportunity arises
* Market Sentiment is overall short
Contrarian pov to long
* Stochastics are oversold on 4hr but not so much on higher timeframes
+ expecting it to make one final impulse before any major correction.

NZDUSD - SHORTA bit hesitant to take this short as USD seems to be on the verge of reversing. Will be looking at how price reaches the descending trendline and then act accordingly.

Potential Short on AUDEUR.Double top has formed. Trend line has been broken. Starting to make lower lows and lower highs on 15m chart. Starting to show rejections off 50EMA.

USDCHF ShortALOHA
Hope your May is on pace for dominance! There have been a lot of nice moves that I was not personally to capture but still stoked to be watching the strategies play out. I am currently sitting at -1% for the month with 3 BE trades. I am currently look at USDCHF reversal short.
D - Price does not always have to touch a resistance or support line, the ray lines represent areas which is why i condsider this a triple top in my analysis. Within an overall side ways channel.
4hr - Overall price on USDCHF is moving in nice patterns. Ascending channel, within horizontal flag. Multple touches before price moves. , nice confirmations. The only thing however, is the 4hr 50ema being in the way. I'm anticipating price hovering around that area which will then decide where the market wants to go.
1hr - broke below 50ema, creating a minor hover just under it after nice bearish engulfing run.
Waited to put entry until new market day. Will hold over the weekend or get taken out. It is what it is. Thanks for reading. have a good weekend traders. Since typing this up, trade was triggered due to spreads. It is what it is.

USDCHF shortALOHA traders!
Hope you all had a dominating and profitable end of April! Here's a two trades, one that that I missed getting into but was able to capture a second minor move down where I was hoping for it to break down.
The position I got in only lasted for less than a day, 14 hours with a manual close of +.73%. I was okay with closing it as I didnt want to hold through the battle of high spreads and instead wait for a pullback for a better, long term short entry. However, if price continues to move upward and meet the 4hr 50ema, we may see a bull but not consireidng entering any bull positions at this time as other pairs are looking better.
This is what I saw at the beginning of the week that was so beautiful I had to share an ascending triangle in action!
Daily - had a beautiful ascending triangle with a triple top at a resistance area.
4hr - Within the ascending triangle, and ascending channel with lower highs took place creating a correcting pattern that had potential to break up or fall out of the acceding channel. A break of the 4hr 50 ema was a good sign for me to get in.
1HR - As price was hovering around the 1hr 50ema and still hovering within the ascending channel, I placed a virtual entry order(not on my real account).
original entry was at 50 pips and potential target of recent significant low level for 2%.
Will be keeping my eye on this one for this week as well. Other than that, I've been slow with my trading with only 10 trades this entire month ending at just over Break Even for the month which I am indecent about. There's always profit left on the table but t the same time, very happy with how I've performed over this entire coronavirus situation. I hope this provided some encouragement, enlightenment and down right motivation for you all reading.
Mahalo! May you have a profitable week and even better month! Let's do this MAY!

AUDCHF 1D MA-X MOVING AVERAGE CROSS
Tim's MA-X Strategy.
This is a Moving Average Crossover or MA-X Trading Strategy setup.
MA-X strategy consists of the 100 period simple moving average (SMA) in red,
and the 20 period exponential moving average in blue.
If the 20 ema is above the 100 sma then we only take buys or longs.
If the 20 ema is below the 100 sma the we only take selss or shorts.
*In this case price is above the 100 sma so we will only take buys or longs.
*This Pair has been in a nice uptrend foe some time.
*It's now pulled back below the 20 ema and consolidating below the 20.
*We are going to look for a close above the 20 ema to go long.
*This trade plan we buy a daily candle close above the 20 ema.
On the breaking candle to enter a full-sized position we want to the volume bar reach up to the volume average.
If it doesn't reach the average but does reach 75% of the average open a ½ size position to reduce risk.
You can calculate the percentage by dividing the first volume average by the second volume average.
You should at least get 75%, if you don't then stand aside on the trade.
The stop loss will be 1.5 x ATR.
The first target will be 1 x ATR.
So the way that works is you get your candle close above the 20 ema that's your entry point.
At that time you look at the ATR of that candle.
You multiply that by 1.5 to get your SL.
You measure that distance behind the entry and that will be your SL.
Then you measure 1 ATR above the entry and that will be your first target.
If after entering the trade the candle closes back below the 20 ema, tke the loss right then.
Do not wait for price to hit the SL.
Our intention is that a breakout above the 20 ema should be explosive and hit our target fairly quickly.
If the momentum goes away we want to shut the trade down without taking a full stop if possible.
When price hits our first target, close half the position for profit and set the SL to break even on the remainder.
Follow stops as price moves in our direction until the market takes us out.
These two rules are the very definition of cutting your losses and letting your winners run.
Typically does this by using two positions.
The first position has a stop loss and a take profit.
That position will close automatically when the first target is hit.
The second position will only have a stop loss and not take profit.
This is the position that will be allowed to run.
When the first target is hit we have to manually move our stop up to break even on the second position.
Risk only two percent of your trading account of each trade.
Each position will then only be 1%.

Long NAS100 4HThe Nasdaq 100 have started to recover when it hit a strong support trendline. Other bullish indicators is :
1. Upward channel
2. Broken 40 EMA dotted line
3. Broken short term 40 EMA
Trading has financial risk - always use Risk Management
Long term setup


EURGBP Buy more Its the previous update. We can see reaccumulation over 200EMA its a sign of strength it will push it more upside. BUY more here.
Hit the like button if you find it helpful and informative and follow to catch every wave correctly.
PREVIOUS ANALYSIS

Long AUDJPY 4H1. Overall Bullish direction
2. Above 40 EMA
3. Broke rectangle and retested.
TP Target 71.120

JPM - Short the banksSHORT Position. Descending triangle pattern. Fundamental : Earnings miss. I entered this trade this morning at $100.95, adding more shares now. Looking good so far.

EURUSD - Next Swing Trade - Multiple Buy Point
Hi Traders!
If you look at the H4 Timeframe you can see that
the market is neither in an uptrend or in a downtrend.
Why? The market either need higher highs & lows or lower highs & lows to make a trend.
And what do we see?
What you can see is higher lows and lower highs and a Support-Trendline (on H4).
However, in the H1 Timeframe you can see a tiny uptrend.
The market is movin in a parallel channel.
Furthermore, it starts to respect the 200EMA.
We recommend to buy at the Buy Point, for a low-risk trade and a good target.
So, the entry triggers are:
- strong H4 Trendline
- bottom of the Parallel Channel
- 200 Exponential Moving Average
- tiny Uptrend
Thanks and successful Trading :)!

PMT- Short SaleGood R/R, short term uptrend now reversing. Short mortgage co and banks. You can see it broke the uptrend on the 15 minute. makes sense in this market. Psychological stop @ 10.25-.10.29ish

AUDJPY 1D MA-X STRATEGYTim's MA-X Strategy.
This is a Moving Average Crossover or MA-X Trading Strategy setup.
MA-X strategy consists of the 100-period simple moving average ( SMA ) in red,
and the 20-period exponential moving average in blue.
If the 20 ema is above the 100-SMA then we only take buys or longs.
If the 20 ema is below the 100-SMA the we only take selss or shorts.
*In this case price is above the 100-SMA so we will only take buys or longs.
*This Pair has been in a nice uptrend for some time.
*It's now pulled back below the 20-EMA and consolidating below the 20.
*We are going to look for a close above the 20-EMA to go long.
*This trade plan we buy a daily candle close above the 20-EMA.
On the breaking candle to enter a full-sized position we want the volume bar to reach up to the volume average.
If it doesn't reach the average but does reach 75% of the average open a ½ size position to reduce risk.
You can calculate the percentage by dividing the first volume average by the second volume average.
You should at least get 75% if you don't then stand aside on the trade.
The stop loss will be 1.5 x ATR.
The first target will be 1 x ATR.
So the way that works is you get your candle close above the 20 ema that's your entry point.
At that time you look at the ATR of that candle.
You multiply that by 1.5 to get your SL.
You measure that distance behind the entry and that will be your SL.
Then you measure 1 ATR above the entry and that will be your first target.
If after entering the trade the candle closes back below the 20 ema , take the loss right then.
Do not wait for the price to hit the SL.
Our intention is that a breakout above the 20 ema should be explosive and hit our target fairly quickly.
If the momentum goes away we want to shut the trade down without taking a full stop if possible.
When the price hits our first target, close half the position for profit and set the SL to break even on the remainder.
Follow stops as price moves in our direction until the market takes us out.
These two rules are the very definition of cutting your losses and letting your winners run.
Typically does this by using two positions.
The first position has a stop loss and a take profit.
That position will close automatically when the first target is hit.
The second position will only have a stop loss and not take profit.

EURUSD LAloha,with the dollar (DXY) weakening, Euro could be a temporary long at least to the 50ema on the daily...we'll see what happens there: either a continuation long (a pattern will show us), or a rejection back to form a running channel for clearer direction.
Placed the entry right above the 50 ema on both the 15 min and 1hr. First trade of the month.
Another entry could be in the works with this ascending wedge continuation squeeze.
4HR: hovered on the 50ema after a bull run with the greater trend showing a higher low.
1HR: broke out of descending wedge/channel and squeezed up and over the 50 ema to just hover like the 4hr.
15M: bull flag. descending wedge, pullback, all very similar phrases can describe what is happening here but in my honest opinion, they all point to the similar long bias with a probability of it making a deeper pullback for a loss.

ONTBTC Double Bottom| S/R Flip| Pull Back Entry Evening Traders,
Today’s technical analysis will focus on ONT/BTC, breaking a key level with conviction; an S/R flip retest is likely for a trade entry.
Points to consider,
- Resistance breached
- S/R flip for confirmation
- 200 EMA immediate resistance
- 21 MA confluence (upon S/R Flip Retest)
- RSI in overbought
- Stochastics in upper regions
- Increasing bull volume nodes
ONTBTC has broken an important level with candle closes above; price was consolidating under resistance giving a sign of increasing buy pressure. A Support/ Resistance flip is probable for a confirmation of the now support.
The 200 EMA is current resistance (candle has not closed above it), price is likely to respect it initiating a rejection. The 21 MA on the other hand is likely to be in confluence with the S/R flip retest if price retraces (it is likely to align).
The RSI is in overbought conditions, sign that the current impulse move is overextended. While the stochastics is in the upper regions, can stay trading here for a while however stored momentum to the downside.
Increasing bull volume nodes are evident, can be interpreted as a sign that buy pressure will continue to test upper regions.
Overall, in my opinion, ONTBTC has breached a key level; a retest is highly probable to confirm an S/R flip – allowing for a pullback entry.
What are your thoughts?
Please leave a like and comment,
And remember,
“Whenever I have had the patience to wait for the market to arrive at what I call a Pivotal Point before I started to trade; I have always made money in my operations.” - Jesse Livermore

EURCAD 4-1 HEURCAD i think that it will start heading down after being breaking the support and the EMA headed in the candle.
Comment about what you think will happen in the next few hours.

EOSUSD Trend Line Respected| Local Resistance Confluences Evening Traders!
Today’s analysis will focus on EOSUSD which has been in a defined downtrend, currently testing a key resistance area that has multiple confluences.
Points to consider,
- Bear Trend – Consecutive lower highs
- Resistance confluences (21 EMA, local resistance. .236 Fibonacci)
- Define down sloping trend line
- RSI testing resistance
- Stochastics neutral
- Low volume – influx imminent
EOSUSD has put in consecutive lower highs; price is currently testing local resistance that is accompanied with multiple confluences. In this area the .236 Fibonacci and the 21 EMA in convergence are giving clear sell pressure.
The down sloping trend line has been respected with multiple touches; a rejection from current local resistance will likely mean another retest of the trend line.
The RSI is testing median resistance, coming out of oversold conditions – quite neutral at current given time. Stochastics is also neutral, has stored momentum in both directions.
EOSUSD has clear dry volume with a recent bull pump failure; an influx will be imminent. This will be in conjunction with price direction.
Overall, in my opinion, EOSUSD needs to break resistance confluence with multiple higher lows to establish a trend change. However a rejection here will be in confluence with a volume spike, leading to a probable retest of the lower trend line.
What are your thoughts?
Please leave a like and comment,
And remember,
“Never let a win go to your head, or a loss to your heart.” – Chuck D.

BTC - YOU MUST BE A COMPLETE NOOB TO BE A BEAR AT THIS CONDITIONFor any professional trader, it will take 5 seconds to figure out what is going on looking at the BTCUSD chart right now:
1) We have a huge symmetrical triangle at weakly chart
2) The price just touched the bottom of the triangle which goes along weakly EMA 200 and the next target in mid 11 000
3) The RSI in low 30's third time in the entire crypto history
4) We have 2 weakly inside bars one by one at the major support level
5) The price is deeply below "W" VWAP as it always happens before the bounce from the bottom.
6) The stock market in the deep %$##%, so crypto is the only way to make money for the majority of the traders, and they won't miss this opportunity.
Do not try to try to convince bears that they are wrong. We will need them later on when they'll jump on the train during the bull run.
I hope you are fully loaded. Now, sit back and enjoy.

SPY 200 Point Close (8%)|200 Weekly MA|RSI approaching oversoldEvening Traders!
Today’s analysis will be on SPY, a 200 point close on the weekly time frame, saving SPY from having one of the worst weeks in history as it respects the longer term trend line.
Technical points to consider,
- Price above key technical 200 Week MA
- Long term trend line respected
- Structural resistance as probable lower high region
- Stochastics projected down
- RSI approaching oversold
- Noticeable bear volume nodes
SPY is currently sitting above the 200 Week Moving Average, a level that must hold as a weekly candle close will increase the probability of taking out lows. Price respected the longer term trend line with a precise wick leading to a 200 point close.
Structural resistance is a key level to break, if bull volume does not follow through with the bounce, SPY is likely to put in a lower high.
The Stochastics is currently projected down with stored momentum, it can stay trading in the lower regions for an extended period of time.
RSI is approaching oversold conditions; historically SPY has a relief rally, which can be plausible on the open. There are noticeable bear volume nodes indicating extreme sell pressure putting more emphasis on an oversold bounce.
Overall, in my opinion, fundamentally and speculatively this bounce could be due to big balance sheets ramping up the markets to avoid one of the worst weeks in history. It could also be due to large short covering to avoid holding
over the weekend.
Technically, if price does not break and close above structural resistance within the next couple weeks and months, this will increase the likelihood of lower highs, thus testing lower levels.
What are your thoughts?
Please leave a like and comment,
And remember,
“You become fearful the moment you identify with fear. But once you begin seeing it as an impersonal changing phenomenon, you become free.”
― Yvan Byeajee,

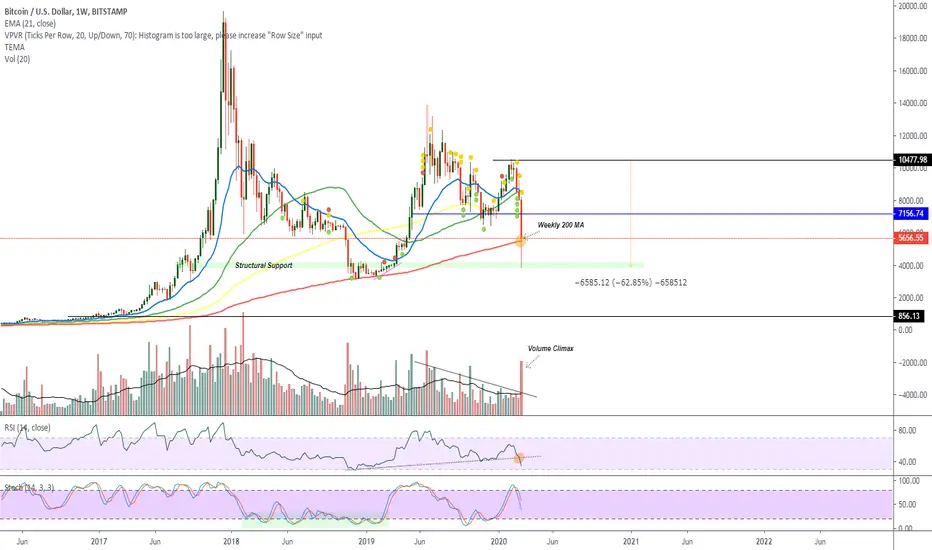
Bitcoins Historic Dump | Key 200 Weekly MA| Bear Sentiment Evening Traders!
History made on Bitcoin with the most epic dump to date, over 60%, what now?
Bitcoin has a key level to hold for a bullish scenario, the 200 Weekly Moving Average, a candle body close below this will send it to sub $3000.
Points to consider,
- Strong bear sentiment (traditional markets included)
- Holding above 200 weekly Moving Average
- Structural support respected
- RSI broke key support
- Stochastics projected downwards
- Volume climax president
BTC has experienced one of its most volatile movements as the bearish sentiment rails over all markets.
Technically it is above the 200 Weekly Moving Average but a close is needed for confirmation, this increases the probability of a temporary bottom in palace.
Structural support was respected with a wick, putting evidence on a volume climax as shown by the volume node.
The RSI has broken its important trend line, approaching oversold conditions on a larger timeframe is important to note.
Stochastics is projected downwards with lots of stored momentum where it can trade for an extended period of time.
Overall, in my opinion, there really is not much plausible with TA as the market sentiment is extremely bearish with the Pandemic. Key technical levels where all negated in a single candle in search for liquidity.
For the temporary bottom to be in, BTC needs to remain above the 200 Weekly Moving Average, a close below will test lower levels.
What are your thoughts?
Please leave a like and comment,
And remember,
“The market can stay irrational longer than you can stay solvent.- John Keynes