TY1!: Bullish flag patternApologies if I have been focusing too much on the bigger macro picture but I am too busy with some projects to do individual stock screening. Nevertheless, if you have been following my posts, you would know I am of the view that we are in the midst of a major inflection point (check out the Preponderance of Evidence series and DM me for full written report if interested) so it is more important to get the big picture right.
Essentially, the TY1! has:-
#1 bounced off a key long-term support from 1999,
#2 had a golden cross (50-dma vs. 200-dma or 100-dma vs. 200-dma)
#3 been consolidating in a bullish flag which happens to be a continuation pattern.
I am using a version of Daryl Guppy Multiple Moving Averages ('MMA') to complement the bullish continuation flag pattern; The MMA utilizes 2 group of moving averages, 1 fast, 1 slow, to track trend changes as well as trend strength. In the TY1! case, the MMA long-term moving averages are not showing any signs of compression which suggest the up trend is intact.
Indicative ABCD upside potential is for a move up to $126.20.
Exponential Moving Average (EMA)

Bitcoin Daily Update (day 326)Disclaimer: If you are primarily interested in copying other people’s trades then this is not for you. However, if you are willing to put in the work that it takes to learn how to trade for yourself then you have found the right place! Nevertheless please be advised that you can give 10 people a profitable trading strategy and only 1-2 of them will be able to succeed long term. If you fall into the majority that tries and fails then I assume no responsibility for your losses. What you do with your $ is your business, what I do with my $ is my business.
Click here for my Comprehensive Trading Strategy | Click here for my Comprehensive Trading Process | Click here to learn about the 2 BTC' to 20 BTC' Trading Challenge
Consensio: (Using 4, 9 and 50 EMA’s) M MA < S MA < P < L MA
Patterns: Phase 7 hyperwave | Bear Channel
Horizontals: R: $3,679 | Testing $3,525 for support
Trendline: Bear channel
Parabolic SAR: $3,359
Futures Curve: Backwardation with 0.8% spread. Pay close attention to the 2 week high. If we break down that (currently $3,766) and re enter Contango then it is a strong sell signal.
BTCUSDSHORTS: Pretty neutral, not much to glean at these levels.
Funding Rates: Longs pay shorts 0.01%
TD’ Sequential: Bearish price flip
Ichimoku Cloud: Thin could above 50 EMA represents little resistance if we can breakthrough the EMA.
Relative Strength Index: Above 50, pulling back for retest
Average Directional Index: Rolled over and back below 25, indicating no / weak trend
Price Action: 24h: -0.4% | 2w: +5.5% | 1m: +0.6%
Bollinger Bands: Pulling back from top band. MA = $3,494
Stochastic Oscillator: Daily sell signal
Summary: Have been watching the charts very closely, expecting some volatility to be right around the corner. I have been experimenting with EMA’s instead of MA’s and I am really starting to like the change. I have also adjusted the inputs to 4/9/50. Looking at the 50 day EMA right now and you can see why I like it.
That is my key area of resistance. If we can close a daily candle above then I expect a lot of buying volume to follow. The ichimoku cloud shows little built up resistance above that area which confirms my suspicion.
That being said it will not be easy to close above the 50 EMA. It is trending down and has been acting as strong resistance. If we stay below it for another 24 - 48 hours then I am expecting us to take out the two week low and re enter Contango. If that happens I will be going short.
The lower TF’s just took out $3,575 support and that should result in two scenarios, both of which come with volatility:
It’s either a shakeout before the breakout, or it was the top of this rally. Still slightly too early to tell, but I expect it to be much more clear by this time tomorrow.
I am still long, however I have started to scale out and I would not be looking to re enter until we close above the 50 EMA.

BITCOIN CHART $BTC $USD BITMEX:XBT
NICE PUMP BUT DONT LET YOUR EMOTIONS WIN, AND DONT LET THE NOISE CONVINCE YOU THIS IS THE BULL RUN EVERYONE IS EXPECTING.
WE ARE INSIDE OF A MASSIVE FALLING WEDGE, IF WE HOLD THE WHITE CHANNEL AND TRADE SIDEWAYS WE CAN THINK ABOUT GOING FOR THE $4,200 RESISTANCE, IF THERE IS LACK OF VOLUME AND BEARS PUSH THE PRICE DOWN, THE YELLOW THENDLINE MUST TO HOLD, IF NOT, SEE YOU LATER..
-NEXT RESISTANCES $3,800/$4,200
-MAIN SUPPORT TO WATCH IS $3,500
-IF WE BREAK DOWN $3,100/$2,800/$1,900

BTC 200 EMA vs. 200 MAWhat's coin on guys?
While everyone these days are talking about support from 200 weekly MA, nobody is talking about trading below 200 weekly EMA.

selby_exchange - BTCUSD - Selby Bitcoin Price Analysis - $2915New price/time prediction system of extrapolation based on decoupled EMA's and a hybrid linear regression with sidechain MMAR
COINBASE:BTCUSD Price target $2915 on 02/24/2019.
Selby finding creative patterns in charts on Tradingview!
Not advice for investing lol, but I am one to watch ;)
Rebellion=Change=Future
Humanity Love Inclusion Autonomy Respect Opportunity Truth Veganism Singularity


selby_exchange - BTCUSD - Selby Bitcoin Price AnalysisSelby finding creative patterns in charts on Tradingview!
Not advice for investing lol, but I am one to watch ;)
Rebellion=Change=Future

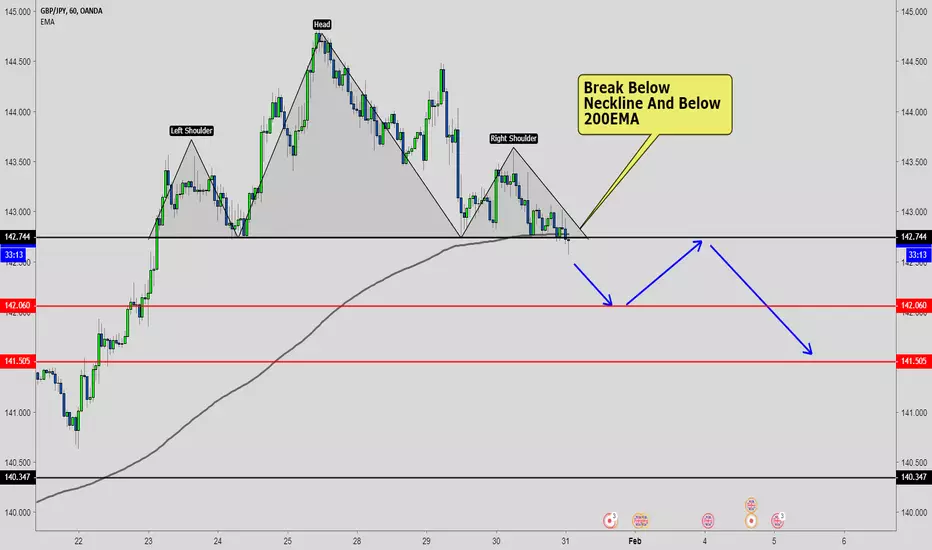
GBPJPY Head and Shoulders Pattern, Neckline barely brokenGBPJPY has formed a textbook Head and Shoulders Pattern.
Price has broken the neckline, as well as broken below 200 EMA.
Look for short entries.
MA vs EMA , Which one will break first ? We are in a tightening range, getting supported buy the 200 MA and resisted buy the 200 EMA. These lines are worth watching in coming weeks and months. Breaking any of these lines may trigger a big moves !

GBP/USD: Potential Buying Opportunity Year to date, the pair has developed a support line trending positively. Also serving as further support is the 9-day EMA.
I would wait for the pair to trace down back towards the support and then enter a long GBP position. I expect the first level of resistance will come at 1.3000, and following a break of that, around the 200-day EMA, currently at 1.3030.
Trade:
Buy Limit: 1.29295
Stop Loss: 1.2890
Take Profit (half): 1.3000
Take Profit (other half): 1.3030
Alternatively, I do see another resistance point potentially coming a little before the 1.3000 level, at around 1.29850, which I realize does not make the most attractive risk:reward ratio. However, I think there is still a few pips to squeeze out to the upside at this current level before this overall up-trend ends.

BUY LIMIT Order For EURUSD LONG Trade. Have A Look At the Link Have a look at the attached link for full analysis of this trade setup
BUYLIMIT ORDER: 1.15000 LEVEL
STOP LOSS: 1.14000 LEVEL
TAKE PROFIT: 1.16000 LEVEL
RR: 1:1
SHALL THERE BE ANY UPDATES YOU WILL FIND THEM BELOW IN THE COMMENT SECTION

BTC/USD D1 chart (1/16/2019)Good morning, traders. Yesterday's $100 move to the downside created a descending broadening wedge, out of the previous bull flag, which price broke out of this morning. Currently, price is testing resistance as support, and if this is successful we should generally expect continued upward movement. The 15 minute McGinley Dynamic aligns with the previous resistance and price has closed above the blue pivot, even pushing briefly above the R1 pivot before this retrace. Is this still wave 4 of the C wave? We don't know yet. If so, then we can expect to move to the lower pink box, most likely, before moving up with the next set of impulse waves. Currently, tensorcharts.com is showing significant visible supply on the order books immediately overhead. There is also strong visible demand immediately below price as well. Volume has continued to drop on the H1 suggesting that we may still be in the corrective wave. The next set of impulsive waves up should break through the volume downtrend on the H1/H4 TFs. As always, traders should be utilizing strong risk management and waiting for confirmations before entering a position.
The H12 shows the recent upward breakout being rejected at the McGinley Dynamic, but it also shows higher lows and highs from the January 13th low. The lack of a green (white on my chart) D1 candle yesterday makes the January 14th bullish engulfing candle reversal suspect, so we must continue watching the daily closes. The bigger picture remains. We have what appears to be an accumulation TR without a Spring currently printing, denoted by the horizontal blue lines. We have the outer resistance levels denoted by the horizontal red lines (these are ultimately the levels traders should be watching). We have the impulsive move up from the ST. Volume has continued to drop since the PS, suggesting consolidation toward a significant move in either direction. We can see the descending green dashed line, which is aligning with the 50 EMA, and a move above that should see volume increasingly significantly. We can also see there is a possible support building along the ascending dotted black line. The blue zones above the TR note D1 supply. D1 MACD is curled up suggesting bullishness building, as well as having printed bullish divergence on the histogram between December 7th and January 13th. D1 RSI continues printing higher lows and highs so far.
A move above the D1 pivot will likely target the upper pink box and then the descending green resistance. My belief remains that if this occurs, then price will hit that green resistance, drop back for a retrace, possibly using the ascending black dotted support to bounce from, and then push through the resistance. I have outlined this possibility in orange, and it would align with the expected movement of this TR completing without a Spring. A move to the lower pink box could still see price following this movement, but it also increases the chances of a retest of the lows at the lower red line. So, as mentioned above, traders need to remain cautious. We will discuss this in detail, as well as look at the smaller TF charts during this morning's live stream.
As I have continued to warn traders, we need to see volume increasing as price increases to provide the fuel needed to push through that nearby overhead resistance. Failure to do so means price is most likely headed down. However, down may not be bad. If there is a move down from here to the ~$2900 target, then it could very well just be a Spring which would indicate bullish momentum incoming and we could expect a very nice move up. However, we would have to wait until that point and evaluate price action and volume at that time.
Every day, we have a choice to act positively or negatively, so if you get a chance, do something decent for someone today which could be as simple as sharing a nice word with them. You just might change their day, or even their life.
Remember, you can always click on the "share" button in the lower right hand of the screen, under the chart, and then click on "Make it mine" from the popup menu in order to get a live version of the chart that you can explore on your own.

EURCHF May Continue Or Change The Trend !EURCHF has been in a decline for the past several weeks. The trend may just continue or it may change its course as the price approaches crucial support level of 1.11000. Currently looking at the weekly charts (the main chart) the price is trending down just shy of the crucial 1.11000 level. Ina few weeks the price is expected to reach that crucial support and then from there on it may either make trend change and aim for the above red line resistance levels or it may continue to head south where other support lies.
Have a look at the daily chart in the below snapshot.
The price action has developed a descending trendline and it has been respected on numerous occasions. A further confluence factor can be intensified for LONG trade if the trendline breaks together with the resistance of 1.15000. Its advisable to enter LONG when the 1.15000 level is broken and retested so we can get a better risk to reward ratio. On the flip side should the crucial support of 1.110000 break then it may or may NOT follow the current descending trend!. However the main thing that needs to happen is that the support needs to be broken convincingly so our probability can increase.
All in all its a matter of being patient and let the price action play out so we can take a more risk to reward favored opportunity when the right time and circumstances appear. This is just my analysis and shall there be any trade signal i will post them in a new thread. cheers

Potential Daily & Weekly SHORT Trade Developing In EURAUD EURAUD at the moment is providing us with both a swing and day trading opportunity which is still developing and might be complete soon. After hitting the strong crucial resistance of 1.63500 level not once but twice in a span of months the pair seemed to be headed towards the next support level that lies in the region of 1.55000.
Have a look at the main chart here as the weekly 50 EMA seems to be present just beneath the weekly candle and can potentially act as a dynamic support. until this weekly 50 EMA is broken convincingly to the downside we then only can confirm that the price is headed to towards that support of 1.55000 level. As i repeat the price has rejected the resistance level of 1.63500 twice and forming a double top chart pattern. This acts as further evidence that the price is headed south for time being and a potential SHORT SWING trading opportunity can only arise given the weekly 50 EMA can be broken convincingly
Now onto the day trading opportunity, have a look at the daily chart below
The red line represent the weekly 50 ema support thats present on the weekly chart. moreover For this day trading opportunity to take place the the price needs to break the daily 50 EMA and slightly retrace before we can make our entry. Our target ofcourse would be the WEEKLY 50 EMA here.
This is just my analysis and shall there be any trade entries i will be posting them in the new thread. Hope this helps. cheers and happy trading

KIWI Trying to Resume Its Downtrend, 0.61000 Level In Sight !Kiwi was not performing against the USD that good last year and this year might be the same case scenario too.
Have look at the above Monthly charts picture for NZDUSD. There are numerous long term trendlines one of which was broken a few months ago signalling the kiwi headed south towards another long term trendline located at around 0.61000 level!.
The main chart is the daily version showing that there is ascending trendline developing and if in the coming days it breaches the kiwi might head south. Basically it seems its just a consolidation move before the downtrend starts to resume. Shall there be any updates i will provide them below in the comments. any trade set up would be provided too together with entry, sl and tp levels.
cheers happy trading

EURUSD Trying to reach Crucial 1.1600 level and Weekly 50EMA !For a long while, EURUSD has been confined in descending wedge and currently hovering at the descending trendline of the wedge. By looking at the current weekly charts, the price shows thats its confined in a wedge. last year the price action formed head and shoulders pattern, adding to this the neckline was also broken to confirm the pattern completion. On A long term scale based on technical analysis the price is forecasted to continue its decline further below.
However in this particular case, EURUSD seemed to be focused on targeting the ascending trendline of the wedge before making its next move!. So what are the confluence factors supporting this statement? we will be analyzing them below
First of all, have a look at the current weekly charts. the price seemed to have bottomed for now and its slowly ascending higher. technically there is a channel present on the daily charts that needs to be broken in order to confirm this move. have a look at this image below of daily charts showing the price confined in the channel
For the channel to break on the daily charts, the price needs to break the ascending trendline and retest slightly before we can go LONG on this trade. our target would be focused on the weekly 50 EMA where also the 1.16000 level resistance lies!. We can opt to take this pair further LONG in the near future if the weekly EMA 50 breaks and could target 1.1700 level
Fundamentally this pair is under pressure as donald trump is pressuring the FED not to raise rates and 2019 seems is likely to be slow as FED might not raise the rates more than 2 times or it can be even less. the trade war seems also to be showing its effect in some major economic calendar events not in favor of the USD. To add to this, the EUR itself is not doing so great but on the balance of things taking this pair LONG seems to make sense for now.
Once the criteria are met i will post the update to this trade in the comments below. For i am just waiting for the channel to break on the daily charts before i can think to take action. stay tuned for any updates

Will the 50 EMA Hold or will we see support off the 200 EMA?Gold has broken through the 1 hour support line and the final price action before the weekend, saw a small bounce from the 50EMA.
As you can see we have an underlying 4 hour support line, which will nicely coincide with the 200 EMA.
Monday lunch time should see gold give its indication of where price will move to next, a short term pull back before continuing the uptrend or the potential for the uptrend to continue. Overall a long trade, this will be one to wait for a good entry point.

BTC Update! Increasing bear volume & loss of EMA support!
Well first Merry Christmas to my followers and anyone checking out this chart. I hope each and every one of you gets to enjoy the holiday with your family.
Wanted to get a quick update for BTC here. I had personally exited my positions and locked in profits a couple of days ago as BTC started its lower highs and lower lows on hourly and 4 hour charts. This however lasted a very brief time and I was very impressed when bulls set $3775 as the low before climbing back to a new high of this move which is now $4239. Bulls held 26 EMA on the 4 hour chart for that pull back and I was expecting them to lose it before trying for higher highs. So instead I remained patient and recognized my initial thoughts were if we had gotten a bull break originally above our high (at the time it was $4175) that I was not expecting much follow through. So here we are a few days later and that follow through only yielded $64 before we started pulling back again.
This pullback is different in my opinion for a couple of reasons.
1. We have lost 26 EMA support on 4 hour chart
2. We saw the initial red candlestick up near the top and then saw the INCREASING bear volume behind it.
So those are negatives. If I were looking for positives, I'd give a couple reasons here as well.
1. The bulls held the initial low of our pullback 3 days ago (the $3775) albeit by $11.
2. The daily chart found support on its 12 EMA.
So what next? I continue to remain cash personally as I still want to see that daily chart consolidate more and form its healthy higher low. I would consider bullish entries if hour chart can turn higher lows and higher highs but ideally want to keep patient and wait. Will $3775 hold again? I don't know but I was leaning No last post and I remain of that same mindset. $3775 was not enough consolidation in my opinion and I still think there is more to come. Perhaps bulls turn it around and don't fall lower but I'll wait and see. ETH and LTC who have both run harder, are also falling harder with about 20% and 17% pullbacks respectively in the last few hours compared to about 10% for BTC. We are definitely seeing some increased volatility today so it does have me protective as I don't care to be involved in a whale battle with fast swings in price action.
Likely no chart update tomorrow unless something exciting happens so once again, Merry Christmas! Please like, share, comment.
Just My 2 Sats!


$BTC LOG SCALE ON COINBASE FAT BEARIf you look at the daily Coinbase chart and switch it to a log scale chart. Then you will see that the uptrend is stronger than you thought but you will also see that we have been in a Bear market since price closed below the 200 EMA back in January of this year. I have been told that many long term institutional investors use Log Scale charts -vs- standard Linear Scale charts when they are making TA decisions. Either way I feel that it is in my best interest to try and swim in the direction of the current. With that being said institutional money has been short since last December when the $BTC Futures contracts launched. Who do you think ran the price way up to $20K just so they could short it at the tipsy top? Every week since they have been short, balance heavy in the futures market so until we see them swing their positions to the long side then I feel that we are looking at more downward pressure. Not only do we have problems with several adult man children fighting over their toys ($BCH Drama) but their is no one with a vested interest to defend $BTC at this level. What I mean by this is, when the CME and the CBOT decided to launch $BTC futures contracts then on that day they started buying physical $BTC and how many years did it take them to stand up their products? How many years ago was that? The institutions are into $BTC much lower than many would think so don't be surprised to see $BTC slide to $1,500 or lower. Just my 2 nickles. DCA + HODL = Success. Viva La Crypto!!!

BTCMXN 1H BITCOIN SIGNAL STRATEGY INDICATORIf buy/sell signals do not post on chart then use this alternative strategy

NZDUSD 30M BIG 3 INDICATORThis is for educational training concerning the Big 3 Indicator
Big 3 indicator is great for continuation trades
After chart and price analysis showing a double bottom Big 3 shows Bullish continuation trend
I would have waited for a breakout of the bullish resistance level shown
I added a 50 ema to show trend - price above 50 ema so bullish bias
I would exit trade when price closes below 50 ema

LSKBTC STE PULSE TRADING STRATEGYSTE Pulse Trading Strategy paints a background red bar for short setup
Entered short at open of next candle
Took Take Profit at a previous support level
Trailing SL
PM me if you have any questions I could answer for you
