Most EUR Pairs Forming H & S Pattern! Behold The EURCHF In my personal analytical opinion its when a H & S pattern opportunity appears, its always a great set up provided you have done thorough technical analysis!. Recently for the last few months and weeks most EUR related are forming this pattern with many eyes being on the EURUSD itself. However, we traders seek not only good technical analysis but what set up could give us a better risk to reward scenario in return. Due to many EUR pairs forming this pattern its safe to say that once the neckline is violated we need observe what pair has least resistance path which can help us achieve our take profit levels with ease!
EURUSD has many supporting structure that can prevent the EUR from sliding down to the required target. In my personal analytical opinion EURCHF has the best path of least resistance and it gives a better risk to reward ratio compared to other EUR pairs.
Once the weekly candle closes below the neckline, i will wait for the retest of the neckline on the weekly chart before i can enter this trade. Its a pretty high probability set up as the price has rejected the crucial resistance and the next support on the monthly time frame is present far away from the neckline of the pattern.
Its an exciting analysis and it remains to be seen how the EUR pairs react in the coming week ahead. Any updates regarding the signals would be available once the criteria is met. Lastly do NOT ever underestimate the power of the EMA 21, 50, 200. Cheers have a nice day
Exponential Moving Average (EMA)

EUR/USD Getting TighterOn the H4 chart we can see that the space is squeezing the instrument even more. EMA showing mixed dynamics and confirming the range.
This is expected to continue till Tuesday when EURO GDP(Preliminar) comes out, which would push the instrument in either direction depending on the figures. Additionally, FED's Monetary Policy Statement coming out on Wednesday, and don't forget the NFP on Friday. High volatility is expected for all events so our job would be to stay calm and listen to what the market tells us.
In my opinion, there will be a strong burst out of the triangle, which would be a great opportunity for some profitable trades.
Highest probability trade in my view - Wait for break of either side, let it run and enter on the correction. On the upper side, we are looking to target 1.1850 area; If support is broken - target 1.1500 area.
Once we have development, I will post appropriate entry points based on my strategies.
Stay patient, money is coming...

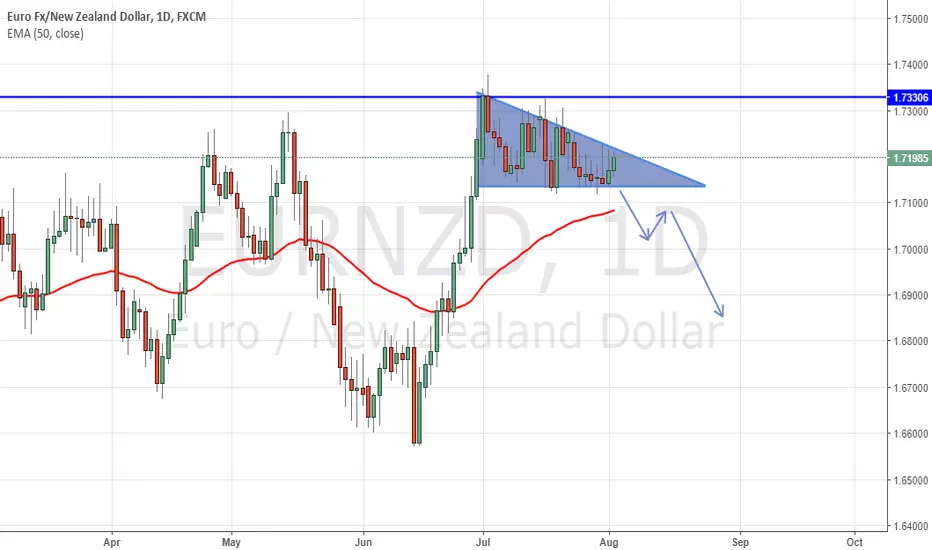
EURNZD Rejecting Strong Resistance Level! Reversal On The Cards?
As seen from the Weekly charts the price has rejected the upper trendline on numerous occasions!. A possible break to the downside is getting more and more apparent. As noted the 50 EMA on the weekly chart can act as a strong dynamic support which lies at the 1.6700 level. This apparently could be our take profit target if the price happens to break to the downside!
Now coming onto the main daily chart, it can be seen that a flat bottom structure is forming and 1.71200 is being held as a crucial support that needs to be broken in order for us to take the trade. However the daily 50 EMA is also acting as dynamic support that needs to be broken prior to this trade getting executed. Personally i would wait for the daily candle to break and close below both the support and the daily 50 EMA, followed by a retest of the 50 EMA for targeted entry.
The risk reward ratio on this one is favorable as well. It remains to be seen what would happen. If at all there are any updates i will list them below. Cheers
EURAUD Weekly Chart H & S Pattern In Process!Like the EURUSD, This pair is in the process of forming a head and shoulder pattern!
Once the pattern is complete a break to the downside would be on the cards. Furthermore the weekly EMA 50 would also be violated in the process thus reducing the amount of support levels in the process. Once the neckline is broken i will wait for the retest of either the weekly 50 EMA or the neckline itself before i place the trade.
It might take a few weeks for the pattern to complete but its worth the wait as its a high probability pattern and the risk reward might be 1:2 or 1:3.
I will update this thread later in the future shall the criteria meet.

USDJPY Weekly Trendline Violated! Chance To Go LONG
The weekly long term trendline on this pair has been broken and a potential long opportunity is setting up.
I am currently waiting for the channel that is forming on the 4 hour chart to break and retest the 50 EMA on 4 hr chart. Stay tuned for any updates!
However i will only take this trade when i exit my other active USD position. I do not want to risk my capital buying 2 USD pair at the same time. Nevertheless its a good opportunity and if your analysis meets the criteria you can execute at your own risk!

EURJPY Bulls on the horizon? Potential LONG TradeThe Monthly chart image below shows the major resistance and support levels to look out for this pair.Currently the price is stuck between 126 and 131 levels and its looking to retest either of those levels again the coming days
Looking at the Monthly charts again it can be observed that the price is confined in the long term triangle. Currently the price is being supported by the 50 EMA monthly which can act as a strong support!
On the weekly chart, it can be seen that the trend is supported by the two long term trendlines. Furthermore a descending wedge was broken which adds to the list of probabilities that price is ready to go up.
Now Finally onto the Daily chart, The price Must break and close above the 50 EMA for the position to be valid for long entry
The Final entry criteria will be based on the 4 hour charts when the price retests the 50 EMA.
When the conditions are right i will place the trade signal in the thread below.

GBP/JPY Confined In A Wedge/Flag. Potential Breakout On Horizon?Just like its parents pair (GBPUSD), The pound is just consolidating at the moment and a potential break to the upside is on the cards!. What is preventing the breakout at the moment is that the price is confined in wedge. To add to the list of confluence factors a flag has also been formed and the violation of the upper trend line would see a GBP push to the upside.
The above daily GBPJPY chart represents the price being confined in a range!. A potential break to the upside would also break the dynamic resistance of 50 EMA in the process.
The above monthly chart represent the potential resistance that this particular pair may face after the breakout. Furthermore, this could be our TP level as well. The risk reward ratio on this is pretty good as well. It remains to be seen what happens in the near future and what GBP related pair could give us more feasible or excellent risk to reward ratio.
Any Signals will related to this post would be posted under this thread. If you like my analysis please help me with a LIKE and FOLLOW me for more future ideas and signals.

NZDUSD. Bears Struggling to close below 0.6800 Crucial Support!The Bullishness of the USD is likely to return to full strength provided if the FED keeps on track to raise the rates another two times before the year ends. NZDUSD has been taking a beating recently and for now looking at the Monthly chart, depends on where the candle closes either above or below the crucial resistance at 0.68400. If candle closes as a Doji which represents an indecison, then it would be risky to trade this pair.
The Weekly chart however shows that the lower wedge trend line has been violated a few weeks back. Given the break of the this Trend line NZDUSD is showing signs of consolidation before heading for another dip. Keep in mind the direction for short on this pair depends on where the monthly candle closes and how it closes.
The Daily chart shows the channel forming has been broken (not yet, depends where today's candle closes). Its a further confluence factor that NZDUSD is consolidating and will likely rise to retest the broken trendline of wedge on weekly charts.
Both Fundamentally and Sentimentally NZDUSD is a SELL for now. I would personally not place any trade until i see how the monthly candle closes and the downward pressure which might occur in the coming month. at the moment i am just watching this pair closely and if the criteria for short position is met i will execute it in the near future.
ANY SIGNALS ALERT WILL BE UPDATED BELOW. PLEASE IF YOU LIKE THE ANALYSIS GIVE ME A THUMBS UP AND FOLLOW ME IF YOU WOULD LIKE TO RECEIVE MORE

USDCAD Potential Wedge breakout and Exhaustion On Monthly chartsPrice is looking to breakout of the Daily wedge formation. Looking at the image below (weekly charts) the price is also confined in the wedge and is looking to test the lower trendline soon after rejecting the upper trendline.
On the Monthly timeframe a strong resistance of 1.2800 has been broken and now acting as potential support. There have been around 3 strong bullish candles indicating the bulishness of the USD, however an exhaustion is likely to take place and bring the price down temporarily
In short, The USDCAD is showing signs of exhaustion on monthly timeframe and is looking to test the lower part of trendline on the weekly time frame. On the daily chart there is enough evidence and probability to suggest that a breakout is likely. Please be aware this is a just analysis and potential break of the wedge will be intensified if it breaks and retest the EMA 50 as well. When all the criteria is met a trade can be placed
FUNDAMENTAL ANALYSIS
As we all know USDCAD is a commodity currency and currently the oil market is in correction and most likely headed up. Any news regarding the OIL affects this pair greatly so always read up. Personally i am neutral fundamentally
Commitment Of Traders
Large speculators have been dumping the USD and are in favour of the CAD inspite of the bullishness of the USD. This is probably because the recent uptrend in OIL. In short its a good stage to go SHORT when the wedge breakouts but i expect the USD to resume its uptrend after the exhaustion has been processed.
Overall its a good position to go short and take advantage of the Exhaustion move that USDCAD has to offer
If you like my analysis please give a like and follow me if you would like to read more and learn from these charts. Any trade entries if valid and meets my criteria will be updated in their respective charts

GOLD A Great Setup to go LONG. Price at Crucial Monthly Support!For Decades now the yellow metal has been precious and the long term trend also indicates that its an uptrend. Looking at the monthly charts there is a clear ascending trendline which has been tested and held for more than 5 occasions. This is a very strong indication that the dynamic trend line is acting as a crucial support.
Looking closely at the weekly charts, it can be observed that the longterm trendline is being tested. In my opinion its been held for more than 5 occasions and i think this time it will be held as well. Also i have another reason to believe that GOLD being a precious metal would NOT DIP that much.
Now coming onto the daily charts, it can be seen that the price has been confined in the downward channel. Its a further confluence factor that the rebound or any reversal candle would indicate the price will likely head up. A HAMMER has already been formed indicating a reversal is a likely scenario.
Now Finally, to confirm a reversal at the crucial support, The main chart shows a channel developing (4 hour charts).i would personally prefer for the price to break the channel on 4 hour time frame and retest the 50 EMA before i take this position LONG. Overall its a excellent set up with multiple confluence factor in favor of our direction. Stay tuned for any signals in the comment
IF YOU LIKE MY ANALYSIS, PLEASE GIVE ME A THUMBS UP AND FOLLOW ME FOR MORE ANALYSIS

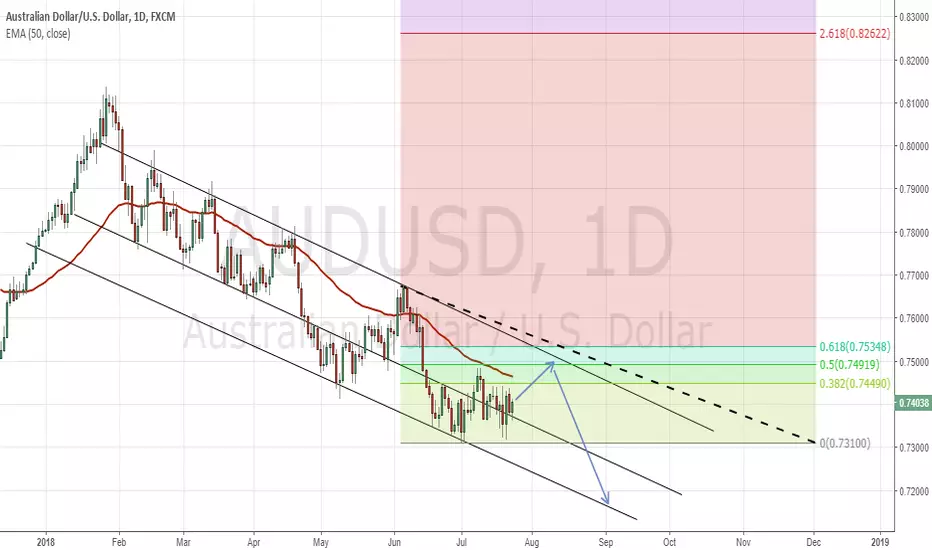
AUDUSD Targeting 61.8 Retracement. Another Drop in Sight!You can say that AUDUSD has been taking a beating not only from the USD but also the GOLD market and How the Chinese economy is performing due to the issues with the U.S. Odds are in favour of another drop in AUDUSD both technically and fundamentally . Sentimentally its also looking good to go short on this pair.
Looking at the daily chart AUDUSD is looking to target the 61.8 retracement of the previous swing high before heading for an extra drop. Monthly Timeframe confirms that the price has closed below the crucial resistance level of 0.7600 now potentially acting as support. Another crucial support in sight on the monthly timeframe is the 0.69500 level. See the attached monthly image below:
On the Weekly charts, A descending channel is in progress and test of upper trendline is in sight (61.8 retracement of previous swing). Price will likely target the crucial support of 0.69500. See the weekly chart image below:
In short, the probability is high that the price will retrace before heading down for another drop. However If the price happens to reach the upper trendline of channel on the daily chart, a reversal or high test candle needs to happen so as we can place a trade.
FUNDAMENTALLY:
The AUDUSD has been taking a beating due to the dollar bullishness. Futhermore AUDUSD being a commodity currency linked strongly to GOLD, is also under performing due to decline in GOLD prices recently. Another strong factor that also limits the advance in AUDUSD is also linked to how the chinese economy performing at the moment, which is not very well. Fundamentally a short position is in our favour at the moment
COMMITMENT OF TRADERS:
Sentimentally large speculators have been dumping the Aussie for a while now. open interest in the market is decreasing too. Dumping AUD has eased up in the recent week suggesting a consolidation period might take place
Overall its a good position to go SHORT on this Pair. I will wait for the price to test the upper channel before making any move on this pair.
IF YOU LIKE MY ANALYSIS PLEASE GIVE ME A LIKE AND FOLLOW ME FOR MORE FUTURE ANALYSIS. Please be advised that if a trade opportunity appears i will update below.
Broken Trend Line & Possible Head and ShouldersPrice already broke below the trend line and currently is being rejected on the retest. We have a strong resistance at the top at the 95.50 level and another resistance at the 94.70 price level.
We have completed a left shoulder and the head already, and based on what I mentioned above, it looks as though we will be forming the right shoulder soon.
more confirmation is the fact that the 5 EMA (green) is below the 21 EMA (red), and still below, but testing the 144 Fibonacci level Simple Moving Average.

GOLD Long Term Bullish CaseJ of KDJ is showing short term oversold conditions - look for quick bounce opportunities. KD of KDJ oversold but not at new lows same w/ RSI. MACD long term convergence - look for potential breakout with increase in volume and volatility. 100ema should hold as support or else more bearish than bullish. Would add a small position with stop loss around 1125.00. Previous cases exhibit more likely scenario to be a short term bullish opportunity.

BTCUSD MONTHLYWe can see 21ema as strong support and resistance on the monthly candle chart. The KD and RSI on KDJ & RSI indicator is not yet at their relative lowest, however, J on KDJ is meeting new lows, which can mean a short term bullish bounce or maybe the start of a slow bullish uptrend. Macd is showing almost maximum convergence, which means we may naturally see some volatility soon when they begin to diverge. Volume has been decreasing all year. High volume will confirm breakout

LTCUSD 2H EMA LONG STRATEGYStep #1: Plot on your chart the 20 and 50 EMA
The first step is to properly set up our charts with the right exponential moving averages so we
could be able to identify the EMA cross at the later stage. The exponential moving average
strategy uses the 20 and 50 periods EMA.
Most standard trading platform come with default moving average indicators so it should not be
a problem to locate the EMA either on your MT4 platform or Tradingview.
Step #2: Wait for the price to trade above the 20 and 50 EMA and wait for the
EMA crossover
The second rule of the exponential moving average strategy is the need for the price to trade
above both 20 and 50 exponential moving averages and secondly, we need to wait for the EMA
crossover which will add more weight to the bullish case.
We refer to the EMA crossover for a buy trade when the 50-EMA crosses above the 50-EMA.
By looking at the EMA crossover we create an automatic buy and sell signals.
However, since the market is prone to do a lot of false breakouts we at Trading Strategy Guides
need more evidence than just a simple EMA crossover. At this stage, we don’t know if the
bullish sentiment is strong to push the price further after we buy so we can make a profit.
To avoid the false breakout we added a new confluence to support our view which brings us to
the next step of the exponential moving average strategy.
Step #3: Wait for the zone between 20 and 50 EMA to be tested at least twice,
then look for buying opportunities.
The conviction behind the exponential moving average strategy relies on multiple factors to
confirm a new trading idea. After the EMA crossover happened, we again need to exercise a
little bit more patience and wait for two successive and successful retests of the zone between
the 20 and 50 exponential moving averages.
The two successful retest of the zone between 20 and 50 EMA gives the market enough time to
actually develop a trend.
Never forget that in trading no price is too high to buy, and no price is too low to sell.
Note* When we refer to the “zone between 20 and 50EMA” we actually don’t mean that the
price needs to trade in the space between the two moving averages. We just wanted to cover
the whole price spectrum between the 2 EMAs because the price often times will only briefly
touch the shorter moving average (20-EMA) which is still a successful retest.
Step #4: Buy at the market when we retest the zone between 20 and 50 EMA.
If the price successfully retests the zone between 20 and 50 EMA for the third time we go ahead
and buy at the market price. We now have enough evidence that the bullish momentum is
strong to continue pushing this market higher.
Step #5: Place the protective Stop Los 20 pips below the 50 EMA
After the EMA crossover happened and after we had two successive retests we now know the
trend is up and as long as we trade above both exponential moving averages the trend remains
intact.
In this regard, we place our protective stop loss 20 pips below the 50 EMA. We added a buffer of
20 pips because we understand we’re not living in a perfect world and the market is prone to do
false breakouts.
Step #6: Take Profit of your choosing or once we break and close below the 50-EMA
In this particular case, we don’t want to use the same exit technique as our entry technique
which was based on the EMA crossover.
If we would be waiting for the EMA crossover to happen on the other side then probably we
would have given back some of the potential profits because we still need to consider the fact
that the exponential moving averages are still a lagging indicator.
Note** The above was an example of a BUY trade… Use the same rules – but in reverse – for a
SELL trade. However, because the market goes down much faster, we sell on the 1st retest of
the zone between 20 and 50 exponential moving averages after the EMA crossover happened.


Bitcoin Passing Through 200EMA: EMA strategyThis is a simply strategy. Once we crossed the 200EMA this is considered an uptrend. I am seeing a lot of similarities with where we are now & where we were in April when we had a run up to 10,000. Things are looking bullish imo


A Neutral Idea on BTC not Bear or BullNOTA: Para Español, Ir hasta abajo!
What do you say about this scenario, Sellers are getting tired if you can say it so, we have less volatility day after day since weeks ago, maybe it could indicate a bottom perhaps??? we are at #1 return point I signaled before on other analysis, we can have a Bounce over the 6k support line, we have been here for 3 days in a row, that didn't happen since months ago, and the SAME Logic used for resistance we should use it for Support TOO.
Orange Line #1 IF in the next hours we don't break down this Support Area to the 5.4k levels and downer, we should have a spike. And this SPIKE should Break the 6.4k Level of resistance (a Relevant one) which is converging with EMA 26-30 too, AND the bearish Trendline (So this is a Big Resistance Area Right Now). Then, We can make a Trip to the next Resistance Trendline in the 8.2kish (Remark This) We could Break it for Further movements or be rejected as expected to lower points maybe bellow 6k to 5kish and lower. READ THIS WELL AND CAREFULLY, don't get caught by FOMO later and don't say no one warned about it, This could be a trap for bull and bears too.
Blue Line #2 We can definitely break the bearish trendline from January, and we can go again to test the 10k, specifically 9.8k (in this area there is a lot of Resistance too and it is a psychological WALL like the GOT one with the white walkers and stuff). We can expect a rejection here since it is so hard to pass thought, indicating a False breakout of the January Trendline and go to retest again 6k and lower supports. (Maybe to #2 Return point-you shall see previous analysis to know what I'm talking about).
Yellow Line #3 We break #2 Setups and go to next resistance at the 11-12kish area, were major Resistance is stablished before a Bull run can set it's foot. This is the furthest target I honestly can see within my scenarios. I expect a rejection here if we consider a market cycle not finished yet at this point. IF we get over this area (12k) then a bull run or at least near the 20k run could easily take place (I would have to do other calculations here) so in essence consider this scenarios.
Red line 1 and 2 #4 We break Down the 6k levels to next support areas 5.4k and 4.5k with the lowest probable point in the 4.2k, at the same time we get at the 2nd point of return (check previous analysis) and get in a stable growth.
NOTE: Other fact I can support on is the RSI, it shows a possibility for an upward movement in July, Check the RSI and it's previous behavior, right now it is testing resistance, if it breaks it we shall see further movements on the price of course.
Good Luck!.
__________________
ESPAÑOL
¿Qué dice sobre este escenario? Los vendedores se están cansando si se puede decir, tenemos menos volatilidad día tras día desde hace algunas semanas, ¿tal vez podría indicar un fondo quizás? estamos en el punto de retorno n. ° 1 que señalé antes en otro análisis, podemos tener un Rebote en la línea de soporte de los 6k, hemos estado aquí durante 3 días seguidos, eso no sucedía desde hace meses, y la MISMA Lógica que se utilizó para los puntos de resistencia, deberíamos usarlo también para Soportes.

ETHUSD 1H How to Profit from trading PullbacksStep #1: Identify a Bearish Trend which is characterized by a Series of Lower
Highs and Lower Lows
Identifying the direction of the trend should be a fairly easy process. The easiest method that
our team at Trading Strategy Guides likes to use to identify the trend is the swing low and high
structure. In essence, an downtrend is defined as a series of lower highs followed by a series of
lower lows
Note* It’s important to use the higher time frame to determine the trend regardless of the time
frame you normally base your trades on.
Step #2: Switch to the 1h Time Frame and Wait for a Pullback against the
downtrend
After successfully identifying the trend, we can switch lower to our preferred time frame. It can
literally be whatever time frame you feel more comfortable with but, for the purpose of this
pullback trading strategy, we use the 1h time frame.
Step #3: Place Your Fibonacci Retracement Indicator between the last swing
high and low levels, prior to the pullback.
Identify the most recent swing high and swing low and place your Fibonacci retracement
indicator between the two swings.
Step #4: Sell Anywhere Between the 50% and 61.8% Fibonacci Retracement
area
After you’ve placed the Fibonacci retracement mark on your chart the area between the 50% and
61.8% Fibonacci retracement and sell as soon as we trade within that area. It’s up to you
whether or not to sell as soon as we hit the 50% or to wait for the 61.8%.
With experience, you’ll be able to fine tune your entry and profit from trading pullbacks.
Step #5: Place the Protective Stop Loss above the Swing High
The last swing high used to draw the Fibonacci retracement levels can provide us with a very
attractive place to hide our protective stop loss.
A break above the last swing high will invalidate the trade so we want to minimize our losses and
get out of the trade.
Step #6: Take 1/2 Profit once we break below the Previous Swing Low
In order to profit from trading pullbacks we need a strategy for taking profits as well. In this
regard, the ideal place to liquidate our position is once we make a new low.
The market never moves in a straight line and most of the time after we break to new lows a
pullback occurs most often than not. So, if you want to be in an out of the market very quickly
that’s the easiest way to profit from trading pullbacks.
Alternatively, if we want to maximize our profits we can only take half of the profits once we
break to new highs and the remaining half of our position to be taken at a Fibonacci
extension level.
We exited at the -61.8% fib extension.
Note** The above was an example of a SELL trade… Use the same rules – but in reverse – for a
BUY trade.
PM me if you want to read the complete strategy.

BTC recovering a bit at the momentRight now we have a bounce in Major Support area, Although it was broken. We have Buying Climax, Good bull pressure at the moment, but be careful with traps, you all know my strong analysis.
We can be headed to 6.9k where I found first good resistance using Fibonacci, if we can get pass through this area, we might try to break stronger resistance at 7.6k, speaking of which we couldn't get pass last week, so I really don't believe we will this time- I'm just aware that anything can happen, and indeed, we can break it.
This is a 'zoom in' chart analysis. we also have RSI showing strength and a bounce in the 20 level at oversold area, and has crossed above the smoothy EMA so, we also have an important resistance at level 56 in RSI but I guess that just something to watch out not SO important.
I will be updating this chart as soon is showing some good info!
Give a like guys!!

200 EMA playing supportHere's a brief update on EUR/USD cross.
The main downtrend channel broke and what was earlier a difficult to break ceiling, the 200 days EMA, is now playing the role of a support.
Its role can be shown in the 200 EMA rejection that happnened (with consistent volumes) today.
Overall the trend seems a bullish one but the macroeconomic situation (Italian situation, trade war...) can deeply affect the future developments of the cross.
***As usual, not a trading advice but merely my idea for informational and educational purposes only***

Bitcoin at a turning pointQuite a lenghty analysis, worth reading in my opinion.
Bitcoin is currently showing signs of weakness. It is no secret (see my last analysis) that it is into a downtrend and the breaking of the bear flag confirmed it.
Prices are still trading below the 200 days EMA and that level had been tested at least four times in the last month in the 4h chart. Every time rhe prices approached the 200EMA, there has been a major pullback. That level, in my opinion, will keep being a major level to watch. Both for psycological and technical resistance.
Parabolic SAR (not shown in the chart) shows signs of weaknesses too. It simply confirms the bear market we're in at the moment.
Volumes are definitely low at the moment. Seems like the market is accumulating and "sidewalking". This shows uncertainty in the market and it is definitely not a good sign, especially if coupled with a bear market.
Technically speaking I highlighted two major areas to focus on.
The green one, around 9400, shows the level at which a reversal may appear. The breaking of 9400 (with a supporting volume) may signal the end of the bear market and the reversal of the trend into a bull market.
The red one shows the current support at around 7800. If such a level is violated BTC is likely to fall even more and at a faster rate. A possible TP could be identified by the prolongation of the "pink line" that plots the uptrend support of BTC from it's launch.
As a side note, less technical and more "macroeconomical", we are noticing how the market is getting somehow more mature. The big boom that took prices up to a 19k figure now diluted and even the appearance of institutional investors (big investment banks) into the market did not inflow much more liquidity into the system. Although I still think this market is headed for the collapse I think it will take some time.
As a final thought, remember that "cash is a position"!
**Not a trading advice, merely my idea and analysis for informational and educational purposes only**
