GbpjpyI drew up the trendlines, added 2 emas! When a candle breaks and CLOSES through a line, you can scalp to the next line you see on the chart and if it continues to break the next line hold your position! But if it doesn't break the next line and turns around then close your position.
Exponential Moving Average (EMA)

Personal Request - What's my opinion of the GBPNZDDay - Price at BB Dev 1 top band - Watch where day closes
4H - Price needs to breakout of the SMA's range
1H - Watch if 50 sma holds - Price may be retesting support - New fractal high
made
15m - Wath if 50 EMA holds
Watch red/green arrows indicating possible directional choices price can make
4H has possible target prices from breakout

GBPAUD - SHORTjust an idea, manager you own trades, tp and sl. waiting for a good candle pattern on a lower TF if not no trade will be taken
FOREXCOM:GBPAUD

Buy now or Cry later (+1000% possible)Long Story short: Every time in history we got a triple crossover of the EMAs, it was at least a +100%. Now we got a crossover AGAIN and the EMAs are looking juicy. I expect the altseason to be NOW and guys: Just buy PAY-Token and wait. It will burst through the roof.
Tip me if you want to:
BTC: 3DQaTesgoDpNXijqGD95uWwq1JEyQVUmKR
LTC: MCY1ituKjtq3iGbNAutGWDS8aY6r27epRq

BTC (so far) holding - bounces off 12/26 EMA, downtrend channel.Title says it all.
If $BTC falls below any of those indicators, or if today's daily engulfs the price gains from the last few days, be concerned.

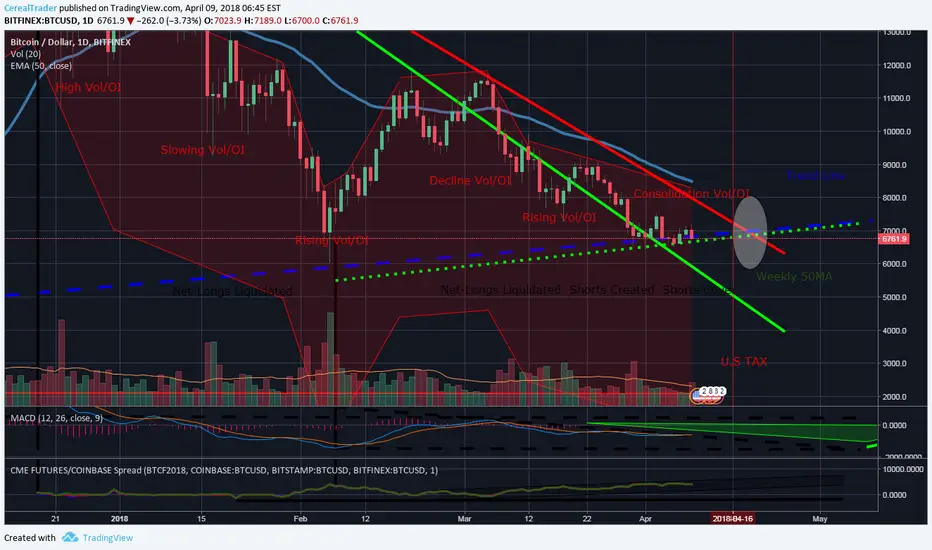
Bitcoin BTC - Future's indicator directionBitcoin Futures being a indicator within itself, although considered small in comparison to traditional futures, can predict trend reversals. Using three indicators:
Price (direction), Contract Volume (contracts traded within day increases pressure related to price direction) and Open Interest "OI" (contracts rolled over at end of day determine flow of revenue) as criteria become particularly useful as reversal signals.
We have had net-long positions (both early contracts and current, for those who expected price reversal) liquidated due to downward price trend and market uncertainty, this is displayed within both Cboe & CME. Onward from this we had an increase to contract volume & open interest as shorts were created now currently being covered as slight consolidation of both volume & open interest showing.
The pattern displayed is that of initial bottoming of price/volume/open interest, following the "flowchart" of futures indicates consolidation of all three indicators before a final direction is chosen being these three indicators are contained which provides large leeway either side. While futures are affected by technical analysis such as Flags, H&S, EMA, those are usually on smaller time spans and rely on previous data and a lot of the time are already priced into the futures created.
Looking at the CME Futures spread, overall the contracts are increasing hence the black upward trend which should be expected due to the limited time-span and nature of Bitcoin Futures, this should be taken into account when determining levels but should also be taken as positive when viewing Bitcoins future (as need both buyer/seller to create contract, spread hasn't changed much)
Quite interesting the US capital gains first quarterly tax is due around the April expiry of Cboe Futures.
Futures would indicate that the price range is bottoming with possibilities of most likely one more price drop before market rise, before US tax, Market rise after vol/OI consolidation or most unlikely, replay of net-longs being liquidated adding downward pressure to price to find a new bottom.
This being only an signal should be taken into account with others such as volume (Sigwit now implemented by major exchanges but volume level seems to indicate traders are selling to traders, Retail is needed for recovery) and the Trend Line & Weekly 50MA converging to add support to break $11500 major resistance, both of these are needed for overall trend reversal but with volume proceeding trend, Futures are starting to become effective indicator for when large flow of money initiates.
www.cftc.gov
www.cmegroup.com
BTC is seeing some tough times , so I should write this:
***Education Purposes only***
The Coinbase Big Three All Due for a Big MoveETHUSD/LTCUSD/BTCUSD all sitting around the bottom of a descending wedge on the daily, due for a move in the next week or two, if not sooner. BTC, like always, will drive the market in a major move before April 22, either down to the 5900 level or back up to the 9000 level before making a larger jump or fall.

Long EUR/USD Long EUR/USD with a good Risk Reward ratio. Could be seeing a 50 EMA bounce up with a 40 RSI bounce. Also stop loss below previous support line on the hour chart.

Bitcoin - Elliott Wave RiseAnalysing this channel for a possible exit...not downwards/sideways but upwards.
Can see price consolidation within the current channel of Mcginley Dynamic and 200EMA as volume is now at lowest level since $6000 although becoming reactive at any chance of trend reversal, good sign, showing trader's hunting for a bottom. It seems likely volume will continue to be a issue during future resistance levels, as they say "volume goes with the trend" so without volume we are going nowhere.
.......how do you get volume without volume, still researching this question.
RSI - holding steady around 40, definitely can be seen as undersold with room to rise but without volume it may have to retrace slightly downward under 30 or align with another indicator for this to be beneficial.
StochRSI - Bearish, oversold and heading downwards, will add pressure to increase time span before Elliott (ABC) commences.
MACD - Bearish, waiting for lead up with entanglement on the cross-over.
The end of the Elliott Wave (12345) price dip could lead to a increase of volume, if this happens, it could result in an initial RSI dip making undersold a viable trade.
What would make the Elliott Correction Wave (ABC) attractive is if BTC price rebounds back into the Green upward channel (created from current price stagnation and current Fibonacci Retracement) & above the McGinley Dynamic (which would become support) This would likely see slight trend correction which will again face resistance at 0.786 Fibonacci & then 200EMA (B & C).
Being that BTC is currently holding the 0.50 Fibonacci level which is converging with McGinley Dynamic, sideways movement from this point may break down the future Elliot wave (ABC)
Side Note: With Volume so low and CME Futures at record Contracts (Open Interest is low, but this could be seen as reason why price has lost volatility.
www.cmegroup.com

BTGUSD: Bitcoin Gold is Alive and Kicking! BUY & HODLThe price gives good trading opportunities, while the price is higher EMA
EMA was retested earlier and held,
This indicates the strength of the trend
Entry point: 57
Stop: 53.8
Target1: 71
Target2: 76

GBPJPY shortThis is my first post but EMAs about to cross and retest and gbpjyp may be a sell....all your comments are welcome.thanks

US30USD long, pennetIf it break about the pennet, ill buy, loking for the fib extension 1.618.
1:1 target.

Buy EurUSD, pennet??Wait for the breakout.
ill say buy, if it breakout :)
Sell, fib extension 1.618.
1:1 target

Temp. resistnce/spprt update for BTC. Inverted h&s still in playEver since the bullish hammer spinning top 1 2 punch combo we've been on a nice up trend. yesterdays day candle finished strong right under the white 38.20% fibline ($10400) which was the previous 4 hour candle's line of resistance but has become the current 4 hr candle's support line. Yo can also see how the current 4hr candle dropped a wick down that bounced up off of the 20EMA. The 20 EMA(in purple) could potential be retested as the line of support for our low of the day...but the body will probably find the white fib line as its support. As far as the high of this current 4 hour candle and the high of it's body goes... it's still too early to tell but I notice we have already bounced down from about the halfway mark between the white fibline I spoke of earlier and the next fibline above it in red at the 23.60% retracement extension (10590) sothis candle's price action could be very tight we will have to wait and see if there will be a break out above or below either possibilities of support and resistance before determining whether or not its worth shorting or longing any positions. Lastly the reason this has a green backdrop is because we are still very much within the possibilities of a massive infverted head and shoulders...it is currently about halfway through the potential 2nd shoulder and still heading towards the direction neckline. Very exciting if this is a valid head and shoulders because that means as I have anticipated for at least 2 weeks now that it may be possible for a head and shoulder;s head to trigger more than one head and shoulders pattern.

1day chart's 50ema catches bulls & keep them in the rising wedgeSo we had a crazy plummet yesterday. We were long overdue for a retracement and this one was caught by the double reinforced support of both the 50EMA(in blue) and the bottom trendline of what I originally thought was just a channel..after adjusting it to the recent price action I have discovered instead it appears to be a an ascending wedge. The pice has stayed true to this wedge every since the most recent bottom so its definitly a strong source of both resistance and support. Interestingly enough the second inverted head and shoulder target I set up in the 15000s is, as you can see, the exact same price level as where the ascending wedge ends when I drew it until both lines converge...could this be simply coincdence? Who knows but it could be that our secondary head and shoulders breakout target price is valid after all. We shall have to wait and see...the closer we get to it the less the price action is gonna be able to move. It was comforting after we started the new days candle to see the 4hour chart ater a couple red candles throw out a green bullish reversal hammer patern. I'm still cautiously optimistic that with the strength behind this ascending wedge...it can help take us all the way out and break above the descending channel we've been captive of since december.

Litecoin (LTC) Technical Analysis and Trading Strategy. Follow!Between COINBASE:BTCUSD and HITBTC:LTCBTC , I must saw I'm more bullish about HITBTC:LTCBTC . I think we can all agree that the lower transaction time and cost make HITBTC:LTCBTC more competitive. Buy-in and sell points for HITBTC:LTCBTC , at least in the mid-term, are indicated by RSI deviation above and below the channel with a rapid increase or decrease in prices directly before. I don't have a buy-in range because it doesn't seem like a good time to buy or sell right now. I will be updating this idea a couple of times a day on this post until we even out or exit our upward-trending channel.
We're right around the middle of our channel here, so I'm holding tight. I'd like to hear your thoughts on HITBTC:LTCBTC ! Please comment below, as the more input we see, the more informed we are!
*** This is not a recommendation to buy or sell, this is for educational purposes only! ***

wave 5 rally ?waiting for Guppy-EMA to signal a buying opportunity to catch a potential wave 5 rally

ASH Commences New UptrendAshley Services Group has begun a new uptrend. This is marked by the breakout on significant volume of the 200EMA (daily). The price has consolidated since the break for a number of weeks. The exit for this position is set at two days trading below the 200EMA, or one day if the move is a significant break. My entry at 18c is limited by 9% downside to the 200EMA.
This is a long term momentum-based position. There is no target price for this position - it has unlimited upside and downside limited to 15% - both based on crossing the 200EMA.
From a fundamental point of view the company has recently shown some strong evidence that it has successfully turned itself around from recent losses. Continual improvement in earnings is likely to fuel growth over the medium-term. The company is currently trading on a trailing P/EBITDA ratio of around 4.5, which is by no means demanding.

todays day candle stuck between 200EMA & T-lineTodays candle has been stuck between the T-line(yellow) and the 200 EMA(orange). Being that the market is currently bullish and we finally closed above the t-line yesterday I anticipate the candle to eventually break and close above the 200EMA when it finally gets squeezed over it by the t-line. In the meantime I anticipate we will see the candle wick below the t line a couple times since the 200EMAs resistance is being reinforced by the light green fib retracement line. Far too tight of a range right now to do any range trading. It's been the same price for hours. Hopefully that will change sometime today as a break for the bears.

LTC has lots going for it todaySo the one of the last 4h candles FINALLY closed above the 50 EMA. Prior to that it kept getting pushed below it like a a bully to a kid on the playground. The following 4h candle opened and stayed above the 50 EMA too, so that's great.
We have stayed in a tightening range which is pushing back against the resistance hard, bulls are starting to wake up. We have a bull MACd cross on the daily as well, with a sexy looking doji candle on the weekly chart, all of which are pointing to a bullish breaking point that is going to happen very soon. At least so I imagine. if we break bearish (which I wont eliminate as a possibility) it will probably be because of a lack of bull volume. But, it's starting to show up and may be holding back until just enough pushes us past some of these lines. When it does though, I'm optimistic that it will push us past 175 resistance and help us form some daily higher highs.
Not much new, just wanted to point the break past the 50 EMA and that sexy weekly doji candlestick. Like, comment with feedback, and follow! As always, I'm no professional, but a LTC enthusiast for sure, so DYOR, chart your own crap, and don't take my fin. advice (because that's not what this is at all).
Peace and hair grease.

BTCUSD Continuing to stay inside Bearish Channel & above 200EMASince BTCs decline from its all time high in December you can see it hasn't gone outside of this downward channel (in green) and today so far seems to be no exception. Another extremely reliable line of support BTC has not dipped under and has in fact bounced off of several times in the last 6 years or so is the 200 day exponential moving average (blue line) on the day chart. I predict that once again it will stay above both the bottom line of the green channel and also above the 200EMA. Set your stop losses an position exits accordingly...if it falls under that line I will be exiting my position but may increase my position slightly above those lines with the anticipation that it will bounce upwards.

XRP Nose DivingAll indications are that XRP is heading for a major nosedive, after yesterdays rumours of Coinbase listing XRP during routine maintenance didn't come true we saw massive sell volume and XRP dropped from around 11100 sats to this mornings low of below 10200 sats. We keep seeing oversold indicators but then very little buy volume, 70 and 100 ema are well and truly above where current levels. We just broke through the support that had be previously tested 4 times and it powered straight through it, if trend continues, we are looking at moving to previous levels before December 2017.

Buy VRC/BTC4H :
- Up trend
- Level : Trendline
- Signal : Ok
=> Stop Loss : 0.00013760 ; Take Profit : 0.00018200
