Bullish Idea on the EUR/CHF making a new higher high since 3/21.EUR/CHF has made a new higher high since 3/21/22 and breaking out the resistance zone above the 200 EMA and MACD confirmation.
Possible bullish idea.
EMAS

Oil Price and financial crashes This chart shows the correlation between the oil price and the different financial crashes. During the melt up to a financial crash does the price of sky rocket and during the aftermath does the price crash.
The oil price of today only matches the oil price of the Russian energy crisis and the Great Recession. Seen in this chart is a slight pull back onto further continuation upwards as the war in Ukraine continues does the oil price continue upwards.
The supply chain crisis causes economies into a recession and this is also a reason to believe an increase in oil prices as oil is a stability.

Bitcoin CrossroadsBTC weekly historical performance relative to EMA's provides interesting perspective and a rather key inference...
# of Times the 20 EMA has crossed below:
50 EMA: 3
100 EMA: 1
200 EMA: 0
20 EMA Crossings:
1. 20x50 Sep 2018
1a. CONTINUATION downward resulting in additional -58%
1b. 20 EMA only crossing below the 100 EMA
1c. 20 EMA bounced off of 200 EMA
2. 23 Mar 2020 - Reversal with upward trend only
3. 18 April 2022 - APPEARANCE OF CROSSROAD - Trend continuing downward so far...
The most recent 20 EMA crossing below is recent, however the trend appears initially to be a downward continuation.
Worth keeping an eye on as the Federal Reserve and Central Banks look to increase 50 bps this afternoon and the quantitative easing that has been in place since Bitcoin's inception ends and the Fed becomes more hawkish with quantitative tightening.

High Tension Lines In 1 DTF//VTLStrong Support Downside!!!
As you are aware of my new strategy which is majorly depended upon the HTL (High Tension Lines) with a T (Triangle) formed around.
Look at the PERFORMANCE RETURNS generated by my previous posts(ADANITRANS,PHOENIXLTD) it is working perfectly fine if executed correctly mates.
Lets all watch how this VTL is gonna go, join me by following in trading view, if interested we all can trade together!
Peace Mates!!!

One More Low, before significant pull backhi, I see minor pullback is done or almost done.
I have sell position targeting 1860-1840 area before expecting a significant pullback.
Trade Well,
Alex

BTCUSDT - up and downI have been viewing the last weeks (since the Jan low) as a reversal pattern, with higher highs and higher lows on a weekly and daily time frames. We are currently trading under significant multiday averages (20, 50, 100), and bounced off the 38200 level.
The current channel looks like a giant bear flag. We might break down further from here towards 36k and then 30k.
I am not short yet, and I am hesitating to go short due to the fact that I am fearing rally here. The reason I am expecting this rally is because in this channel, which looks like a giant bear flag, we have been creating higher highs and higher lows on the weekly time frame. We are not on the lower border of the channel and unless we brake below it soon I dont think we will see 36k for some time.
I will place a pending short @ 38700.
SL 40000
TP 38000
I will also place another pending long @ 39600
SL 39000
TP 42600

Gold gave us the one more low we wanted. now pullback time?Hi, we close all sell trades with great profit, now I see gold can start making pullback.
i see good buy opportunity aiming "A" Wave.
Trade well,
Alex

Bear still looking for last salmonHI, I see price can go for one more low to complete final wave before pullback can happen.
trade well,
Alex

Bactesting CCI + EMA scalping 1mI am just trying to see if i can use CCI + EMA for scalping on 1m on eurusd. next will try 15 minutes
Buy when CCI crosses green line -110 or sell when crosses down red line 100. Also trying to figure out what rr ratio should be used, 35 pips or previous structure.

we saw One More Low, Pullback time?hi, gold created one more low as expected and we had a good profit secured.
I see pullback possibility from here to 1950 region up to 1969.
good R:R
Trade well,
Alex

GOLD, One More Low.Hi, I see price still could go for One More Low, before any pullback happens.
Trade Well,
Alex

Just pullback, no Bull, still Bear.Hi, I see price making pullback ranging from 1930 to 1970 area before resuming its journey downside.
though I am selling the trend & bought the pullbacks,
i will favor sell more than buy at this time.
trade well,
Alex

Pullback time, before further declinesHi, we made good profits and closed the trades on wave 3.
i see now price could make pullback to wave 4 area before completing 5 waves down.
i have sell limit waiting on wave 4 area.
trade well,
Alex

Litecoin Move Imminent...Hey Traders,
As you can see on the Daily Chart of Litecoin. The support/ resistance line has been very key in the past, but now it is acting as resistance again. The RSI is ramping up hinting a breakout! Hope you can trade this!
Safe Trading,
-Pulkanator

Bitcoin Symmetrical Triangle Breakout Imminent!Hey Traders,
As you can see, the price action has formed lower highs and higher lows. The volatility has also dropped massively as evident in the Bollinger Bands. The RSI which I didn't bring up is having higher lows and equal highs, showing the strength is ramping up. The target out of this breakout is 42k, however, it may break down so the other target is 39k.

Waiting Patiently for the next bull runAll EMA lines stabilizing. Waiting for the 50 to cross the 100 day EMA to confirm mid term bullish run but could be an instance where you see the 50 cross both the 100 and 200 day EMA. Overall, bullish sentiment is there RSI weekly value below 40 and tons of bearish movements bound to correct itself and reverse.
Great time to scalp price of ETH.

Economic Bubbles and EMA 100/200 seems to be playing outThe Ethereum chart seems to be following the analysis provided at April 7th where the 20 EMA dropped down below 200 EMA and is continuing downwards towards the 100 EMA and the 50 EMA signalling continuation of this analysis provided on April 7th.
ETH has so far dropped from April 3rd to its point now by 17% and from April 7th by almost 10%.
This is not financial advice.

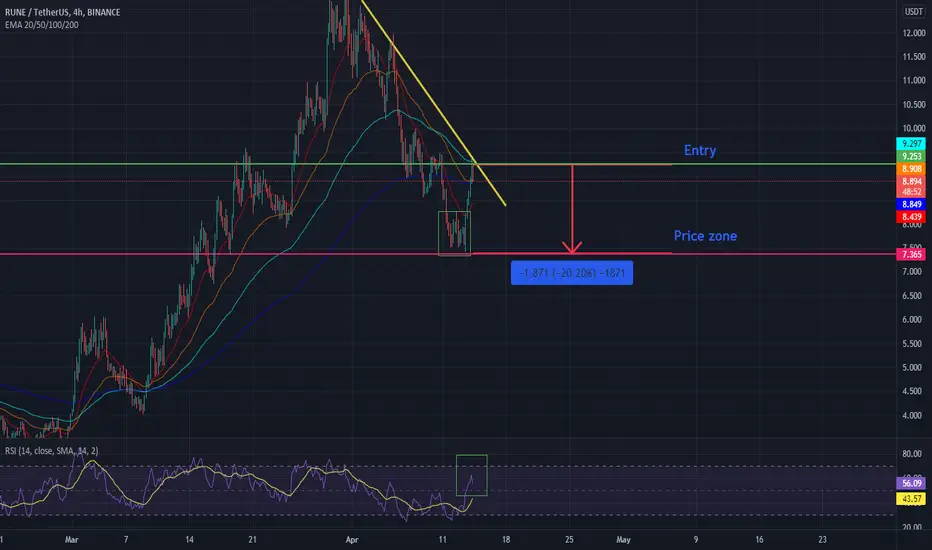
RUNE/USDT double top playing out The RUNE/USDT has showed a double top pattern on the 4H chart and is likely to play out on the longer time frames.
This follows a likely price drop from 9.29 USDT to 7.38 USDT. A drop in 20%.
This also follows a rejection from the EMA lines and the RSI shows signs of being overbought.
Here has the analysis showed sign of playing out on the daily time frame.
No financial advice.
Going Under the 3-EMAS As the medium reaches below the slow EMA
Here we have a great SELL signal
Keep in mind that this is NOT an intra day signal.. This one will require time
But assures a great stability and why not, hopefully, profit

ETH/USD: Bought in the smart zoneEthereum it's look with bullish perspective that could to reach the mark of $3,800 USD. Also to take reference, we see that Ethereum make support in the EMA 200, and also applying the Fibonacci, Ethereum showing us a good zone to buy Ethereum in the 0.382% in Fibonacci level. So, I add Ethereum contract in this trade toward $3,800 USD. I put my SL to $3,110 USD. This will be a risk/benefit of 1:3 and it's excellent proportion to measure our risk vs. benefit.
I hope that this Daily idea support you!!!

Swing Short Setup 1) Bearish Volume Divergences
2) Bears pierced EMA (Exponential Moving Average)
3) Swing Trading Sell Signal
4) RSI crossed its SMA (Simple Moving Average)
Conclusion:
Bitcoin will dump.
Target is on the red dotted line.

Economic Bubbles and EMA 100/200Here is an BTC analysis of the current price drop, and based on the Theory of Financial Bubbles can we spot three bubble ish formations in the past years.
The three points in time this analysis sees are the bubbles in 2018 when the price drop followed by a pump to the upside, not as high as the previous high but this was followed by a drastic drop
The market followed the economic bubble theory with a peak which followed by a price drop, by the time the price started to stabilize itself did investors take profit and the price crashed into a panic sell off.
The second point in time this happened was the start of the Covid pandemic which caused the price to follow this same movement to its low.
Now in 2022 can we see this similar movement where the price has started to drop which will continue downwards and after this initial downtrend will the price pump slightly upwards where investors take profit and after this pump will the price crash. Following the Financial Bubble Theory.
Something we trader also need to take into account which may confirm this analysis is the movement in in EMA 100 which during these three points in time crossed down below the EMA 200.
Entry Price: 3200 USD
Target Price 1: 2500 USD
Target Price 2: 2100 USD
Target Price 3: 1700 USD
When taking this position do we need to focus on the initial drop and when the price pumps upwards do need to take into account for the downwards sloping resistance line, if the price breaks the trend line to the upside is the trend likely to reverse and do a final longer push.
This assumption is less likely to happen, as the general price trend is a take profit zone before the price hits the panic zone and its final drop off.
This pump from the initial low may have already happened in the case of BTC, which we did not see in ETH yet. Meaning that the price now touched the downwards sloping resistance before continuing downwards.
Together with a negative price strength, an EMA 100 below the EMA 200 and the price doing its second pump into the take profit zone before the drastic drop can we build a theory which looks negative.
This is not financial advice.

Economic Bubbles and EMA 100/200Here is an ETH analysis of the current price drop, and based on the Theory of Financial Bubbles can we spot three bubble ish formations in the past years.
The three points in time this analysis sees are the bubbles in 2018 when the price drop followed by a pump to the upside, not as high as the previous high but this was followed by a drastic drop
The market followed the economic bubble theory with a peak which followed by a price drop, by the time the price started to stabilize itself did investors take profit and the price crashed into a panic sell off.
The second point in time this happened was the start of the Covid pandemic which caused the price to follow this same movement to its low.
Now in 2022 can we see this similar movement where the price has started to drop which will continue downwards and after this initial downtrend will the price pump slightly upwards where investors take profit and after this pump will the price crash. Following the Financial Bubble Theory.
Something we trader also need to take into account which may confirm this analysis is the movement in in EMA 100 which during these three points in time crossed down below the EMA 200.
Entry Price: 3200 USD
Target Price 1: 2500 USD
Target Price 2: 2100 USD
Target Price 3: 1700 USD
When taking this position do we need to focus on the initial drop and when the price pumps upwards do need to take into account for the downwards sloping resistance line, if the price breaks the trend line to the upside is the trend likely to reverse and do a final longer push.
This assumption is less likely to happen, as the general price trend is a take profit zone before the price hits the panic zone and its final drop off.
This is not financial advice.
