LTCUSD | Will halving get us through the resistance?Good morning,
One month to go until Litecoin Halving.
Since the beginning of the year, we have been constantly moving between the daily EMA 200 (white) and the EMA 800 (purple).
At the time of this idea, we are back below the EMA 200 and all of our EMAs have flattened out.
With such news events, existing resistances and old liquidity zones can usually be worked off well.
I am therefore preparing for two scenarios.
Scenario 1 (blue)
We come in July again significantly above the EMA200 and our short EMAS, 5+13 pull along.
In this I would use 50% of the capital that I want to use for this idea.
The other 50% when breaking above the EMA800.
Scenario 2 (orange)
We get a stop hunt of our range.
Everything from $71.60 would be a top price and would lead to 50% accumulation.
The other 50% would come into play should we get back into the range after such a stop hunt.
Price Targets :
Around $110 and between $140 and $150.
EMAS

SMA & EMA in Trading!Combining Exponential Moving Average (EMA) and Simple Moving Average (SMA) in your trading strategy can provide you with additional insights and confirmation signals. Here's how you can use both indicators together:
1| Understand the differences: EMA and SMA are both moving averages but calculate the average differently. SMA calculates the average closing price over a specified period, while EMA assigns more weight to recent prices, making it more responsive to current market conditions.
2| Confirming the trend: You can use both indicators to confirm the prevailing trend. For example, if the price is consistently trading above both the EMA and SMA, it suggests a bullish trend. If the price is below both the EMA and SMA, it indicates a bearish trend. The confirmation from both indicators can increase your confidence in identifying the trend direction.
3| Identifying crossovers: Crossovers between EMA and SMA can provide valuable trading signals. A bullish crossover occurs when the shorter-term EMA (e.g., EMA20) crosses above the longer-term SMA (e.g., SMA50 or SMA200). This may indicate a potential buying opportunity. Conversely, a bearish crossover occurs when the shorter-term EMA crosses below the longer-term SMA, suggesting a potential selling opportunity.
4| Dynamic support and resistance: EMA and SMA can act as dynamic support or resistance levels. During an uptrend, the shorter-term EMA (e.g., EMA20) may provide support, while the longer-term SMA (e.g., SMA50 or SMA200) acts as stronger support. In a downtrend, the shorter-term EMA may act as resistance, while the longer-term SMA acts as stronger resistance. Observing how the price reacts to these moving averages can help you make trading decisions.
5| Confirming reversals: Crossovers between different EMAs and SMAs can also help confirm trend reversals. For example, if the shorter-term EMA crosses below the longer-term SMA and both lines start sloping downward, it may indicate a bearish trend reversal. Conversely, a bullish trend reversal can be confirmed if the shorter-term EMA crosses above the longer-term SMA, with both lines sloping upward.
6| Fine-tuning your strategy: Experiment with different combinations of EMA and SMA periods to find the ones that work best for the specific market or security you're trading. Shorter-term EMAs (e.g., EMA20) respond faster to price changes, while longer-term EMAs (e.g., EMA50 or EMA200) provide a more smoothed-out view of the trend.
Remember that no trading strategy is foolproof, and it's essential to consider other factors such as market conditions, volume, and price patterns. Always practice proper risk management by setting stop-loss orders and using appropriate position sizing techniques. Regularly review and adjust your strategy based on market dynamics and your own trading experience.

How to use EMA200?EMA200, also known as the 200-day Exponential Moving Average, is a widely used technical indicator in trading. It helps traders identify the overall trend and potential support or resistance levels in a particular security or market. Here's how you can use EMA200 in your trading strategy:
1| Understand the concept: The EMA is a moving average that assigns more weight to recent price data, making it more responsive to current market conditions. The EMA200 calculates the average closing price over the past 200 trading days and plots it on the chart. It is often considered a long-term trend indicator.
2| Determine the trend: By observing the price action in relation to the EMA200, you can determine the prevailing trend. If the price is consistently trading above the EMA200, it indicates an uptrend. Conversely, if the price is consistently trading below the EMA200, it suggests a downtrend.
3| Identify support and resistance: The EMA200 can act as a support or resistance level. During an uptrend, the EMA200 may provide support, meaning that if the price dips towards or touches the EMA200, it could be a potential buying opportunity. In a downtrend, the EMA200 may act as resistance, where the price could face selling pressure if it approaches or touches the EMA200.
4| Confirm trend reversals: When the price crosses above or below the EMA200, it can signal a potential trend reversal. A bullish crossover, where the price moves above the EMA200, may indicate the start of an uptrend. On the other hand, a bearish crossover, where the price drops below the EMA200, may indicate the beginning of a downtrend.
5| Combine with other indicators: While the EMA200 can provide valuable insights, it's recommended to use it in conjunction with other technical indicators or tools to strengthen your trading strategy. This may include additional moving averages, trendlines, oscillators, or volume indicators.
6| Practice risk management: As with any trading strategy, it's crucial to implement proper risk management techniques. Set stop-loss orders to limit potential losses and determine your target profit levels based on your risk-reward ratio.
Remember that no single indicator guarantees trading success, and it's essential to combine technical analysis with fundamental analysis, market sentiment, and other factors when making trading decisions. Regularly backtest and refine your strategy based on market conditions and your own experience.

ENSUSDTOCEANUSDT is trading in bullish momentum ,currently the is hovering around support zone in 8.10 region. If the instrument hold this support region, it will be nice buying option.

What is the EMA? How to use EMA most effectively!What is EMA?
EMA or Exponential Moving Average (EMA) – An exponential moving average (EMA) is a type of moving average (MA) that is based on a weighted exponential formula that is more responsive to changes recent prices, compared to a simple moving average (SMA) that only applies equal weight to all periods, helping the EMA to smooth the price line more than the SMA.
What signals does the EMA provide to traders?
Moving averages offer a significant benefit by offering clear insight into price trends. In other words, the Exponential Moving Average (EMA) cannot exceed or remain above the price line unless the price is increasing. Similarly, it cannot be below the price line if the price is not actually decreasing. This is crucial for traders as it provides a distinct and reliable indication of the price trend, avoiding any ambiguity. The trend is essential in helping traders identify entry points.
The EMA will become a dynamic resistance, because it moves in the direction of the price, which means where the price goes, the EMA will follow.
Become dynamic support and resistance levels (these resistance levels can be used to compare the trendline, support and static resistance lines). From here will look for entry points, stop loss and take profit points.
Identify price trends.
Which EMA should be used most appropriately?
EMA 9 or EMA 10: This number represents a two-week period of trading, making EMA9/EMA10 commonly used for short-term transactions.
EMA 34/EMA 89 are used to align with the primary waves as per the Elliott wave theory.
EMA 20, EMA 50, EMA 200 are closely associated with trading sessions. Over the course of a year, we can typically trade for around 200 days, accounting for holidays and breaks. EMA50 represents the medium term, corresponding to the four seasons in a year, with each season having approximately 50 trading sessions. Similarly, EMA 20 represents the month.
Some traders also utilize the 250 EMA in addition to the 200 EMA, believing that 250 represents the number of trading days in a year.
EMA100 is a commonly chosen EMA due to its round number value. Round numbers are often seen as psychological barriers in trading.
Compare trendline with EMA:
As mentioned earlier, EMA is another way to identify trends, just like the trendline.
To better understand this concept, the trendline can be seen as a fixed resistance. Once you draw a trendline, it will act as a reference point for the price.
On the other hand, EMA is a dynamic resistance. It moves along with the price line. Unlike the trendline, EMA closely follows the price line because it is calculated based on the price itself. This makes EMA more accurate in showing the trend. It can clearly indicate whether the price is above or below the EMA.
Some notes with EMA:
- When the price surpasses or falls below the EMA, but then retreats below it again, it indicates a strong downtrend or uptrend.
- If the price strays too far from the EMA, it is advisable to wait for it to correct itself and return to the EMA before considering any trading actions.
- Fast EMAs or short period EMAs are more sensitive to price movements compared to slow EMAs, but they are also more prone to breakdowns. This can be advantageous as it allows for early trend identification compared to the SMA. However, the EMA is likely to experience more frequent short-term fluctuations compared to the corresponding SMA.
- EMAs act as dynamic resistance levels that consistently track the price line.
- The EMA is not primarily used for pinpointing exact tops or bottoms. Instead, it assists traders in aligning their trades with the prevailing trend.
- The EMA always has a delay, making the SMA more useful in sideways markets, while the EMA is more effective in clearly trending markets.
Thank you @TradingView !

AUDUSD - ready for next leg down?AUDUSD could present with a short opportunity if it breaks below 1000 EMA on 4 hrs chart

THIS is GSPL IDEA FOR TRADING2-time face rejection from 254 levels: stock trading above 100ema and bullish crossover
We can see stock form rounding bottom pattern. if a stock breaks its 254 levels it can go further easily as per technical analysis
educational purpose only!

EURCADEURCAD is trading in long term bearish trend. Every bounce is being sold heavily. 50 EMA along with bearish channel resistance, is putting the pair under sell pressure.

USDJPYUSDJPY is trading in strong bullish momentum in bullish parallel channel.
Currently it is trading at the lower rising trendline of the channel which also the support from 50EMA and 50% Fib retracement.
All these signals making bullish bias for USDJPY.

Long for CARERATING Stock trading above 50 EMA at monthly chart pattern. It may be trade till 950 in next 1-2 month and get almost 250 points.

NEARUSDTNEARUSDT is in wedge cage with strong bullish divergence while below 50EMA.
Will the 50EMA act like a magnet and catch the price to upside with a strong support from bullish divergence?

AWW🥹 IT'S FORMING >>MATIC<<A BABY EMA IS FORMING ON MATIC. IT'S SO CUUUUTE🥹🥹
YES, YES TOTALLY BUGGING... BUT THIS IS WHAT HAPPENS WHEN ONE STARES TOO LONG AT CHARTS.
ONE THING ABOUT CRYPTOCURRENCY IS THE FACT THAT THE ASSETS ARE SO YOUNG (EVEN THOUGH THE CONCEPTS HAVE ACTUALLY BEEN WORKED ON IN THE BACKGROUND FOR DECADES <<MORE ON THAT LATER.
Seeing a little EMA budding on longer timeframe made my day. Shorter timeframes always have EMA's, but long term EMA's take f-o-r-e-v-e-r to form.
So happy to see a sprout 🌱.
As always, take care.
#25Sigma

$AMZN - Pennant PatternIn which direction do you guys think this pennant pattern is breaking out to?
I'm seeing an RSI bullish divergence freshly created.
But I'm also seeing imponent 10 and 50 EMAs right above the price right now.
In short, the trend is our friend. That's the overriding principle. However, we also know that every trend eventually bends.
In any case, the conclusion to be drawn is that all you have to do with this market is wait and see which direction it wants to take. For it is about to disclose that information.
Finally, remember, that direction is meaningless for trading decisions in isolation. We need a target/take profit plan, a stop loss, position size, max ttl equity exposure ... a back tested trading system, confidence and mastery in the execution of such a system. Without these, you're trading blindly.
Cheers,
Tenacious Tribe - Backtested Trading Strategies & Studies
50% discount on all of our products, in our web, with the following code:
MOX Q3C WXRX

GOLD, Long opportunity.hello all!
I see a good long opportunity for gold with good R:R.
previous sell though did not hit maximum target, but closed in decent profit with trailing.
lets see if we can rock this one!
trade safe, trade well.
Alex

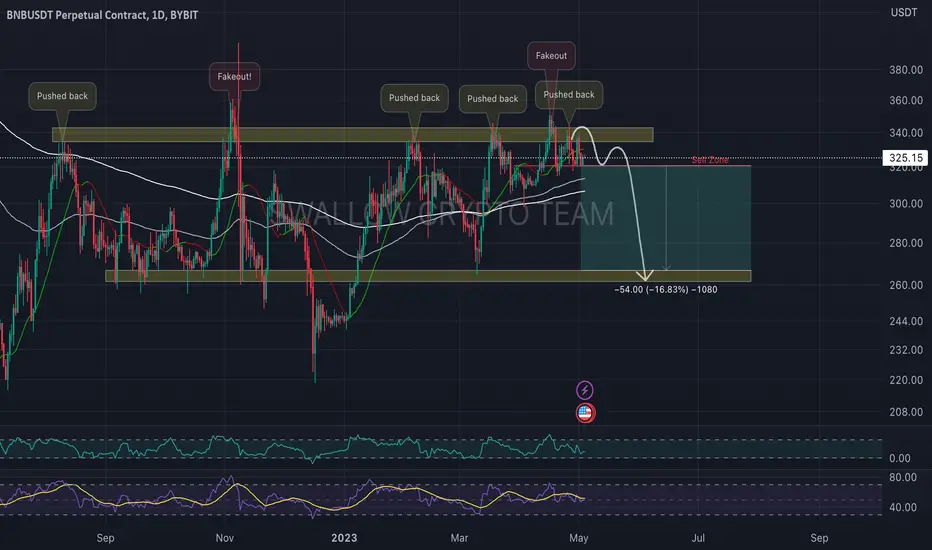
BNB/USDT had another rejectionHey guys 👋
Let's get back to BNB here where we see how price had another pullback from upper resistance zone and now we are on the edge of a cliff just waiting for a free fall. So let's see how we will end up here.
If you like ideas provided by our team you can show us your support by liking and commenting.
Yours Sincerely,
Swallow Team 🔱
Disclamer:
We are not financial advisors. The content that we share on this website are for educational purposes and are our own personal opinions.
Long in AUROPHARMAAfter Aug 2021 this stocks again start trading upper side of 200EMA.
First Target : 730
Second Target : 906

OCEAN/USDT TRADE SETUP! 100% PROFIT POTENTIAL!!Hello everyone, if you like the idea, do not forget to support it with a like and follow.
Welcome to this OCEAN/USDT trade setup.
OCEAN looks good in the daily time frame. Breaks out from the symmetrical triangle in the daily time frame. Also, holding 50ema very well. Buy some here and add more in the dip.
Target1:- $0.44
Target2:- $0.51
Target3:- $0.62
Target4:- $0.74
SL:- $0.35
If you like this idea then do support it with like and follow.
Also, share your views in the comment section.
Thank You!

EURUSD | Bull & Bear Final Boss FightOANDA:EURUSD
Eurusd Bull and bear fight is on going , till now in a 5 round match 2 round won by bulls
still 3 rounds remaining can bear fight back and steal this match ?
Well we have to wait for a while to see clear picture
till now market broke Pattern and trading up from trendline , if clear breakout happen than 1.1070 next target
bear need's today candle to close below 1.0990 to hope for selling pressure .

📊 The 3 EMA Crossover StrategyThe 3 EMA (Exponential Moving Average) strategy is a popular trading strategy that uses three exponential moving averages of different time periods to identify potential buying and selling opportunities in the market. The three EMAs used in this strategy are the 10 EMA, 25 EMA, and 50 EMA.
🔹What is an EMA Crossover?
An EMA crossover occurs when two different EMA lines cross one another. The crossover doesn't predict future trends, but rather shows the ongoing direction of a trend. That being said, the crossover might actually give a signal that a trend could be ending and will soon be replaced by a new trend.
🔹Why Use 3 EMAs Together?
The three EMAs can give stronger confirmation than just two EMAs crossover. It can also give a better context to the price action in relation to the three EMA lines displayed on the chart. Three EMAs crossing above the price at the same time is a strong bullish signal, while three EMA crossing below the price at the same time is a strong bearish signal.
The crossover of the 10 EMA above the 25 EMA and the 25 EMA above the 50 EMA is used to identify a long position opportunity.
This is known as a bullish crossover, indicating that the trend is shifting from bearish to bullish.
When the 10 EMA crosses above the 25 EMA, it suggests that the short-term trend is beginning to turn bullish, and when the 25 EMA crosses above the 50 EMA, it suggests that the long-term trend is also becoming bullish.
This combination of short-term and long-term trends shifting in a bullish direction can be a powerful signal for traders to enter a long position.
👤 @AlgoBuddy
📅 Daily Ideas about market update, psychology & indicators
❤️ If you appreciate our work, please like, comment and follow ❤️

US30 Buy IdeaBuy one the 38 fib coupled with the daily institutional EMA's (200, 100 & 50). Counter buy with potential of reaching the previous highs in this relief rally.

XAUUSD/GOLD INTRADAY TRADING IDEASthis is my idea on gold today 4/3/2023 I saw a triangle on gold today and to be more precise there is a symmetrical triangle. currently, the price is at an interesting level to watch because it was close to the strong support in 1960 and the trendline so it is even more interesting to watch. will gold break the strong support in 1960? or will fly back to test the nearest resistance again in 1980 or even continue higher to reach strong resistance in 2000. let's see, don't let your guard down, and stay tuned. do not enter if you do not have a strong reason or confirmation to enter the market.
good luck traders

APE/USDT In The Process Of BreakoutHey traders 👋
Let's keep it simple here, RSI and BB indicators are showing a bullish sign to us which resulted a breakout of structure. We see a good potential to grow here! Waiting for good entry!
If you like ideas provided by our team you can show us your support by liking and commenting.
Yours Sincerely,
Swallow Team 🔱
Disclamer:
We are not financial advisors. The content that we share on this website are for educational purposes and are our own personal opinions.

IOTX/USDT looking good for a potential short! Hey guys 👋
IOTX coin is going to be the first coin of the day. Where currently sitting just below that resistance we see a good potential for a short position here. BUckle up and let's go!
If you like ideas provided by our team you can show us your support by liking and commenting.
Yours Sincerely,
Swallow Team 🔱
Disclamer:
We are not financial advisors. The content that we share on this website are for educational purposes and are our own personal opinions.
