EURCAD Long Opportunity - MARCH RECAPGOOD SETUP:
Entered on the 15m TF, price was above EMA zone, however 30m candle closed just below...will monitor P.A and BE zone - price reacted On and slightly Above only for 15m - strong bullish momentum candle - going for 2RR
EMAS

Weekly double bottom on BABA has tested its 200 ema and consolidated on that level prior to falling back to confirm the double bottom formation. The coming months for BA are going to be interesting. An overall price target for BA will be in the 275-278 area. I can see this catapulting past that with a minor retracement. These levels haven't been seen since Mar 2021. I am bullish on BA in the coming months, with a short-term bearish retest of the weekly 50 ema 183.86. The formation is invalidated below the yellow line

📊Moving Average(MA): Use Cases📍 What Is a Moving Average (MA)?
A Moving Average (MA) is a popular technical analysis tool used in finance to indicate the stock's average price over a certain time frame. Its purpose is to reduce price volatility by creating a continually updated average price based on the stock's historical data.
The computation of a moving average helps to minimize the influence of unpredictable and short-term price fluctuations on a stock over a designated period. Two types of moving averages are commonly used: simple moving averages (SMAs) that employ a straightforward arithmetic mean of prices over a particular timeframe, and exponential moving averages (EMAs) that prioritize recent prices over older ones by assigning them greater weight.
📍 Simple Moving Average(SMA)
A simple moving average (SMA) is a technical indicator that calculates the average of a range of prices over a specific number of time periods. It can help determine if an asset price will continue or reverse a bull or bear trend. It is an arithmetic moving average, calculated by adding recent prices and dividing by the number of time periods in the calculation. SMAs can be short-term or long-term, with short-term averages responding quickly to price changes and long-term averages being slower. Other types of moving averages include exponential moving averages (EMAs) and weighted moving averages (WMAs).
📍 What Is an Exponential Moving Average (EMA)?
The exponential moving average (EMA) is a moving average (MA) technique that assigns more weight to the most recent data points. It is also known as the exponentially weighted moving average. Compared to a simple moving average (SMA) that gives equal weight to all data points in the period, an EMA reacts more strongly to recent price changes.
👤 @AlgoBuddy
📅 Daily Ideas about market update, psychology & indicators
❤️ If you appreciate our work, please like, comment and follow ❤️

Wakey Wakey . . XRP Gart & FakeyHey crew, gonna drop this on ya. I probably shouldn't because "they" watch my sh!t close and I've had to figure out how to post price levels without actually posting my personal entry / exit points. I've literally had orders miss filling ROUTINELY by as little as .001 to .0001 which as you can imagine is enough to drive a person to drink lighter fluid laced egg nog even if it's NOT Christmas.
So here's the shakey shake . .
1. Remember, XRP always pumps before dumps.
2. Keep an eye on Bitty and especially the S&P 500, there's some pretty good parity there and insight into overall market directions. It's still pretty comical that crypto will trade in some degree of parity to broader markets BUT, that's "probably" intentional because if "regulators" can make the case that crypto trades to 70% or greater correlation to broader markets then they can further strengthen their claim that crypto should be classified and therefore REGULATED like securites. (FtheSECbtw, you guys are F%$@#rs)
3. Garts pretty much NEVER play nice with XRP so don't be alarmed if/when this one doesn't either. Maybe we'll get some 50/100 day ema fingerbang action in which case, I'd be TP scalping from those 0.37 buys if you got em.
I personally like XRP at lower levels, who doesn't? Even if you're a salty bull from > 1$ levels then you know it's just more opportunity to lower the cost basis, amirite? ;)
Hold the line and don't be afraid to hedge even at these levels. I still think we have a date with 10 cents.
Stay frosty and remember, * * * Not investment advice * * *
Box

my scripsi have made or altered the showing scrips.
TDI on top with minor and major shark fin alerts EMA cross and altered mid line cross alert.
mid has two verry modified scrips
First is Two BB 200 and 30 EMA or SMA with alerts and channels and KC channel pull backs crosses and exits for varying uses and William's vix fix highlights and 5 ema's engulfing candle with rsi filter and super trend
some are not show or turned off but are available
Second is SMC intraday and swing trading liquidly zone FVG MTF Daily weekly and monthly high and lows and support and resistance and trend lines breaks and alerts
Bottom is stochastic momentum lots of level alerts and cross alerts and high lights
if you want any of this pack just IM and ask i can also extract any part and make a isolated script version for you
also have a MTF KJD and PSAR Oscillator

GOLD : Is Rug Pull near to corner ?OANDA:XAUUSD
Hi , Trader's ..gold bullish move was because of SVB Bank collapse
Now market is extremely over bought ,
Market need's to do minimum 50% retracement near 1880 area first tp
Tp 2 1855 area in extension where 50 and 200 ema
market can give sharp downtrend
❤️ Please, support my work with follow ,share and like, thank you! ❤️

GBP - Weekly/Daily close will be key! GBP - Weekly/Daily close will be key!
GBPUSD - At a very key resistance, we have NFP today that will shift the market. We did have GDP m/m Bullish 0.3 Higher than expected. I think when it comes to GBP there are very bearish views when it comes to there fundamentals and there rate hikes but I don't think the situation as bad as it's considered. What does this mean and how can we trade this opportunity? Well, we can first wait for daily close and see how we close and perhaps wait for pull back and get in long taking us back towards key resistance areas of 1.21 half areas and target areas 1.23. However, if we are fail to close above we are back within the range until further clarification. Don't forget to check minor pairs such as EURGBP & GBPAUD as commodity FX is lagging there are plenty of trading opportunities, including GB10Y W set up.
Now we do have NFP, if that beats expectation we could get pull back in GBP. However, if it comes out lower than expected NFP I expect dxy to decline and majors to rise. And see how price reacts if it beats expectations and by how much and vice versa - that's what is very key!
Now regarding GBP technical view:
High: 1.21560
Low: 1.18420
Pattern: Wedge/Channel
A break above the highs and 200/50 EMA I expect further bullish momentum and target area of 1.23 areas. If we are to break below of 1.18 handle then 1.15 is still on the table. However, at this current moment of time we are within the ranges and we have to respect that, in addition you could even go to lower time frame of 4hr and get better price!
Trade safe and have a great weekend!
Trade Journal

GOLD : Gold simple Trading Strategy OANDA:XAUUSD
Hi , Trader's our previous 9/10 forecast reached target
After NFP news , Dollar slip , Which Give momentum to Gold buyer's
Gold is Trading in Up Channel with 20,50,200 EMA supporting it
1854-57 AREA IS MAJOR RESISTANCE AREA WHERE SELLER CAN ACTIVATE THERE POSITIONS
❤️ Please, support my work with follow ,share and like, thank you! ❤️

USDCHF : Price Action StoryOANDA:USDCHF
Hi , Trader's .. As you can see price made double top , And now market needs to test neckline or support zone
Further Bearish structure confirmation will be made after Breakout of neckline
Short term target 0.9340 area target 2 0.9310
❤️ Please, support my work with follow ,share and like, thank you! ❤️

Bitcoin weekly pattern repeats ?As you can see in the chart, it would seem that history is repeating itself a little on the PA
There have been many that look at the PA from 2013 and draw similarities but I've not seen this and so I will post it again
It Must be noted that there is a tolerance of 7 days to these numbers as a weekly chart has 7 days, but its near enough as you can see
Using the 50 EMA ( Red )
From the ATH in Dec 2013, PA remained above the 50 for 266 days till it dropped below - 84 days later, it came back up and touched, pushed through briefly before going back down for another 427 days before it came up, broke through and continued above the 50 for another 784 days to the new ATH
PA has repeated this almost ecactly since the High around April 2021 and we are right on the point where PA, if it wasn't being hit by fundamentals / FED . Fear etc, would be about to push through the 50, as can be seen on chart.
If PA manages to break through now and continues along this "pattern" it would reach an expected New ATH around April 2025, which amazingly has confluence with some other charts and ideas.
For this to work, Obviously, the fundamentals have to work in Bitcoins favour and one of those may well be the continuing fight with inflation in the USA
It has to be said, there is NEVER any certainty with Fractals and Time pattern repeats but there does seem to be a strong similarity, and I find that Fascinating.
I hope you do too

GOLD : XAUUSD Buy From PivotOANDA:XAUUSD
Hi , Trader's Our last Gold Target Hit , We are trying our best to provide you simple and profitable analysis
Now market After Hitting resistance Bow reverse to it's pivot area .
Buyer's are buying Gold from Pivot point as Gold is safe heaven for investment
50 EMA also supporting GOLD , Increase in volume can make price volatile
❤️ Please, support my work with follow ,share and like, thank you! ❤️

GOLD Short Opportunity - March RECAPGreat Setup !
Price has downside momentum, retraced towards EMA and good P.A for entering, decent 2RR trade, will monitor trade and priceaction.

Power of Inside Bar - Cingniti TechInside Bars if used wisely, can give us astonishing results in Trading.
Let's understand this scenario.
Stock Name - Cigniti Tech
After 20th Feb 2023, on D TF, this counter merely had any move! More or less it had inside Bars with totally squeezed close prices compared to earlier close. if you observe, closing prices are getting squeezed day by day with drying up sales volume. This indicates sellers are loosing control & buyers ay pitch in!
Following are reasons for my Long view -
1. Stock is in Up Trend.
2. Stock prices are above 200 EMA
3. 10 & 20 EMAs are above 200 EMA.
4. RSI has crossed 55
5. Nifty IT index is in uptrend, so sectors is booming.
So my entry would be on crossover of high of 7th Feb. Same setup & logic can be applied while entering stock on 3rd March, as its crossing previous high of 2nd march for a quick move on upside.

Bear Bounce in META May Push Further before Downtrend ContinuesPrimary Chart: Daily Time Frame, 8-D and 21-D EMAs, Long-Term Fibonacci Levels (Retracements of META's Entire Range), Uptrend from Nov. 4, 2022 Low
SUMMARY:
META remains in a severe downtrend since its all-time high in September 2021. The primary-degree trendline remains unbroken and in effect. A shorter down trendline for most of 2022 has been broken coinciding with its recent upside price action.
META is experiencing a corrective rally, also known as a bear bounce (until proven otherwise).
Bollinger Bands support the idea of further upside with the mouth of the bands expanding, and price walking the bands to the upside. The Donchian Channels also show that price is reaching multi-month highs, and its 21-period range is expanding as price pushes higher.
Target 1 lies at $142. Target 2 is $149. Target 3 is $157-$158. Each target requires that price reach and hold the prior target on a daily close. Each target is a condition precedent for the next target's viability.
Invalidation levels include the uptrend line from November 4, 2022 lows as well as major support levels at $112 (key structural low), $115-$116 (volume profile).
META began its decline much earlier than the broader indices. It peaked at an ATH on September 1, 2021, while SPX peaked on January 4, 2022. It has appeared to lead indices by a few months in this bear market. The long-term uptrend line from 2012 more than a decade ago was decisively broken in early 2022. This suggests that it may take a while for META to begin carving out a new uptrend line at a less steep angle based on whatever bear-market lows are formed—whether that be the November 4, 2022 low or a (likely) new low in 2023.
Supplementary Chart A: Monthly Chart of META with Decade-Long Upward Trendline
The bear-market downtrend lines are shown on Supplementary Chart B. The pink line on the Primary Chart reflects the primary-degree of trend since the all-time high in mid-2022. That line has not been broken, and price remains well below it. The dark-blue line is a shorter trendline that lasts for most of 2022. It was broken to the upside in early December 2022. This is no surprise. Steeper trendlines are less sustainable, and often end up being replaced by their less steep counterparts. The break of the dark-blue line is not an end to the bear market, but it does signal a short-term shift that coincides with the sideways to higher corrective rally taking place.
Supplementary Chart B: Trendlines within META's Current Bear Market
In this bear market, META made its most recent low on November 4, 2022. An uptrend drawn from that low is drawn (pink line on Primary Chart above). META's short-term EMAs show that it has been rallying in earnest since this November 4 low. Note the slope of the 8-D EMA and the 21-D EMA. While these are simple indicators, sometimes their simplicity can cause some to miss the power of their message—indicating the short-term trend. The short-term trend remains positive, with price finding support at these EMAs. When price falls below the 21-D EMA, it quickly rises to reclaim it. See Primary Chart.
The Bollinger Bands also reflect the upward rally, which should be deemed corrective until proven otherwise. The Bollinger Bands are widening at the mouth, and when price pushes through the bands to exhaustion levels (set at 2 standard deviations on this daily chart), it falls back but quickly pushes back into the bands. Yes, the CPI could end this prematurely, but technical analysis suggests this stock has further to run before it resumes its longer-term downtrend.
Supplementary Chart C: Bollinger Bands
Similar to the Bollinger Bands, the Donchian Channels also reflect an increase in volatility to the upside. Price is pushing new multi-month highs, which is easily seen using this indicator. As the upper band of the Donchian presses higher with price touching it, that reflects new 21-trading-day highs. But a quick glance at the chart below shows that the highs exceed all highs since late October lows. The October 2022 highs are the ones that will likely be taken out next if the rally continues.
Supplementary Chart D: Donchian Channels
Major support lies at $112, and $115-$116. In addition, the upward TL can easily be used as an invalidation level for any short-term bullish trades. It can also be used as confirmation for any shorts that wish to enter when the bounce exhausts.
Targets are based on the measured-move concept and Fibonacci proportions. Target 1 is $142. That is the 150-day SMA. Target 2 is $149. This level is the measured move area where wave A (or wave W) equals wave C (or wave Y) from the lows. Target 3 is $157-$158. Target 3 is a confluence of levels including (i) the 1.272 extension of first leg of this rally projected from the start of the second leg, (ii) the .618 retracement of META's entire price range going back to the start of data on the chart, and (iii) the 200-day SMA based on today's date, which lies at $158.
The bounce idea is invalidated if price falls below $112-$116. It may also be invalidated (depending on several factors) if price breaks below the pink uptrend line from November 4, 2022 lows.
Lastly, to quickly and effortlessly see the major support (supply zone) for the current corrective rally, see the blue rectangle below. Breaking this level should signal the next leg lower is underway in the primary-degree downtrend.
Supplementary Chart E: Support / Supply Zone
Thanks for reading, and Happy New Year! May your trades and risk-management work out very well this year.
________________________________________
Author's Comment: Thank you for reviewing this post and considering its charts and analysis. The author welcomes comments, discussion and debate (respectfully presented) in the comment section. Shared charts are especially helpful to support any opposing or alternative view. This article is intended to present an unbiased, technical view of the security or tradable risk asset discussed.
Please note further that this technical-analysis viewpoint is short-term in nature. This is not a trade recommendation but a technical-analysis overview and commentary with levels to watch for the near term. This technical-analysis viewpoint could change at a moment's notice should price move beyond a level of invalidation. Further, proper risk-management techniques are vital to trading success. And countertrend or mean-reversion trading, e.g., trading a rally in a bear market, is lower probability and is tricky and challenging even for the most experienced traders.
DISCLAIMER: This post contains commentary published solely for educational and informational purposes. This post's content (and any content available through links in this post) and its views do not constitute financial advice or an investment or trading recommendation, and they do not account for readers' personal financial circumstances, or their investing or trading objectives, time frame, and risk tolerance. Readers should perform their own due diligence, and consult a qualified financial adviser or other investment / financial professional before entering any trade, investment or other transaction.

EURAUD Long Opportunity - MARCH RECAP
Been a slow few weeks with very little plays - 1st trade in around 10 days.
Price created a H, retraced towards the EMA and found support, looked like bullish momentum to continue - easy 2.3R.

Sweet Divergence Since the start of January, most leading macro markets have experienced a reversal around their 38.2% Fibonacci retracement levels. However, BTC has shown resilience and fought the cross-asset sell-off. This divergence is likely driven by the fact that there has been over $1 trillion in net liquidity added to the market since the bottom in October, primarily driven by the People's Bank of China and the Bank of Japan, helping to off-set the damage the Fed is doing to risk-on assets such as the crypto market. Considering BTC tends to be somewhat of a liquidity sponge, it tends to outperform other assets when there is a boost in liquidity. However, the jury is still out on whether BTC's performance indicates the end of the bear market for crypto or a temporary outlier. Despite BTC's recent outperformance, it's still catching up to significant rallies in other markets between Q4 2022 and Q1 2023. An important note is that the S&P 500 has never seen a bear market bottom before the unemployment rate began to rise, and this is yet to be the case. Furthermore, the yield curve is currently the most deeply inverted it has been since the 1980s, ultimately signalling that long-term interest rates are lower than short-term interest rates. An inverted yield curve has been a perfect predictor of the last seven recessions since 1960, ultimately implying that it's likely the market isn't out of the woods yet.
When yields and risk assets diverge, historical patterns suggest that other assets quickly catch up to the sell-off. Although yields have moved exponentially since last month's CPI data, markets expect them to stabilize at last year's high levels. It would likely take very hot inflation data and a significant rate hike following the next FOMC meeting on the 22nd of March to trigger the next leg lower for risk assets. Until then, BTC is expected to continue ranging, waiting for its next cue.
In other news, a recent article by Forbes threw Binance into the fire after they released an alleged hit piece on the exchange and its founder, Changpeng Zhao (CZ). The article drew parallels between the exchange and the now-defunct FTX after Binance allegedly transferred $1.8 billion to hedge funds such as Tron, Amber Group and Alameda Research between August and December 2022. However, CZ then hit back at this, arguing that the article referred to some old transactions from Binance's clients. He then reiterated that the exchange always holds user funds 1:1 and that this can be referenced through Binance's proof-of-reserve system.
From a technical perspective, it is clear from the weekly chart that Bitcoin has been trading between two significant demand and supply zones. The bulls will be hoping for a weekly close above the $25,000 supply zone, which would light the way towards the massive $28,800 to $30,000 resistance, the Head and Shoulders neckline. An important contributor to the bullish scenario is that EMA20 and EMA200 are beginning to converge, with a potential cross in the coming weeks. The importance of this should be considered, as EMA20 crossing below EMA200 back in September accurately predicted short-term market direction. Bears will rejoice at the fact that many traders believe that a final Elliot Wave 5 sell-off is to come. This would likely result in a break below the $15,500 - $16,500 November market bottom.
As we advance, all eyes will be on the CPI data releases. U.S. CPI data on the 14th will likely dictate the outcome of the rate decision of the FOMC on the 22nd. Volatility will be high around these dates, so caution should certainly be exercised, especially in leveraged positions.

3 DAYS EMA100/200I have already mentioned that EMA100/200 cross
on a large timeframe is a more stubborn thing than the same MA 50/200.
It's been a very long time since I posted a TOTAL2.
We have 4 crosses in history on this t.f.
1. Golden received in March 2016. The cycle to the next cross lasted 1030 days.
2. Death cross received in January 2019, the cycle to the next cross lasted 554 days.
3. Another golden cross in July 2020. And almost 800 days to the next red point.
4. Death cross received in September 2022. It's just been 152 days.
I have to tell myself something about why all of a sudden
a new golden cross should be received during the spring?
I'll just open a beer for now.

BTC/USDBTC has 21 MEMA (monthly 21 ema) strong resistence.
In 2015 we saw a double bottom after hitting 21 MEMA.
In 2019 after short resistence we saw a pump and a year later a double bottom for retest.
I keep an eye to inflation, unemployment rate and also dry powder for lower levels and black swans.
DCA at lower price level seems to be still a good strategy for accumulation.
The bull market is not confirmed according to charts but clearly the markets are not so bearish right now.
Of course the price will do whatever it wants and it's hard to predict what will happen exactly.

A trifling observation.Is it possible to provide an indication that pre-empts the classic "death cross"?
Traders use different systems to judge the market outlook on patterns, as well as an important indication for them.
It is perfectly normal that someone can be wrong, and someone will be lucky to read the market correctly.
This post is about anticipatory indication and prejudice. If you open the articles on moving averages,
you can read that the exponential Moving averages (EMAs) are preferable on low timeframes up to a minute chart,
but they are not but it's recommended for the weekly chart.
Whereas it is recommended to use SMAs on longer timeframes.
OK, I thought. But why? Who has checked it? A price is a price, in itself it only says that someone has offered an asset
at a certain price, and someone bought at that price. But the market trend requires more confirmation of transactions through volumes.
The price alone cannot tell you what the market has decided. And that is why I made this comparison. MA 50/200 (white and blue line)
versus EMA 50/200 (orange and purple) + VFI LF (volume flow indicator).
Hypothesis:
EMAs are valid for 1 week timeframe, the exponent is not suitable for this timeframe is a preconception.
MA lags in indicating the signal, but you need to know the trend of the volume, for which you need an indicator like VFI LF.
In the case of unidirectional signals EMA 50/200 and VFI LF you can make a deal without waiting for the signal MA 50/200.
Assertion:
Bitcoin is in a bear market and no reversal has occurred.
The bounce at the beginning of the year was intended to test crossed possible area of the weekly SMA moving averages.
But because of death cross on EMAs already on the 9th of January, it also puts selling pressure.
And here the Volume Flow Indication is an important aid.
See, the VFI has two pale lines besides the volume flow line itself,
it's a fast and slow MA of volume (but it's MA of volume, not of price!),
and on these lines you can also see golden and death crosses.
Look closely, in the history of Bitstamp trading (the longest trading history of Bitcoin)
there have been exactly 3 such crosses by volume indication on weekly chart.
Two bearish and one bullish.
The last bearish cross on the MA of volume flow occurred about a month before the cross at EMA 50/200 price.
December 12...
As a result:
Two bearish pre-emptive signals versus one classic "textbook" one.
My bet is that there will not be a upbounce.
There will be an 85% retracement level from the peak and a consolidation at the bottom.
Waiting for a reality check in this race.
My bet is that we are in a bear market.

AAVEUSDT | DECRYPTERS | SHORT Hi welcome to Decrypters
Today we will short AAVE USDT from interest Area
AAVE is in strong down trend and we found similar Distribution patterns and with some other 6-7 confluences we wana short this
LET's Go

Moving Average Free Options MethodSimple to use on the 15 minute to Daily chart. When the Emas cross with green on the top buy calls within $2 strike. When cross with red on the top buy puts within $2 strike. Bottom Mac'd Ema difference should also be same color as top Ema. Green/Green or Red/Red. Any light blue line Ema or Sma can be support or resistance so be prepared to sell. Buy time never buy contracts that expire that day. Greeks will burn you. Support and resistance are the green and red stripes across the chart(also sell or buy points. Ideally enter on the 5 minute chart then switch to the 15 minute or half hour chart to eliminate noise. Happy trading.

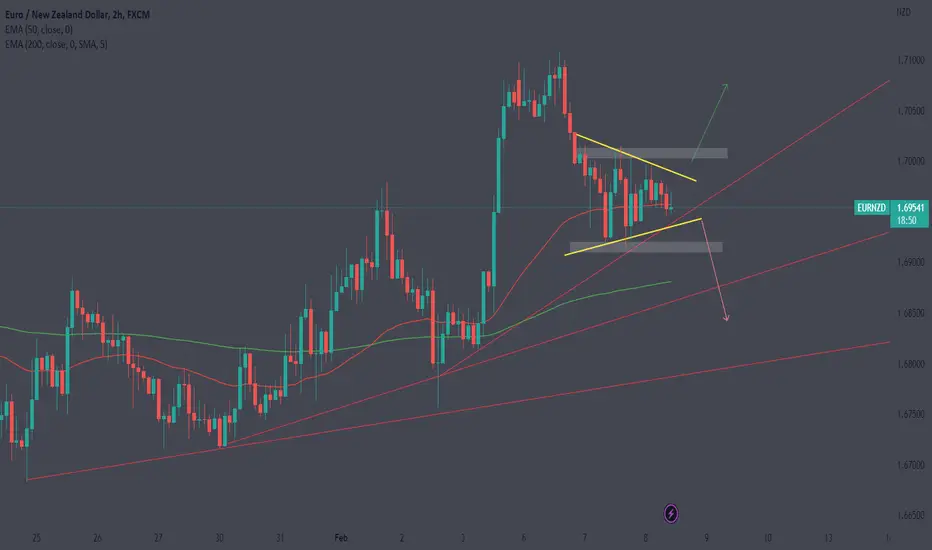
EURNZDEURNZD - A break to either direction
Pennant/ Inverse Cup & Handle / Bear flag - Whatever is on your trade plan...
It's a break above Highs of: 1.70115 It would take you towards 1.70725
A break below the lows of: 1.69170 it would take you towards 1.68560
Ideally wait for the break for further confluence. However, be sure to stick to your own trade plan.
Trade Journal
Todays signals
There are few stocks showing "buy" signals . I'll avoid Adani stocks as the volatility is very high in those counters. I'll go for shorting HeroMotocorp if market shows some weakness. If market is in green then i'll go for stocks showing buy signals.
These signals are generated on Daily data against EMA 200 and Supertrend cross.
