BERGEPAINT at Best Support !!This is the Daily Chart of BERGEPAINT .
BERGEPAINT having good law of polarity at 540-545 range.
EMA is also providing support for the stock around the 545 range.
If this level is sustain the , We may see higher price in BERGEPAINT.
Thank You !!
Emasupport

TATA STEEL at Resistance ZoneThis is Daily Chart of TATA STEEL.
Tata steel having good Law of Polarity at 163-168 range.
If this level is sustain , then We may see lower prices in the stock again.
Tata steel is a good support zone at 125-130 range.
Two EMAs are also supporting the stock, with the first EMA positioned at ₹140 and the second at ₹129.
THANK YOU !!

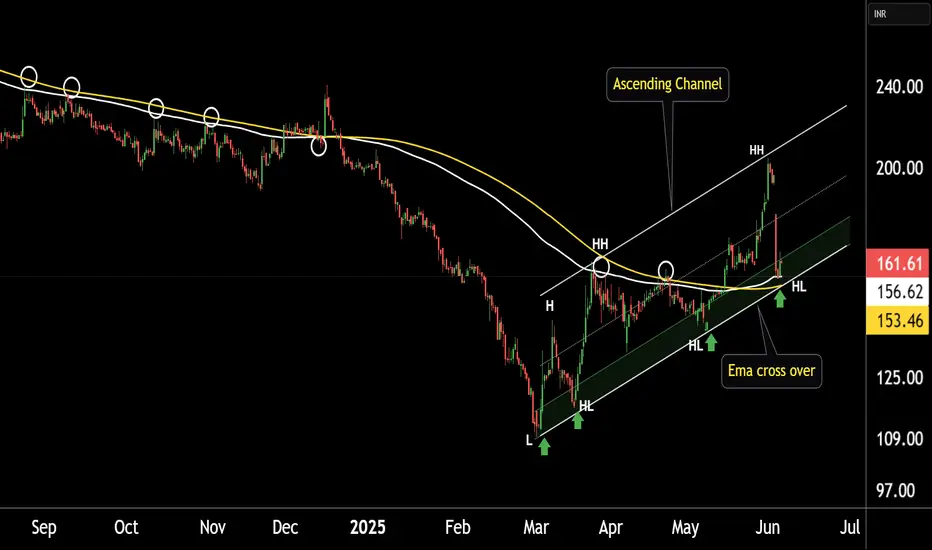
SPARC This is the 4 hour chart of SPARC.
SPARC is currently trading near the support boundary of an ascending channel at 150-155 range.
SPARC has given a positive EMA crossover at price 152-156 range
If this level sustain, we may see higher price in the SPARC.
Thank You !!
ABFRL at Best Support !!This is the Weekly Chart Of ABFRL .
ABFRL having good Law of Polarity at 70 range.
ABFRL having EMA support at 72 range
If this level is sustain , we may see higher price in ABFRL ||
Based on time-wise analysis, our initial expected return is 40–42%, which the stock consistently forms beyond the Law of Polarity (LOP).
Thank You !!

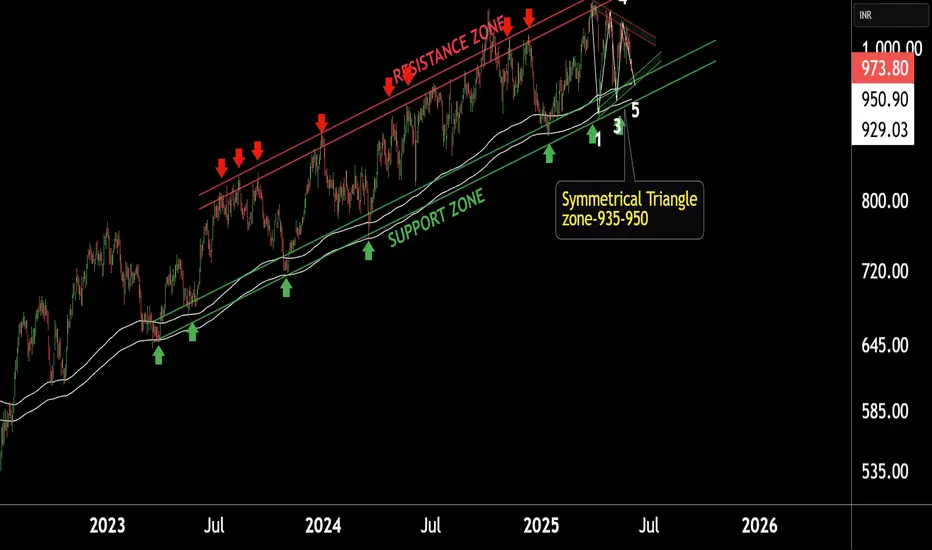
JSW Steel is near its Support LevelThis is Daily chart of JSWSTEEL.
The stock is trading within an Ascending Channel.
It is currently near the lower support zone of the channel, which lies in the ₹920–₹945 range.
Simultaneously, a Symmetrical Triangle pattern is forming with a consolidation range between ₹930–₹950.
The stock is currently taking dynamic support from two EMAs: the first EMA is providing support near ₹245, while the second EMA is acting as a deeper support around ₹230. Both EMAs are helping maintain the stock’s bullish structure."
If this level is sustain , we may see higher prices in the stock.
Bitcoin/USDT 1-Hour Outlook: Consolidation Near 200 EMA at 86k.As traders awaiting for breakout
1. **Trend & EMA (200):**
- The **200-period EMA** (Exponential Moving Average) is plotted, acting as dynamic support/resistance.
- Price hovering near the EMA suggests a potential inflection point. A sustained break above could signal bullish momentum, while a drop below may indicate bearish pressure.
2. **Key Levels:**
- **Immediate Resistance:** 86,000 USDT (current price level).
- **Support Levels:** 84,000 → 82,000 → 80,000 USDT.
- A close below 84,000 could trigger further downside toward 82k or 80k. Conversely, holding above 86k might target new highs.
4. **Actionable Insights:**
- **Bullish Scenario:** Hold long positions if price sustains above 86k, targeting 88k–90k.
- **Bearish Scenario:** A break below 84k could signal short opportunities toward 82k.
- Use tight stop-losses (e.g., below 84k for longs) due to the tight consolidation range.

SCHAEFFLER Swing Trade, Price is taking support from 50 EMASCHAEFFLER is taking support from 50 EMA in Weekly Chart. (For Swing Trade)
We can go for long swing trade only after price going above 3530 with approx. 6% stoploss and 24% Target.
Risk-Reward = 1:4
Plan your quantity/investment accordingly.
Note : Its just an analysis, wait for the price to confirm.
Disclaimer : Always follow risk to reward, this is the only key to success in market, no matter how much good a trade is looking we never know the future.

TARC | SWING | LONGCreating a nice base near highs
Volume contraction
Negative:
EMA's Flatting which means the price is lacks momentum
Caution:
Overall market conditions are highly volatile which can impact the trade idea

Potential Bullish Trend for Stacks (STX/USDT)#STX/USDT #Analysis
Description
---------------------------------------------------------------
+ The chart shows a strong ascending trendline acting as support, originating from the low in mid-2022. This trendline has been respected multiple times, indicating its significance.+
+ The price has broken above the previous resistance zone around $1.90, now acting as a support level.
+ The next major resistance zone is between $3.80 and $4.50, which was previously a strong support zone before the price breakdown in mid-2021.
+ The EMA 100 (blue line) is currently acting as dynamic support, aligning with the ascending trendline and providing additional support to the bullish case.
+ If the price holds above the ascending trendline and the $1.90 support zone, we can expect a retest of the $3.80 - $4.50 resistance zone.
+ A successful breakout above this resistance could see the price targeting the next psychological level around $6.00 and potentially higher to $7.50
+ The RSI is currently at 46.92, which is neutral but showing signs of potential reversal from the oversold region. If the RSI moves above 50, it would support the bullish momentum.
---------------------------------------------------------------
VectorAlgo Trade Details
------------------------------
Entry Price: $1.587
Stop Loss: around $1.20
------------------------------
Target 1: 2.660
Target 2: 4.050
Target 3: 6.00
Target 4: 7.5
------------------------------
Timeframe: 1W
Capital Risk: 1-2% of trading amount
Leverage: 5-10x
---------------------------------------------------------------
Enhance, Trade, Grow
---------------------------------------------------------------
Feel free to share your thoughts and insights.
Don't forget to like and follow us for more trading ideas and discussions.
Best Regards,
VectorAlgo

Dont Bet Against Tesla while Bullish Strength ExistsHi guys. This is a Technical Analysis on Tesla (TSLA) on the 3 Day chart.
BRUH.......I was aspecting prices to be around the FIB retracement levels i pointed out in my previous ideas (200-220 range) a little longer. Though its still possible we can retrace back down from this current area. BUT Some bullish signs exist, therefore in my opinion we are Bullish until Proven Otherwise.
Jumping in, our current move is fueled by our Major bounce from a Critical Confluence of Supports.
We have the RED ZONE
We have the Black trendline
We have the 50 SMA
We are also ABOVE the 21 EMA, which when support is Confirmed it indicated UPTRENDS. As long as we respect the 21 EMA and stay above it.
Volume is picking up as well. WHich is also indicative of the current move. To break ABOVE resistance lines, we need to continue to see VOLUME increase.
MACD is also showing signs of waning Bearish Momentum, with Light Red histobar prints and flattening of the Blue line.
We need to avoid printing a Dark Red Bar. Instead see print of Green bars with a Bullish Cross.
RSI is also getting close to testing the Black moving average i have added. The way i use this is: Usually if RSI is ABOVE the Moving AVerage, it signifies UPtrends.
But do note: This current candle closes on the 8th of September.
And note that we are hitting some Major Resistance Area. There is always a risk of sell off. BUt as long as we continue the current trends in volume, stay above the moving averages, and maintain patterns in indicators Uptrend will continue.
__________________________________________________________________________________
Thank you for taking the time to read my analysis. Hope it helped keep you informed. Please do support my ideas by boosting, following me and commenting. Thanks again.
Stay tuned for more updates on TSLA in the near future.
If you have any questions, do reach out. Thank you again.
DISCLAIMER: This is not financial advice, i am not a financial advisor. The thoughts expressed in the posts are my opinion and for educational purposes. Do not use my ideas for the basis of your trading strategy, make sure to work out your own strategy and when trading always spend majority of your time on risk management strategy.

GPIL Bullish looking in 3 HTF!#The Pattern is a simple Support and Resistance
Points to Look:
1.The Channel Pattern is slanted downwards, this pattern has a high success rate!
2.Inside the pattern the recent trend is Bullish (Bullish Candle)
3.There is 'W' shape recovery(21 July 2022 to Now) in the trend which is also a good bullish sign.
4.There is a chance of CONSOLIDATION and tern break-out! be patient, also given the approx. Entry Prize in the chart.
5.Despite all this wait for a confirmation bullish candle above 20EMA in 1 DTF tomorrow and then take the position.
$Happy Trading Mates$

🧐🧐SEE THIS BEFORE SELLING BITCOIN🤯🤯Hi Trading view Family, Theres lot of noise on social media regarding selling bitcoin, But we should see this scenario before selling bitcoin.On dailt TF we can see a trendline with fib retracement, And till now it is retraceing 0.382 level with 20 EMA support. Along that we also can have testing of 0.5,0.618 level on fibonacci retracement. And high chance is that it can take support from one of these 3 levels and continues its uptrend. So take actions carefully
Date of Analysis:-16 November 2021

CRYPTOCURRENCY BITCOIN (BTCUSDT) SMALL PULLBACK BITCOIN ( BTCUSDT ) 30 minutes timeframe -> Inverted Head and Shoulder. A strong buying level when market is consolidating/downtrend.
This indicates after long bearish trends, the price falls to a trough and subsequently rises to form a peak.
It has taken support also from 20 EMA and a good green candle ready to make a breakout. RSI also supports it.
It can do a retest on 20 EMA and then go towards the target.
Only take entry when 15 min candle closes above 43219.
First target - 44038. Book profits there or trail your stop loss for 2nd target 44500. Stop loss should be 42672.

DXY : Critical MomentDXY touched a critical support trendline formed from the Feb 2018 and Jan 2021 lows,
and is now hovering just above that line.
Also, at the end of Mar 2021, DXY was rejected at the 300 EMA,
which was previously a significant support :
Now DXY is in a tight spot between the descending 300 EMA and the critical support trendline.
I think that the next few days will be critical,
so I will be keeping an eye on this.
// Durbtrade

Bearish on AAPLWeekly AAPL. Purple line is EMA(220W) i actually use it as EMA(55) on every time period but i dont wanted to publish this on a monthly graph so i multiplied it by 4. In the long run EMA(55M) is a pretty damn strong support and the december 2018 bottom was a simple bottom but right now we're seeing a double top formation and 2 bearish candlestick patterns in that red circle (shooting star and hanging man). So it would be a smart move to sell or short AAPL with a stop-loss buy order little above the All time high.

ZYXI = 30% Profit opportunityZYXI is strong at closing today. Trading in tight channel in since last week. As I mentioned in chart there is a 200 EMA solid support. Buy 1st position here and Add more position on breakout. Set SL according to your appetite.
What do you think about this idea?
Feel free to ask any questions regarding this idea. Like and comment on this idea for encouragement.
Thank You!


Emas Berpotensi Melanjutkan Koreksi Perdagangan emas ditutup melemah di harga $ 1349.17/oz pada Sabtu dini hari, ditekan menguatnya Dollar AS setelah pernyataan presiden Donald Trump di Davos yang menginginkan Dollar menguat. Secara teknikal area support kuat pertama yang bisa menahan laju koreksi emas berada di area $ 1344 dan $ 1340, Meskipun Dollar AS sempat menguat tapi tetap belum merubah trend penurunannya, dengan demikian secara teknikal emas berpotensi rebound dan melanjutkan trend bullish dan akan kembali mencoba menembus harga tertingginya kembali, perhatian fundamental masih besar mengarah pada tahun baru imlek dimana biasa terjadi peningkatan untuk harga emas, fundamental yang melemahkan datang dari Dollar AS dengan kebijakan proteksi dari pemerintah AS, ditambah kemungkinan The Fed untuk menaikan tingkat suku bunga pada quartal awal tahun ini, jika hal tersebut terjadi besar kemungkinan emas tidak akan melanjutkan rally panjangnya dan berubah arah trend.

MITK Long: Bat Complete at 100 Day EMA SupportMITK has completed a bullish bat in a with a PRZ that is confluent with support from the 100 day exponential moving average. To add to bullish bias, 2 missed weekly pivots sit above price. Entry is placed at the bottom of the PRZ with target at the missed weekly pivot from 12/14.
Confluence in the PRZ:
Bullish bat
2AB=CD
2.272BC Projection
EMA100 Support
Bullish MACD Divergence
S/R Zone
Missed weekly pivots above price

Long AUDUSD: 2 Cyphers + Crab + TCT + EMA/SMA Support + PivotsAUDUSD is nearing the PRZ of 3 harmonic patterns presenting us with an opportunity to trade in the direction of the trend. The base of the PRZ coincides precisely with last week's missed pivot in addition to a fib cluster from a series of structure lows to structure highs. The 500 bar SMA and EMA lines may provide added support around the reversal zone. To add to bullish bias, the new weekly pivot will be printed near the .618CD retracement and may help to pull price up toward target. Entry is placed at the base of the PRZ with target at .618CD and SL below structure lows. This trade yields a risk to reward ratio of 2.
Confluence in the PRZ:
2 Bullish Cypher Patterns
Bullish Crab Pattern
500SMA Support
500EMA Support
Underlying Bullish Trend
New weekly pivot above price
Entry confluent with missed weekly pivot
S/R Zone
Fib cluster centered in PRZ
If this long position is successful, the next level I will be focusing on is .74:
