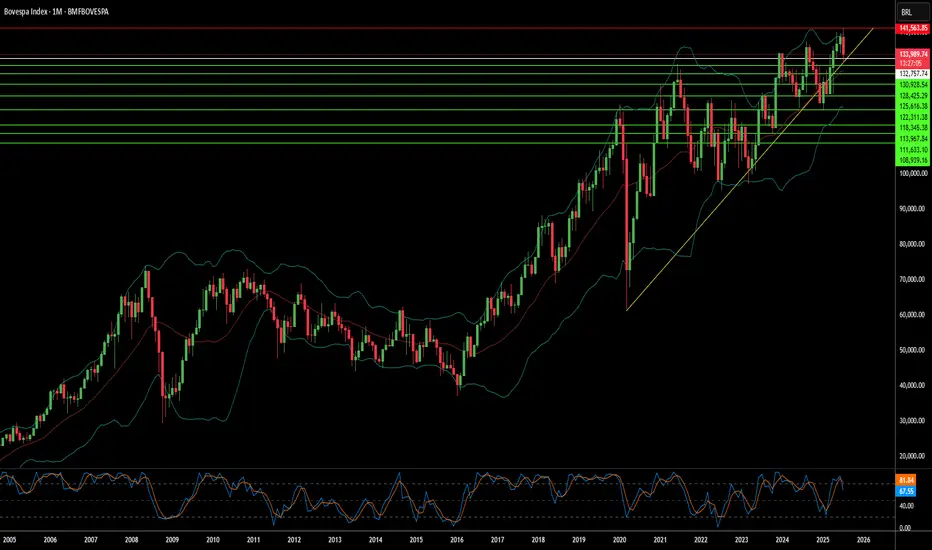
Has Geopolitics Clouded Brazil's Market Horizon?The Bovespa Index, Brazil's benchmark stock market index, faces significant headwinds from an unexpected source: escalating geopolitical tensions with the United States. Recent decisions by the US administration to impose a steep 50% tariff on most Brazilian imports, citing the ongoing prosecution of former President Jair Bolsonaro, have introduced considerable uncertainty. This move, framed by the US as a response to perceived "human rights abuses" and an undermining of the rule of law in Brazil's judiciary, marks a departure from conventional trade disputes, intertwining economic policy with internal political affairs. Brazilian President Luiz Inácio Lula da Silva has firmly rejected this interference, asserting Brazil's sovereignty and its willingness to negotiate trade, but not judicial independence.
The economic repercussions of these tariffs are multifaceted. While key sectors like civil aircraft, energy, orange juice, and refined copper have secured exemptions, critical exports such as beef and coffee face the full 50% duty. Brazilian meatpackers anticipate losses exceeding $1 billion, and coffee exporters foresee significant impacts. Goldman Sachs estimates an effective tariff rate of around 30.8% on total Brazilian shipments to the US. Beyond direct trade, the dispute dampens investor confidence, particularly given the US's existing trade surplus with Brazil. The threat of Brazilian retaliation looms, potentially exacerbating economic instability and further impacting the Bovespa.
The dispute extends into the technological and high-tech realms, adding another layer of complexity. US sanctions against Brazilian Supreme Court Justice Alexandre de Moraes, who oversees Bolsonaro's trial, directly link to his judicial orders against social media companies like X and Rumble for alleged disinformation. This raises concerns about digital policy and free speech, with some analysts arguing that regulating major US tech companies constitutes a trade issue given their economic significance. Furthermore, while the aerospace industry (Embraer) received an exemption, the broader impact on high-tech sectors and intellectual property concerns, previously highlighted by the USTR regarding Brazilian patent protection, contribute to a cautious investment environment. These intertwined geopolitical, economic, and technological factors collectively contribute to a volatile outlook for the Bovespa Index.
Emergingmarkets
Is Mexico's Peso at the Crossroads?The recent imposition of U.S. sanctions on three Mexican financial institutions - CIBanco, Intercam Banco, and Vector Casa de Bolsa - has ignited a crucial debate over the Mexican peso's stability and the intricate dynamics of U.S.-Mexico relations. Washington accuses these entities of laundering millions for drug cartels and facilitating fentanyl precursor payments, marking the first actions under new anti-fentanyl legislation. While these institutions collectively hold a relatively small portion of Mexico's total banking assets (less than 3%), the move carries significant symbolic weight and prompts a re-evaluation of the peso's outlook. The Mexican government, under President Claudia Sheinbaum, swiftly rejected the allegations, demanding concrete evidence and initiating its investigations, including the temporary regulatory intervention of CIBanco and Intercam to safeguard depositors.
Economically, the peso faces a nuanced landscape. Before the sanctions, the Mexican peso (MXN) demonstrated remarkable resilience, appreciating significantly against the dollar, bolstered by Mexico's comparatively higher interest rates and robust trade flows with the U.S. However, the recent divergence in monetary policy, with **Banxico** easing rates while the U.S. Federal Reserve maintains a hawkish stance, now presents a potential headwind for the peso. While analysts generally suggest limited systemic risk to Mexico's broader financial system from these targeted sanctions, the action introduces an element of uncertainty. It raises concerns about potential capital flight, increased compliance costs for other Mexican financial institutions, and a possible erosion of investor confidence, factors that could exert downward pressure on the peso.
Geopolitically, these sanctions underscore the escalating U.S. campaign against fentanyl trafficking, now intricately linked with broader trade and security tensions. President Donald Trump's past threats of punitive tariffs on Mexican imports - aimed at curbing drug flows - highlight the volatile nature of this bilateral relationship. The sanctions serve as a potent political message from Washington, signaling its resolve to combat the fentanyl crisis on all fronts, including financial pipelines. This diplomatic friction, coupled with the ongoing complexities of migration and security cooperation, creates a challenging backdrop for the USD/MXN exchange rate. While the U.S. and Mexico maintain a strong intergovernmental relationship, these pressures test the limits of their collaboration and could influence the peso's trajectory in the medium term.

$DXY weakness and EM markets: $NIFTY more upside? The recent weakness in TVC:DXY is well documented. We have analyzed it here in detail in our blogs. This weakness is giving wings to all kinds of risk assets including Ems. One of our favorite EM in this space has been India and NSE:NIFTY index for quiet some time. It is the only EM which is close to beating S&P 500 over the last 5-year period. We have been recently bullish at NSE:NIFTY and published new targets on June 6. Please check the post in the link here.
NSE:NIFTY : New highs incoming; 27500 can be cycle highs for NSE:NIFTY by RabishankarBiswal — TradingView
The road to the medium-term target of 27500 on NSE:NIFTY has to do with the weakness of $DXY. As we see, lower lows and lower highs in the Dollar index TVC:DXY provides the required boost to risky assets like Stocks, Crypto and EMs. Even if we have some recent choppiness in the market the upward momentum will continue. By the end of July, we might see TVC:DXY at 96 up 2.5% and NSE:NIFTY @ 26000 up 5%.
Verdict : Pair Trade : Short TVC:DXY to 96 and Long NSE:NIFTY to 26000.

Nu Holdings: Is Latin America's Fintech Star Sustainable?Nu Holdings Ltd. stands as a prominent neobank, revolutionizing financial services across Latin America. The company leverages the region's accelerating smartphone adoption and burgeoning digital payment trends, offering a comprehensive suite of services from checking accounts to insurance. Nu's impressive trajectory includes acquiring 118.6 million customers, accumulating $54 billion in assets, and consistently demonstrating robust revenue and net income growth, primarily driven by its strong presence in Brazil, Mexico, and Colombia; - this strategic alignment with digital transformation positions Nu as a significant player in the evolving financial landscape.
Despite its remarkable expansion and optimistic projections for continued customer and asset growth, Nu faces notable financial headwinds. The company experiences an erosion in its net interest margin (NIM), influenced by increased funding costs from attracting new, high-quality customers and a strategic shift towards lower-yield, secured lending products. Furthermore, the depreciation of the Brazilian Real and Mexican Peso against the US dollar impacts their reported earnings. Nu's ambitious ventures, such as the NuCel mobile phone service, require substantial capital investments, introducing execution risks and demanding efficient capital allocation.
Beyond internal financial dynamics, a significant, albeit external, geopolitical risk looms: a potential Chinese invasion of Taiwan. This event would trigger a global embargo on China, leading to unprecedented supply chain disruptions, widespread stagflation, and hyperinflation worldwide. Such a catastrophic economic cascade would profoundly impact Nu Holdings, even given its regional focus. It would likely result in drastically reduced consumer spending, a surge in loan defaults, severe challenges in accessing funding, further currency devaluations, and soaring operational costs, thereby threatening the company's stability and growth prospects.
Ultimately, Nu Holdings presents a compelling growth narrative rooted in its innovative model and strong market penetration. However, internal pressures from evolving interest margins and high capital expenditure, combined with the low-probability but high-impact global economic upheaval stemming from geopolitical tensions, necessitate a cautious and comprehensive assessment. Investors must weigh Nu's demonstrated success against these complex, intertwined risks, acknowledging that its future prosperity is inextricably linked to both regional economic stability and the broader global geopolitical climate.

Taiwan Dollar Weakens Past 30 per USD Amid Trade Rumors and CentThe Taiwanese dollar weakened past 30 per USD on Tuesday, reversing a two-day rally and retreating from its strongest level in nearly three years.
📉 Recent gains in Asian currencies like the TWD and MYR were fueled by speculation over regional support for U.S. trade talks. However, Taiwan’s central bank denied any such coordination, stating the U.S. made no formal request. President Lai Ching-te also warned against spreading misinformation.
🔧 As a key player in global chip production, Taiwan remains highly exposed to shifts in trade dynamics and geopolitical risks.

Non-US ETFs outperform during trade warNon-US markets are showing resilience during this year's remarkable volatility.
While NASDAQ:QQQ and AMEX:SPY are down more than 10%, AMEX:VEA (non-U.S. Developed Markets ETF) is up nearly 5%...
AMEX:IEMG (tracking Emerging Markets) is negative so far, but less severe than others. Will Trump's volatile trade war lead to further outflow from the U.S. financial system?
Meanwhile, gold has been rallying to record highs as the world seeks an alternative to the dollar.

UPDATE I was wrong with USD/ZAR - Now it's undecidedWith trading it's not about certainties but probabilities.
And in this case I was soo optimistic about the rand breaking its Inverse Cup and Handle and heading to R16.50.
But instead the USD/ZAR rallied to R19.74.
Apart from the negativity kicking in with the US, there is one thing I didn't really consider. And that is the US Dollar is going to hurt - no doubt.
But the rand and emerging economies will more likely hurt even worse. Because despite it all we still follow the big boys (DOw, SP500, UK100)
Hence when the US sneezes, the world catches a cold.
But then we have other reasons for the rand weakening
1. 🗳️ Political Uncertainty in SA
Coalition tensions and governance concerns are making investors nervous, pushing money out of SA.
2. 📉 Lower SARB Interest Rates
South Africa cut rates again, making the rand less attractive to yield-seeking investors.
3. 🌍 Global Risk-Off Mode
Traders are fleeing emerging markets amid global tensions—hurting the rand, boosting the dollar.
4. 💼 Weak SA Economic Outlook
Low growth, high unemployment, and power issues reduce confidence in South Africa’s economy.
5. 🇺🇸 Stronger Dollar Demand
U.S. dollar gaining strength globally due to safe-haven demand and higher relative rates
So, yes - We are seeing some rand strength now and we are back to R18.88.
We will need to wait for the next formation before we make any deductions on where it is likely to go.
It could break up with the Falling Flag and run up to R20.00.
Or it could stabilise and form an Inverse Cup and Handle again and drop to R17.50.
We need to wait and see. I can't always post my winners - or else I wouldn't be an actual trader.
Disclosure: I am part of Trade Nation's Influencer program and receive a monthly fee for using their TradingView charts in my analysis.

HAL NV: Unlocking Hidden Value in a Discounted InvestmentCurrent Price: Approximately €117.40 per share
Target Price: €150 per share
HAL NV (traded via HAL Trust) has long been recognized as a unique investment vehicle, thanks to its diversified portfolio of high-quality assets. Despite a current trading level around €117.40, a closer look at the underlying holdings and operational performance reveals a significant value gap—one that suggests the stock should be priced nearer to €150.
Key Holdings and Their Strengths
Boskalis – A Fully Owned Flagship
• 100% Ownership: HAL NV owns Boskalis outright, giving it full exposure to the maritime and offshore construction market.
• Robust Order Books: Boskalis benefits from a full order book, which not only secures future revenues but also demonstrates strong market positioning.
• Operational Efficiency: With steady execution in its core business, Boskalis adds both resilience and growth potential to HAL’s overall portfolio.
SBM Offshore – Secure Order Pipeline
• Substantial Stake (22.9%): While not fully owned, SBM Offshore represents a key component in HAL’s strategy.
• Solid Order Books: Like Boskalis, SBM Offshore’s strong order backlog underscores its ability to generate future cash flow.
• Strategic Exposure: The offshore energy market, driven by both traditional and renewable energy projects, positions SBM Offshore for long-term growth.
Vopak – Consistent Performer with Upward Trends
• Major Stake (51.4%): HAL’s significant interest in Vopak captures exposure to the global tank storage and logistics sector.
• Earnings Fluctuation, But Upward Trend: Although Vopak’s earnings can fluctuate year over year, the overall trend has been strongly positive, reinforcing its role as a reliable income generator.
Additional Growth Catalysts
• Coolblue (56.4%) & TKH Group (5.2%): These holdings further diversify HAL’s portfolio, offering exposure to high-growth sectors such as retail technology and industrial services.
The Valuation Gap: NAV vs. Market Price
One of the most compelling aspects of HAL NV is the notable discrepancy between its Net Asset Value (NAV) and its market capitalization:
NAV Insight: Recent reports and annual filings suggest that the NAV per share of HAL’s underlying assets is approximately €165.95.
Market Discount: Trading at around €117.40, HAL NV is effectively offered at a significant discount. This “hidden value” implies that the market has yet to fully recognize the aggregate worth of its high-quality investments.
Equity vs. Market Cap: With the equity value of its portfolio (including fully consolidated companies like Boskalis and the robust valuations from quoted holdings such as Vopak and SBM Offshore) substantially higher than the current market cap, the potential for upward re-rating is evident.
Hal NV is poised for robust long‐term growth, with annual rates expected to reach around 15%. This optimism is driven by strong demand for the services of Boskalis and SBM Offshore, both of which continue to benefit from substantial order books. Additionally, the accelerated growth of Coolblue and the steady, consistent performance of Vopak—bolstered by emerging opportunities in India—further enhance the outlook. Coupled with a conservative balance sheet that ensures a low cost of capital, these factors collectively support the company’s promising growth trajectory.
Catalysts for Price Convergence
Several factors support the rationale for a price target of €150:
Strong Order Books: Both Boskalis and SBM Offshore are backed by extensive order books, which not only secure future revenue streams but also reduce operational risks.
Consistent Growth Trends: Vopak, despite some earnings volatility, has demonstrated a significant long-term upward trend in earnings—enhancing the overall stability of HAL’s portfolio.
Undervalued Underlying Assets: The current market price does not fully reflect the NAV derived from HAL’s diverse investments. As market sentiment improves and the intrinsic value becomes more widely recognized, a re-rating toward the NAV is likely.
Favorable Valuation Metrics: HAL NV’s relatively low Price/Earnings ratio compared to its growth prospects and asset quality makes it an attractive buy for value-oriented investors.
Conclusion
HAL NV represents an intriguing investment opportunity—a trust whose market price currently undervalues a robust portfolio of operationally strong and strategically significant companies. With full control over Boskalis and solid stakes in SBM Offshore and Vopak, combined with additional growth prospects from Coolblue and TKH Group, the underlying equity far exceeds the current market valuation. In essence, if the market were to recognize the full value of these assets, a price target of €150 per share appears not only justified but highly attainable.
Investors looking for a value play in the industrial and investment holding space should keep a close eye on HAL NV, as the convergence of market price to NAV could deliver significant upside potential.
Note: The analysis above is based on current market data (price ≈ €117.40) and recent annual reports, and reflects the author’s view on the intrinsic value of HAL NV. Investors should perform their own due diligence before making any investment decisions.

Emerging Markets Are Breaking Higher; Be Aware Of Lower USDollarEmerging markets, represented by the EEM chart, have been trending lower since October 2024 in what appears to be a complex W-X-Y corrective pattern. Meanwhile, the US Dollar Index (DXY) experienced a strong rally, driven by Trump’s victory in the US elections. However, the rally formed a wedge pattern, which suggests that its upside momentum may be coming to an end.
Why is the correlation between EEM and DXY important? If the Trump administration pushes oil prices lower, inflation expectations could also decline. This would likely lead to lower interest rates, which in turn could weigh on the USD. In such a scenario, capital may flow out of the US and into emerging markets.
Now that EEM is recovering and breaking above a key channel resistance, it signals that bullish momentum is returning. If this trend continues on EEM to 2024 highs, then DXY could decline to the 105–103 range—or possibly even as low as 100.

Emerging Markets will see a large rally, as part of the 1-5 waveCurrently, the Emerging Markets ETF AMEX:EEM has finished the wave 2 retracement to the 0.382 fib-level.
I'm expecting a multi-year long wave 3 that will propel AMEX:EEM out of the bull flag.
.382 bounce and a breach of the .236 level

Narrowing deviations ---> increasing expectancy (close @10.000)
Navigating around white lines: bad idea to think about bearish market
Slowing pace of weekly gains: good idea to support bullish outlook
Approaching bullish market: expected before Q4
Strengthening alpha coefficient: 15.000 in ramge

Emerging markets looking weakAMEX:EEM has broken Supp + trendline mainly fueled by China's downturn and Brazil.

USDZAR 1Q2025 outlookThe rand has been on the ropes since mid-December after it failed to pull the pair below the 50-day MA support. Since then the broad-based dollar strength has seen the rand give away all its post-election gains.
Fundamentally there I only see two factors which are supportive for the rand as we head into 2025. The first is a strong SA trade surplus of R34.7 billion for November 2024 and the second is the SARB’s continued hawkish stance. The dollar has punished both developed and developing market currencies whose central banks opted to front run the Fed with their respective rate cuts last year and the SARB’s hawkish stance has limited the rand’s losses in 2024. Apart from these two factors, the overall risk-off sentiment stemming from the volatility in the US and other bond markets coupled with the fleeting post-election SA election optimism does not bode well for the rand.
Technically, we have completed a five wave impulse for the pair which pushed the pair to a high of just shy of the psychological handle of 19.00. I believe we should see an ABC corrective pattern play out and a re-test of the levels around 18.40 and 18.50. A failed break below this support range will be the first sign for the predicted move higher towards the 2024 high of 19.35. A break below the 50-day MA will however invalidate the idea and allow the rand to re-test levels below the 18.00 handle.
The 50- and 200-day MAs are currently sitting at 18.15 and we are seeing the infamous “golden cross” taking shape which is rand negative. Over the very short-term, the bearish divergence on the RSI could allow the rand to strengthen with today’s US non-farm payroll volatility. The USDZAR and the DXY both look overstretched and this week’s attempted move higher for the USDZAR does have the characteristics of a bull trap.

Not enough lows amid friction dense marketsRate of return is still bullish but rate of friction is bearish. This lead to stronger bearish market to normalize returns.

Is Saudi Arabia the next new Dubai? As we go into 2025...
Have you ever thought about Saudi Arabia? If not, you are now!
Is it going to be the next new Dubai - Time will tell.
We have Trump Tower built and many other hard assets increasing within Saudi and investors seem to extending further. The growth of Saudi not only commodities advantage they hold, but the other relation matters.
That's the fact jack - Residential real estate prices and rents continue to soar in Saudi Arabia. The cities of Riyadh and Jeddah saw year-on-year sales prices jump by 10% and 5%, respectively, in the first half of 2024, according to property consultancy company JLL's KSA Market Dynamics Report H1 2024.
I'd personally be a dip buyer if we break out of this wedge and decline further for a medium term. If we are to break higher out of wedge there's great target areas.
I could go on further to discuss macroeconomic factors, see further on my Substack about 2025 outlook - Saudi Arabia, other EM countries and much more!
All the best for 2025 - Let's make it rain!
Trade Journal | Empowering Your Trading Journey

Can Political Tremors Rewrite Global Financial Markets?In the intricate dance of global finance, South Korea's recent political upheaval serves as a compelling microcosm of how geopolitical dynamics can instantaneously transform economic landscapes. The Kospi Index's dramatic 2% plunge following President Yoon Suk-yeol's fleeting martial law declaration reveals a profound truth: financial markets are not merely numerical abstractions, but living, breathing ecosystems acutely sensitive to political breath.
Beyond the immediate market turbulence lies a deeper narrative of institutional resilience and adaptive governance. The swift parliamentary intervention, coupled with the Bank of Korea's strategic liquidity injections, demonstrates a remarkable capacity to pivot and stabilize in moments of potential systemic risk. This episode transcends South Korea's borders, offering global investors a masterclass in crisis management and the delicate art of maintaining economic equilibrium amid political uncertainty.
The broader implications are both provocative and instructive. As heavyweight corporations like Samsung Electronics and Hyundai Motors experienced significant share price fluctuations, the event underscores an increasingly interconnected global financial system where local political tremors can rapidly cascade into international market movements. For forward-thinking investors and policymakers, this moment represents more than a crisis—it's an invitation to reimagine risk, resilience, and the complex interdependencies that define our modern economic reality.

Can the Brazilian Real Survive its Perfect Economic Storm?In the intricate world of global finance, few narratives are as compelling as Brazil's current economic crucible. The Brazilian real stands at a precipice, buffeted by a confluence of domestic policy missteps and international economic pressures that challenge the very foundations of its monetary stability. President Lula's administration finds itself wrestling with a complex challenge: balancing ambitious social spending with the cold, hard realities of fiscal discipline.
The currency's dramatic decline—losing nearly 20% of its value in recent months—represents more than a mere statistical fluctuation. It is a profound referendum on investor confidence, reflecting deep-seated concerns about Brazil's economic management. The potential depreciation to 7 reals per dollar looms like a specter, threatening to unleash inflationary pressures that could destabilize the entire economic ecosystem, from local markets to international trade relationships.
What emerges is a high-stakes economic drama with global implications. The Brazilian real's struggle is not just a national issue, but a microcosm of the broader challenges facing emerging economies in an increasingly unpredictable global financial landscape. As central bank governors, international investors, and policymakers watch with bated breath, Brazil stands at a critical juncture—its choices will not only determine its economic trajectory but potentially reshape perceptions of emerging market resilience in the face of unprecedented economic volatility.

FXI - Wave 5 can push price to 40+A Wave 4 50% indicated price would drop to 31.10. Filled at 31.05. Wave 5 should push prices above Wave 3. While I will take some profits around the $40 level, as I did when price hit $33, my initial target, China will be a force going forward so I will maintain a long-term stock position. Thus far, this has been an exceptional trade after initially highlighting the double bottom at the 22 level.

What If Smart Money Shifts from Traditional Companies to Crypto?This idea explores the potential scenario where smart money moves from traditional top 100 Nasdaq companies to the crypto space. As Nasdaq reaches its peak and becomes less attractive, blockchain companies offer more reasonable valuations, and the crypto market continues to open up, providing new opportunities. This shift could drive substantial growth in the blockchain and crypto sectors as traditional finance investors look for higher returns in emerging technologies.

Potential long on Brazil $EWZ ETFIs it time to become a Brazil bull?
+ AMEX:EWZ iShares ETF down nearly 70% from ATH
+ Pays an indicated 7% dividend
+ Milei's success in Argentina hopefully ignites a free market renaissance across LatAm

USDMXN: Short Term BuyEntry: 19.4600
Stop Loss: 19.3000 (160 pips below entry)
Take Profit: 19.7000 (240 pips above entry, offering a 1.5:1 reward-to-risk ratio)
Reasoning: The Mexican peso has been showing signs of weakening, while the U.S. dollar has been gaining strength. This trend suggests that USD/MXN could continue its upward movement, providing a potential buying opportunity.

BIDU Daily Falling WedgeIn a very long falling consolidation with upside price targets of: 95, 97, 99 once the wedge breaks out. May require a fed easing policy to help out China.

Argentina and India outperform across emerging marketsAmong emerging markets, Argentina and India have been booming.
Whereas countries like South Africa and Brazil have been stagnating (as measured by global ETFs).
