South Africa (EZA) a good Precious Metals playPrecious metals (PM) have really struggled this week, with the following weekly movement in USD:
Gold TVC:GOLD -5.65%
Silver TVC:SILVER -7.17%
Platinum TVC:PLATINUM -7.2%
Palladium TVC:PALLADIUM -8.23%
All these PM’s seems to be heavily oversold over the shorter-term, which could see a bit of a recovery over the next week or two. Why is this important? Currently 24% of EZA consists of PM’s, which was the main reason for the recent pullback in the ETF. EZA finds itself at a strong support level and very close to EXTREME OVERSOLD levels according to its 14-day RSI. Should $48.50 not hold up, my stop loss would be at the 200-day Moving Average (EMA). This currently is $46.86. Should we see a bounce off the current levels, could see EZA test the 50-day EMA at 51.29 resistance, with a break and close above these levels, most probably bringing back new 12-month highs. I am somewhat worried about the negative recent momentum and will monitor closely
Emergingmarkets

Chainlink EMA Ribbon flips bullishHey Friends,
Chainlink has been seeing great gains, and the volume really followed through in the crypto crash last week.
We can see the EMA ribbon has now flipped with price above the ribbon, and as usual we should see a test of support around the $30 price range before we attempt to locate our new resistance level.
Personally I am in LINK for the long haul. Chainlink 2.0 is significant (whitepaper available below) and the latest interview with Sergey Nazarov and Lex Fridman sold me on the practical use case.
Some things I learned:
Nazarov seems to have created a product that is literally going to improve the world, offering real practical application of DeFi (crop insurance) into emerging markets brought together with smart contracts to reduce risk for the issuer.
The smart contract is like a really good vending machine but LINK enables taking factors outside of the blockchain such as weather and using this additional API data to determine the outcome of the smart contract. The integrity of this "third party" data that originates outside of the blockchain is imperative, and they seem to have a compelling product here that seems to be essential for the practical application of DeFi. DeFi is an emerging market, but following that interview I felt much more comfortable understanding where DeFi is really targeted, and the answer is: Emerging Markets.
-This was likewise his explanation of why products like BlockFi paying 8.6% yield on a USD position can pay 8.6% for you to literally hold totally liquid dollars. Keep in mind I am still stuck in American Airline Junk bonds I can not unload with a 3.4% coupon with lots of inherent risk within American Airlines. 8.6% to hold a dollar position is remarkable, and it is because these applications are targeting emerging markets where rates are even higher, but the capacity for production is also likewise very high.
Chainlink is an emerging market servicing emerging markets initially. Linking outside events to the blockchain to facility a trustworthy action so someone with a $30 Android phone in a country with poor infrastructure, a shoddy government, and weather issues the ability to tap into products like insurance and not have to worry about his local insurance company dragging on the claims settlement for years, and perhaps not honoring their agreement. LINK will bring accountability and lower costs for emerging markets.
-High tide raises all ships friends! :)
One other interesting tidbit is the SWIFT relationship with Chainlink. Many may not know that the SWIFT system enables transfers of money overseas.
-Chainlink and SWIFT formed a relationship back in 2016 when Chainlink won an award at the Innotribe Industry Challenge event by SWIFT. Chainlink touts:
“We’re proud to be working with SWIFT on their own SWIFT Smart Oracle. Allowing smart contracts on various networks to make payments, send governance instructions, and release collateral with over 11,000 banks.”
If you are a fan of LINK hit the like button or have an alternative analysis please be sure to share in the comments below!
White Paper: research.chain.link

BFLY HITTING SUPPORT - $20 PRICE TARGETBFLY - Current Price $ 10.23 Price Target (short-term) $12.50 Long Term $20
This company created an Ultra sound that is hand held and can give you the same images and accuracy as the ones in use in the USA. The best part about the innovation is the cost reduction. These cost under 3k while most ultra sounds cost a million +. This innovative tech will be used to bring this technology to poorer developing countries. Just reported $0.57 EPS last quarter on an annual basis that would be a PE of 4.5x which is cheap given the growth prospects for this company. Looks great on the chart as we are seeing a double bottom off that $9.80 level. Long shares and calls here.

Rotation in international marketsIntroducing the Buffett Indicator
One aspect of the recent rotation from growth stocks to value stocks is that investors have been rotating into undervalued markets that have suffered ten-year downtrends. The "Buffett Indicator" provides a way of comparing country-wise stock market valuations. The indicator divides total market cap (TMC) by GDP plus Total Assets of Central Bank (TACB) to calculate the Implied Future Return (IFR):
TMC / (GDP + TACB) = IFR
Developed Markets
Of the developed markets, Singapore ranks best for Implied Future Return:
Singapore ($EWS): 6.8%
Spain (EWP): 4.9%
UK (EWU): 4.7%
Australia (EWA): 4.0%
Most other developed markets have negative IFR. Of the emerging markets, Egypt has IFR above 25%, and Pakistan above 10%. Turkey, South Africa, and Indonesia are all above 8%.
Now look at how some of these indexes have been trading. Australia was one of the first to break out of its long down trend in November of last year:
Spain also broke out in November:
Now the UK has broken out as of yesterday, as you can see in the chart above. Singapore is lagging a bit in sympathy with China, but you can see that it's making a run at its trend line:
Emerging Markets
The developed markets have definitely outperformed the emerging markets in this rotation. That's because developed market currencies have been crushing the emerging market currencies. I think that we could start to see some emerging market strength, though. South Africa is climbing:
Here's Turkey, struggling to break that trend line:
Egypt looks to be working on a U-shaped bottom:

USDMXN - Peso technical viewUSDMXN - Peso trade idea.
Technical View
Pattern - Triple Bottom
Support - 19.93810, 19.85110, 19.81000
Resistance - 20.09215, 20.21170, 20.31620
50 EMA - key support zone
200 EMA - Key Resistance zone
EM Currency pair - PESO yields had a nice move... We could extend further to 1.618 area!
Key tip: Trade your own trade plan for further confidence
Trade Journal
Just a trade idea, not a recommendation

Trends in select Emerging Markets (& smaller markets) via ETFsRecent trends in select Emerging Markets (and some smaller markets) viewed by their ETFs, for the countries: Brazil EWZ , Mexico EWW , New Zealand ENZL , South Korea EWY , China MCHI , India INDA - also vs. the emerging markets ETF IEMG , and the NASDAQ IXIC index.

$EEM dump - pullback is about to become way more pronouncedWatch out for continued pullback amongst many names. EEM looks to be heading to sub-50. #bearlyfe
Diamond dump into S wave

The Greenback is TurningThe U.S. Dollar Index has trended steadily lower for the last 10 months. But there are growing signs it has bottomed.
First, DXY managed to break back above its 50-day simple moving average in late February. It then made a higher high (versus earlier in the month), unlike its lower high in late November.
Next, it tried to sell off after the Fed’s uber dovish meeting last week, but quickly moved higher. Next, the bounce occurred around the highs of March 2 and February 5. That suggests resistance has become support.
Third, the 21-day exponential moving average (EMA) has crossed above the 100-day simple moving average (SMA). The 50-day SMA is about to follow suit. This reverses a pattern in place since the slide began in June.
This strength in DXY could be a warning sign for equities for two reasons. First, it comes despite the Fed’s dovish policy. Second, global-growth assets like the Australian dollar and copper have shown signs of hitting a wall lately. This bounce in the greenback could morph into a flight to safety.
TradeStation is a pioneer in the trading industry, providing access to stocks, options, futures and cryptocurrencies. See our Overview for more. [/i


VEMT Weekly - Lovely candle developing, confirmation on FridayBeautiful weekly candle developing on Vanguard's emerging market bond index off oversold levels. I have slowly been adding to my ISA & SIPP portfolios in anticipation. Great divi yield >4% and diversification.

(Emerging Markets) USDTRY Outlook 2021 And BeyondTRY can get even weaker through mid 2021.
strong recovery possible following it , especially after 2021.

Chinese Stocks Have Pulled Back HardThe run-up in U.S. bond yields has squeezed the dollar higher and dragged global stocks lower. This could be creating an opportunity in Chinese stocks.
The iShares Trust China Large-Cap ETF hit a 13-year high of $54.53 on February 17, followed by a sharp pullback in the last two weeks. A few interesting things appear on the chart.
First, FXI has returned to an upward-sloping trend line that began in late September. It’s also near the 100-day simple moving average (SMA) where prices bounced immediately before Christmas.
Next, Fibonacci shows we’ve retraced about 62 percent of the most recent leg up.
Finally, stochastics have returned to an oversold condition.
Given the sharpness of the recent drop, traders could watch for more signs of stabilization before jumping in. However, this could prove an interesting opportunity for longer-term trend followers.
TradeStation is a pioneer in the trading industry, providing access to stocks, options, futures and cryptocurrencies. See our Overview for more.


Select Emerging Markets down frm Jan 2021, not like IXIC mid FebSelect Emerging Market ETFs (U.S. listed in $USD) falling since Jan 2021, not like the IXIC (Nasdaq Composite Index) only since mid Feb: Russia RSX, Brazil EWZ, Mexico EWW, South Korea EWY, Thailand THD, New Zealand (ENZL - small market, not emerging market).

China's Consumer Discretionary ETFFrom the beginning of 2020, emerging markets, and specially China, had been really outperforming.
The sector has taken a 12% correction from its high on February 16th. Which was coincidental with the past sell signals from the drawn channel.
We have tested the 50sma, which has worked as the lower channel trend line in this system.
Risk-reward-ratio is fantastic as we can a stop below the moving average; with a target around $42.
Top 5 Holdings:
Meituan (10.38%)
Alibaba (7.92%)
NIO (7.42%)
JD (6.98%)
PDD (5.94%)

FEAR INDEX IS TWEAKING, SOMEONE PULL THE RUG ALREADYpotential fear and uncertainty for wallstreet boys
a VIX spike UP could advise DXY long

$BABA drawingsMore drawings..Feel free to offer teaching and enlightenment!
every reason to be bullish on $BABA..undervalued amazon jr...
*maybe we should be bearish?!
Will the US continue it's big brother-esk guidance over China?
Can Jack Ma stay in public longer than 25mins?
I think institutions drop these tech stocks and hop on the value train
tbd

VWO - Emerging Market Macro Analysis The macro data from this month's Markit PMI's is sending a bit of mixing signals from the countries that VWO has the most exposure to, but I am still optimistic as to the near-future performance of the emerging markets.
Before going into the macro analysis, whats the market allocation of this ETF.
The 80% market allocation is the following:
- China -> 42.5%
- Taiwan -> 16.5%
- India -> 11%
- Brazil -> 5.9%
- South Africa -> 4.1%
After a quick look at the list above, we can see that China and Taiwan are almost 50% of the market allocation, so it is important to follow their situation closer.
China Macro Overview
China PMI's are sending mixed signals regarding the growth of Chianese economy, with a possible hint as to slow down in the next few months.
The manufacturing report is showing a slow down in growth in the production and new orders.
The new export orders are declining again below the 50 level, which indicates a possibility of contraction, there is also an indication of rising costs.
And that's likely to reflect in the results of Q2, or even in the Q3.
Taiwan Macro Overview
In comparison to Chinese PMI's, Taiwanese reports are much more optimistic, with strong growth in the last months.
January Manufacturing PMI is reporting growth in Output and New Orders, which are leading indicators in themselves.
Employment has increased substantially, which is a good indicator as to the health of the Taiwanese economy in the current situation.
In my opinion, the Taiwanese companies will lead the performance in the VWO for the next few months.
Indian Macro overview
India is another country reporting growth in January if we keep in mind the allocation size in this country in this ETF, it gives an optimistic outlook for its performance.
New Orders, Exports and Outputs are rising for another consecutive month. The employment situation is still contracting but at lower levels than before. That may be an indication of possible employment growth soon.
The overall outlook for the Indian economy is positive and in conjunction with positive data from Taiwan, that's good news for the emerging markets.
Additional Macro overview
Brazil, South Africa are other countries in the top 5 of the allocations for this ETF. Their allocation size is reasonably smaller than the countries above so I won't go into much detail.
Brazil situation is not very bright, as to the information provided by PMI reports, even that manufacturing showed slight improvements, the services are contracting again.
The situation in South Africa seems to expand but at a slow pace, there are still many concerns as the effects of the pandemic on the overall economy.
Final Opinion.
As we can see from the macro overview of the countries, which are the key components of the market allocation of this ETF, the outlook is mostly positive.
Some may be concerned by the mixed data from the Chinese PMIs since China is the biggest player in this ETF, it may affect the performance. However, there is a positive outlook for Taiwan and India.
I believe they will compensate for the possible slow down in China, and it'll drive the EM performance for the next few months.
Sources:
- Caixin China General Manufacturing PMI
- Caixin China General Services PMI
- IHS Markit Taiwan Manufacturing PMI
- IHS Markit India Manufacturing PMI
- IHS Markit India Services PMI
- IHS Markit Brazil Manufacturing PMI
- IHS Markit Brazil Services PMI
- IHS Markit South Africa PMI

Have some markets shown they have already past a mid Jan peak?Some markets seem to have shown that they peaked in mid-January... indicated in their U.S. listed, $USD denominated, ETFs: Russia RSX, Brazil EWZ, India INDA, Thailand THD, Europe EWZ... and also in certain financial markets as indicated by a Commodity Tracking fund DBC, and see also the US Government Bond 5 Year Yield .

My long-term outlook on Silver SLVThe chart is pretty much self explanatory and very simple to understand. I pretty much see silver as a good investment whether if you buy shares or you own the commodity out right.
This would be my ideal scenario for silver to climb to all time highs by 2022.
Break and hold over $27 would open up a climb to $50. This could also happen much faster based on global requirement to hedge the falling value of fiat. Silver is also a material that is used in some of the fastest growing emerging markets of solar power, electric vehicles, smartphones, green energy and much more.
This move in silver could be similar to what you saw in GameStop. Be sure to do your own research and see if what I say make sense to you!

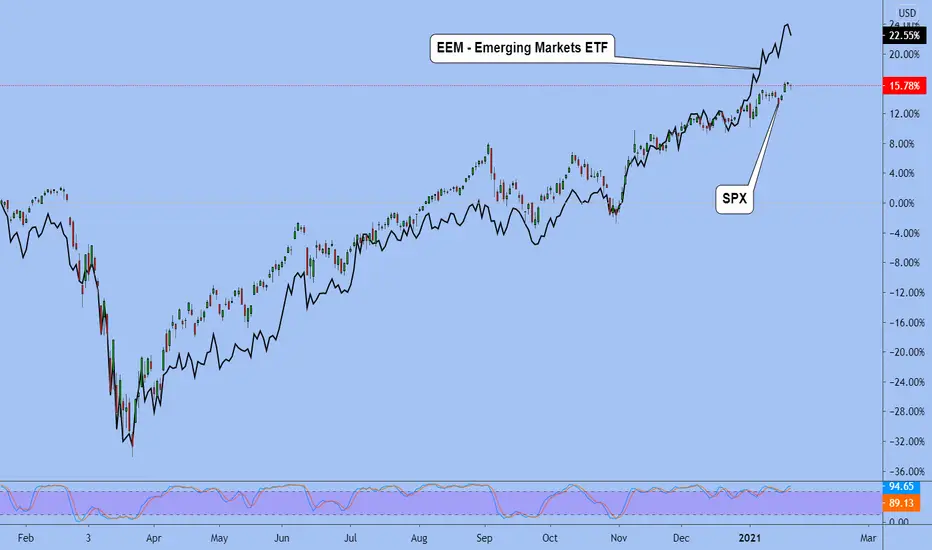
Emerging Markets leading the COVID reboundSince 3/23/20 when all three bottomed out, the SPX (green) has outperformed the Europe, Australia, Asia, and Far East ETF (blue, ticker symbol EFA), but both are lagging behind the Emerging Markets ETF (orange, ticker symbol EEM).
The SPX has been leading most of the way, but last month the Emerging Markets became #1.
Investors have banked on strong recovery potential in the emerging markets.

What bubble? EEM at long term resistance. Breakout or Fake out?Emerging Markets looking to breakout IMO. Stop believing in bubble boogiemen. Follow the trends. The trend is up until otherwise noted. I prefer EMQQ to EEM.

SXP < Emerging Markets Emerging Markets has been overtaking the US market for the last month.
Typically, when emerging markets are active, commodities begin to grow.
Emerging Markets Chart
Emerging Markets ETF
www.ishares.com
China
Best regards EXCAVO