Brazil ETF Trying to Break Multiyear ResistanceEmerging markets and global stocks have roared to life at the end of 2019. The reasons are a dovish Federal Reserve , which drives buyers away from the U.S. dollar , and calming tensions between the U.S. and China. Brexit clarity has helped too.
Along with China, Brazil is the most actively traded emerging market. Its iShares MSCI Brazil ETF has even stronger technicals than the iShares China ETF . Unlike the China fund, EWZ's 50-day simple moving average (SMA) is above its 200-day day.
EWZ is also pushing a longer-term resistance level around $48 running back to early last year. The breakout hasn't been confirmed yet, but traders may want to keep an eye on it. Global stocks have been neglected for so long that there could be a rush of money back into them if this change in sentiment continues. Similar turns from "hated" to "loved" recently occurred in stocks like CVS Health and UnitedHealth .
Brazil has two other things potentially in its favor. First is its reliance on commodities, which have started to outperform and got a bullish call from Goldman Sachs this week. Second, Brazil has passed a key pension overhaul that's expected to help fix its chronic budget problems.
Emergingmarkets

Technical Analysis Update: Tadawul All Share Index (TASI) - SaudSummary
• TASI / KSA break out of bull head & shoulders bottom trend reversal pattern.
• Indicates continuation of long-term upward sloping trend channel.
• Key Fibonacci zone targets marked on enclosed charts.
Bullish reversal is indicated as the Tadawul All Share Index (TASI) (Saudi Stock Market) breaks out of a head & shoulders bottom reversal pattern at the start of the week. The pattern formed following the completion of a 78.6% Fibonacci retracement of the near-term downtrend.
A continuation of a long-term uptrend channel can be anticipated with an eventual rally back to the top of the channel. Fibonacci retracement and projection levels are marked on the enclosed charts to identify potential near and long-term price targets.
Nevertheless, a decisive daily close below the head at 7,396.60 is a failure of the above bullish scenario, while a daily close below the right shoulder at 7,808.54 puts the bullish scenario at risk and requires a new assessment.
Investors in US markets can access the iShares MSCI Saudi Arabia ETF (KSA) ETF for exposure to the Saudi Arabia stock market. An upside breakout in KSA occurred this week as price closed above $30.56 on a daily basis. Support at the bottom of the right shoulder of the head and shoulders bottom reversal is at $28.97, while the bottom of the head is at $28.04. Fibonacci target levels for KSA are noted on the weekly chart below.

SPX500 future for coming weeks Long story short. New highs incoming.
I went long today before VIX loses its mind from the good ole "EVERYTHINGS GANA CRASH" people and premiums on calls/puts go wild.
---Indicators:
RSI is trending up. not over bought yet.
Gold sold off hard today. Still down trending off a massive weekly resistance
TLT had money go into it and its rise got smacked back down to almost even with its weekly open
emerging markets had a great week - always good
vix is vix - My assumption is we see volatility go crazy as we swing around the monthly resistance. Then it will die down until election time.


An extremely easy but super efficient investing ruleIt's actually disgusting that it would be so easy...
Countries approaching socialism: Sell & Let them starve.
Countries abandonning socialism: Buy & Hold.
It's barely more complicated than this.
Most African countries have been living in absolute misery probably because after the soviet union stopped sending them free stuff, the european union and americans have been taking pity on them and throwing free stuff at them. To feel good about themselves. All this has accomplished is enabling awful (even much worse than the soviet union's) anti business anti ownership regulations, the people need to be pushed to the limit and have nothing to lose and nothing to hope for to make a change, all these "helpful" organisations sending food clothes medicines, all these altruist doctors, they are responsible for misery in Africa.
If they think they are going to heaven for their "good actions" boy do I have bad news for them (:
With the US stock market in a bubble and nearing explosion I'd say it's not the time to invest right now.
The whole world will feel the shockwave.
Some GDP growths:
I've been looking a bit at Rwanda but just to get a better idea, to be able to more easilly recognize when this happens ELSEWHERE, I will not invest in a country of murderers.
While the herd is getting all excited by big US names and new techs (dot coms, crypto...) AFTER the gains have been made, anyone will a brain bigger than a walnut should look for everything that is undervalued, it should be a habit. I am a speculator not an investor but I figured this is how you do it. I am not saying there is no speculating, actually investing in some 3rd world unstable countries you better be prepared to lose then totality of your investment, but it can also go way up.
Imagine this: some complete ruin of a country, worth zero, simply mentionning its name and investment in the same sentence makes your average person laugh.
The harder they laugh the bigger the potential. "The people" are ALWAYS wrong just do the exact opposite.
Also, if the population of the USA gets butthurt and jealous enough they WILL vote socialist I can guarentee 100% it will happen if they get salty enough.
Just like Donald Trump could win the election in 2016.
And when that happens, all the world economies relying on free innovations coming from "evil capitalist" US will crash. Forget GDP growth. Plus there's the climate religious freaks that want to conquer the world.
Also europe free ride on the back of the US military will probably be over. They're going to have to spend their own money.
Having ideals is cute when you have a large nation doing all the work for you, or when you have huge Oil exports and literal unironic millions of slaves.
But when reality knocks at the door, it wields a baseball bat.
Always remember: During the white revolution Iran experienced double digit growth.

EDC, IMPULSE SEEMS TO CONTINUE, +18% OPPORTUNITYEDC key support for impulse continuation is being confirmed (wave 4)

EW Analysis: Bullish Emerging Markets May Push EURUSD HigherHello traders!
Today we will talk about emerging markets(EEM) and EURUSD.
As you can see in the first chart, there's a positive correlation between emerging markets and EURUSD. Of course, there are no tick by tick correlations, but the current wave structure it's telling us that we may see a bigger recovery in the upcoming days/weeks.
Emerging markets can be trading in a three-wave (A)-(B)-(C) recovery up to 61,8% Fibonacci retracement and 46 area, especially after that break out of the corrective channel, so in our opinion EEM may easily stay in the bullish trend.
At the same time we can see strong and impulsive recovery on EURUSD, which is telling us that the temporary bottom can be in place and a bigger three-wave (A)-(B)-(C) correction can be underway up to 1.15 - 1.18 area, mainly because of break out of the wedge pattern (ending diagonal).
Notice that these are daily charts and they may take some time to completely unfold, so don't get confused on the smaller time frame charts. We just want to give you an idea, where the markets can be headed long/mid-term.
Be humble and trade smart!
If you like our analysis, then please give us a like and share it!
Disclosure: Please be informed that information we provide is NOT a trading recommendation or investment advice. All of our work is for educational purposes only.

Colombian Peso under Pressure The Colombian peso has been making headlines lately. There are calls of Colombia to dollarize amidst some expert calls that the COP might be overvalued by as much as 30%. This chart is an update to my last year's chart that correctly forecasted the current price range in the usdcop pair.
According to this chart, continued dollar strength and a weak cop could see prices rise by 30% $4500 once we break the key $3500 level.
--
El peso colombiano ha estado en los titulares últimamente. Hay llamadas de Colombia a dolarizar en medio de algunas llamadas de expertos de que la COP podría estar sobrevaluada hasta en un 30%. Este gráfico es una actualización de mi gráfico del año pasado que pronosticó correctamente el rango de precios actual en el par usdcop.
De acuerdo con este gráfico, la fortaleza del dólar y un policía débil del cop podrían ver los precios aumentar en un 30% a $4500 una vez que rompamos el nivel clave de $ 3500.

$USDZAR might see some short term reprieveThe Rand / Dollar exchange rate has consolidated for a couple of sessions below the previous highs seen last in September 2018. Should the rand bears decide to take further profit, two short term levels to watch out for are 15.00 and 14.60. However, should the rand weaken past the 15.46 closing print from Monday the 19th of August, this should put the rand in a very precarious position with further downside expected. For now, the fact that the previous highs seen in September 2018 have held together with the fact that we are starting to see Divergence develop on the RSI (Higher highs in price - lower highs in RSI), gives me a clue that momentum is waning and we could expect a very short term correction back to my levels indicated. However, the medium/longer term trend on the USDZAR pair is still very much in favor of much higher levels, so i would trade this very short term view with a high degree of caution.

USDZAR ShortWe have seen ZAR very weak recently due to heavy RISK OFF and some weak zar data.
I'm anticipating a RISK ON week which will see ZAR gain some strength, we, have weak PMI data during this week which will give us our prime level to sell
I have 3 TP's set for this trade
TP 1 - 15.17456
TP 2 - 15.02576
TP 3 - 14.64768

Earthquake Cracks Widen - NZD COP BRL small currencies Vs. SP500Earthquake Cracks Widen from early 2018 - NZD COP BRL small canary-economy currencies Vs. the S&P 500

China Breakdown Imminent.Be prepared. China looks as though it is about to break down VERY HARD and VERY FAST as my Fibonacci price amplitude arcs suggest recent price rotation is setting up for a deep downside price move. My estimate is that this will happen on or after my Aug 19th projected breakdown date.
My opinion is that Asia/China are about to crush the market with a complete price collapse that may lead the rest of Asia and some of Europe into chaos.
Plan and prepare. BUY GOLD.

$EEM - Emerging Markets Under PressureAs volatility has come back to the global markets with a vengeance, one headwind that continues to blow even stronger continues to be the US-China trade war. On August 2nd, the US unexpectedly imposed additional tariffs on Chinese goods, with the Chinese now threatening to retaliate in kind. As a result of this renewed volatility, Emerging Market stocks ($EEM) have been rattled heavily over the past few trading sessions.
On a technical basis, $EEM prices are below all three of its EMAs, with a death crosses forming on i) the 10-Day and 50 & 200-Day EMAs, and ii) the 50-Day EMA and the 200-Day EMA, something that has not been seen since May. Further, its RSI continues to fall, indicating that momentum is quickly increasing to the downside as global investors lose faith in Emerging Markets. Lastly, $EEM prices seem to to be in a downward trend since July 25th, with the EEM/SPY price ratio continuing its march lower, as global investors (continue to) invest in the US over Emerging Markets.
Given the increase in rhetoric between the two economic giants, Emerging Market stocks are currently under heavy bearish pressure, with no end in sight. If these pressures continue on the space, we see $EEM heading lower to $38.45 as its next stop.

$EEM Emerging Markets - Dead MoneyAfter a breakout first half in 2019, Emerging Market equities ($EEM as a proxy) have begun to loose some steam.
Since February, Emerging Market stocks have been treading water, in relation to their US equity counterparts, trading in an established range of $44-$40 since then.
On a technical basis, $EEM weekly chart is showing that Emerging Market stocks are not in trend at the moment, with its ADX below 20, and an RSI remaining flat since June 1st, despite the increase in moment in late May.
On a fundamental basis, despite their cheap valuations relative to their Developed Market peers, and accomadative global central bank policies, Emerging Market stocks seem to still be weighed down by economic weakness in China, the US-China trade war, weak global PMIs, and the overall slowdown in global growth.
Going forward, we see this trend persisting over the next few weeks and months, unless their is a positive shock to the global economy and financial markets.
For looking investors who are adventurous, we recommend investors to drill down within Emerging Market stocks and be selective on a regional and sectoral/industry basis.
Additionally, investors should take a look at Frontier Markets ($FM as a proxy), which has performed much better year-to-date in relation to their Emerging Market peers.

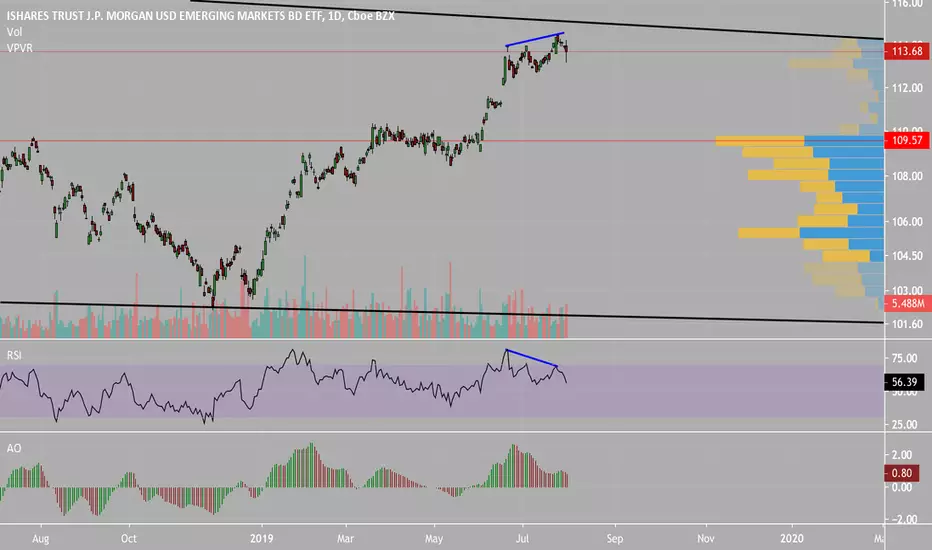
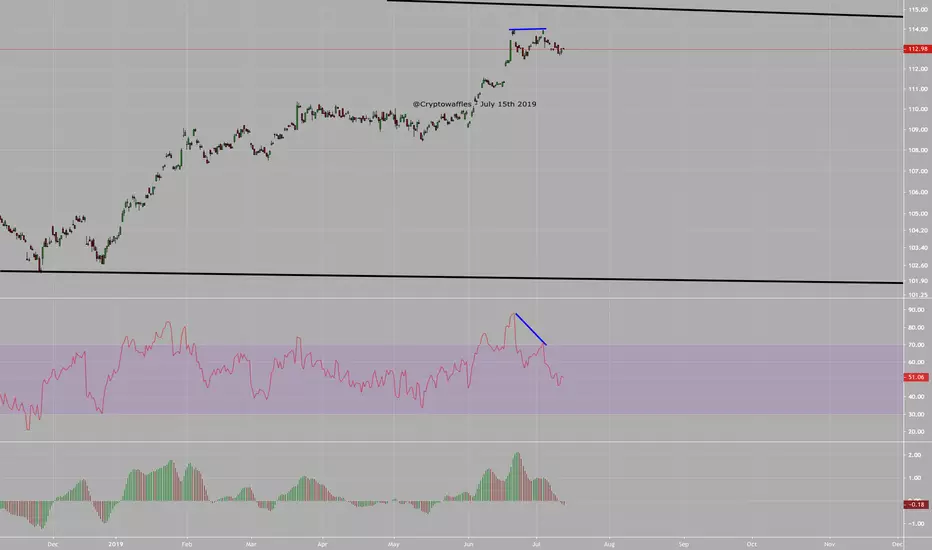
Take advantage of how sensitive the market is!We currently live in a world where media has major sway in the psychology of investors, including ones who do their homework. After watching $EEM closely, I see that at each major event over the past few months (tariffs placed on China, Federal Reserve doesn't reveal a rate cut at June 18-19th meeting, G20 meeting) the ETF spiked before cooling down as more information became available. I see an opportunity that can be taken advantage of regarding the upcoming FOMC July 30th date. Short term profits although as history has shown they can be short lived, so take profits early I would suggest.
The rising wedge suggests a potential spike but an inevitable drop as more data is made available.
PS: I forgot to add some indicators to further support my argument, but feel free to comment and give your own opinion, also this is my first post so I'm open to any constructive criticism you have too.

$EMB | 4HR Timeframe | Losing Momentum | Bearish Divergenceat resistance, logical place for the bulls to take profits, watch out for dis bearish divergence
USDCLP Weekly ABCD LongH&S has failed but structure is still to the top side (hl's hh's), bias is for upside continuation to 760 with a stop below 660 swing low (if aggressive can dial up RR using a median line stop), if 660 is given would favour a broader double top formation and usdclp for lower.
For now weekly Mas are supporting price action.
But remember, anything can happen! :)


EEM weekly H&S BearishBearish weekly setup for emerging markets targets c 25 into year end. Idea negated on a break above 45

Korea ETF bullish butterfly pattern!Aim for the red box.
time segmented volume is signaling momentum reversal.
