NQ | NASDAQ - Weekly Recap & Gameplan - 03/08/25📈 Market Context:
The market is pricing in a potential 0.25% rate cut in the September FOMC meeting, keeping the overall structure bullish.
Although we saw a retracement after the Non-Farm Employment Change came in weaker than expected, bullish sentiment remains intact.
Currently, market sentiment has shifted to neutral from last week’s greed. Augusts are often choppy and prone to retracement/accumulation, but structurally, bulls still hold the upper hand.
🧾 Weekly Recap:
• NQ started the week strong with price discovery, pushing higher from Monday to Thursday.
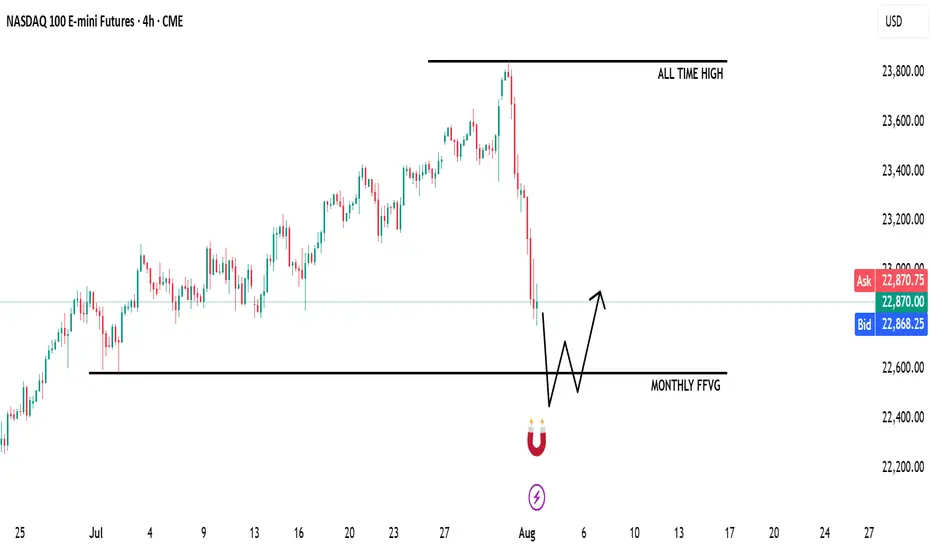
• Eventually, price ran a key 4H swing liquidity, which led to another all-time high.
• That move was followed by the start of a healthy retracement, signaling short-term distribution.
📌 Technical Outlook & Game Plan:
→ I'm expecting price to run into the Monthly Fair Value Gap — a major liquidity magnet in my model.
→ That move could generate significant bullish energy — at least a short-term bounce, if not a full reversal.
→ Until then, I remain bearish targeting 22,583 (my marked black line).
🎯 Setup Trigger:
After price takes 22,583, I’ll watch for:
• 4H–1H break of structure (BOS)
• Formation of fresh demand zones
→ Upon LTF confirmation, I’ll look to go long aiming for another test of all-time highs.
📋 Trade Management:
• Stoploss: Below the 1H–4H demand zone
• Target: Trailing stop strategy; aggressive profit-taking on the way up
• Note: Final target could be all-time highs, but I’ll manage the position actively
💬 Like, follow, and comment if this outlook adds value to your trading. Educational content and more setups are coming soon — stay tuned!
Emini
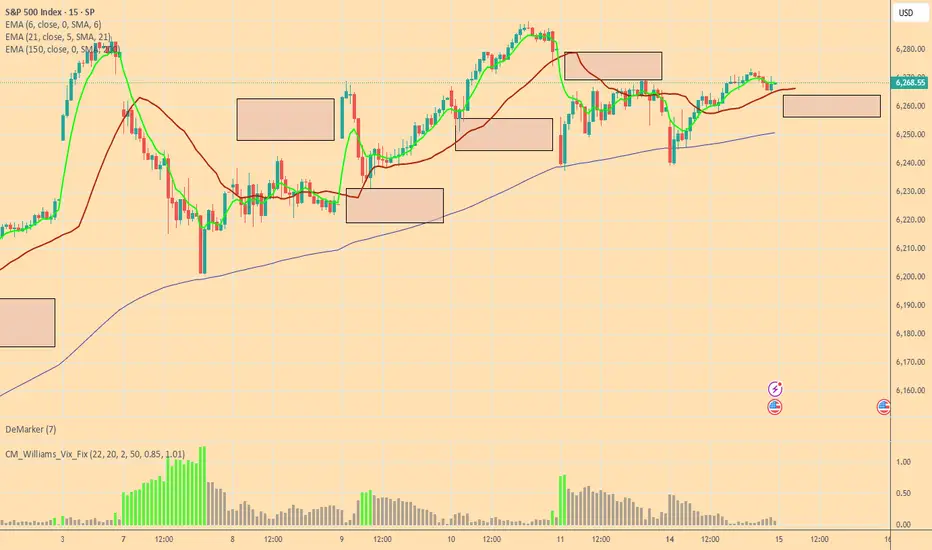
Bulls and Bears zone for 07-28-2025Last week 4 out of 5 sessions S&P 500 made new ATH. However they were all trading within a tight range.
Level to watch: 6434---6436

ES Weekly Recap & Gameplan – 27.07.2025🧭 Market Sentiment
The overall sentiment remains bullish, supported by:
• Declining inflation figures
• Trump’s pivot toward aggressive rate cuts
This shift reinforces a risk-on environment across U.S. indices.
🔙 Previous Week Recap
• ES continued its price discovery journey
• Price ran the 4H swing liquidity and shifted market structure
• A clean 1H demand zone was established post-MSS, leading to a strong move toward new ATH
• A bullish trendline has also formed as a visual representation of this momentum
• I anticipated a deeper retracement last week but adjusted my execution based on the ICT SMT concept — see previous week’s ES plan for details
📊 Technical Analysis
Looking forward:
• My expectation is a continued bullish price discovery
• Watching for price to tap into and potentially deviate below the Daily Fair Value Gap (D-FVG)
• This zone also aligns with the 0.5 Fibonacci equilibrium level, which I consider a discounted entry zone
• Confluence of liquidity + trendline + FVG + Fib makes this an ideal location for new long setups
⚙️ Setup Trigger & Trade Plan
Entry Strategy:
• Wait for a clear 1H–4H market structure shift
• Look for demand zone formation within the discount zone
• Execute long trades after confirmation and retracement into this zone
Trade Management:
🎯 Target: New All-Time Highs
⛔ Stoploss: Swing low beneath 1H–4H demand structure
🗨️ If you found this analysis helpful, don’t forget to like and drop a comment below — I’d love to hear your thoughts and setups for the week!
📥 Follow me for more weekly breakdowns and real-time updates throughout the trading week.

NQ Weekly Recap & Gameplan – 27.07.2025🧭 Market Sentiment
The overall sentiment remains bullish, supported by:
• Lower inflation data
• Trump’s policy shift toward aggressive rate cuts
This creates a strong risk-on environment across U.S. indices.
🔙 Previous Week Recap
• NQ continued its price discovery phase
• Price swept 4H swing liquidity and triggered a market structure shift
• A new 1H demand zone was formed after MSS
• Price revisited the 1H demand and launched toward new all-time highs (ATH)
• While I anticipated a deeper retracement, ES provided the cleaner pullback
• I executed longs on both ES and NQ using SMT divergence (ICT SMT concept)
📊 Technical Analysis
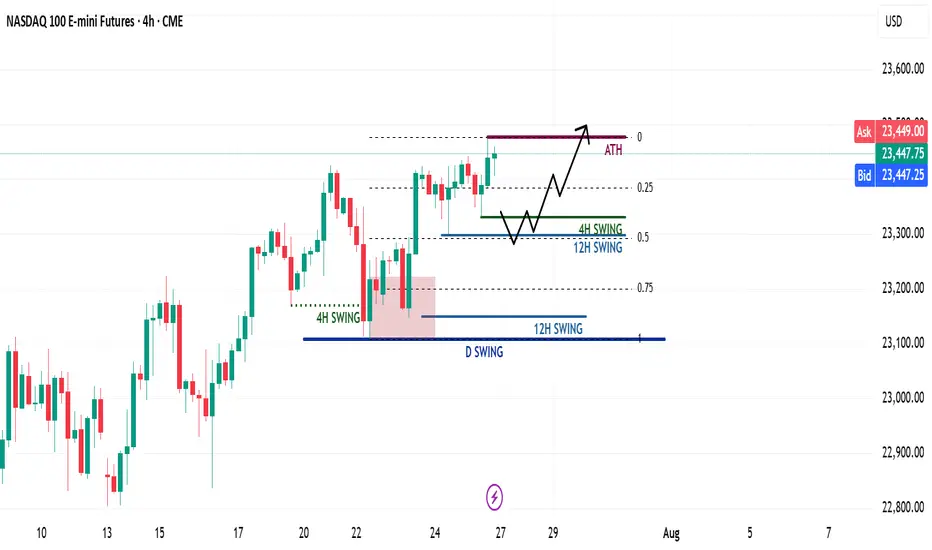
My bias remains bullish as long as the higher timeframe structure holds.
For the upcoming week:
• Watching for either the 4H or 12H swing high to get swept
• Ideally, a retracement toward the 0.5 Fib level, which aligns with my bullish discount zone
• A clean liquidity sweep into this zone could act as a launchpad for the next leg higher
⚙️ Trade Setup & Execution Plan
Entry Strategy:
• Wait for a new 1H–4H Market Structure Shift
• Identify the new demand zone post-MSS
• Look for price to return to the zone for a long opportunity with LTF confirmation
Trade Management:
🎯 Target: New ATH
⛔ Stoploss: Swing low of the 1H–4H demand zone
📌 Chart will include Fib levels, MSS zones, and execution trigger areas.
Let me know your thoughts or share your plan below.
Happy trading!
NQ Weekly Outlook & Game Plan 20/07/2025NQ Weekly Outlook & Game Plan
🧠 Fundamentals & Sentiment
Market Context:
NQ continues its bullish momentum, driven by institutional demand and a supportive U.S. policy environment.
📊 Technical Analysis:
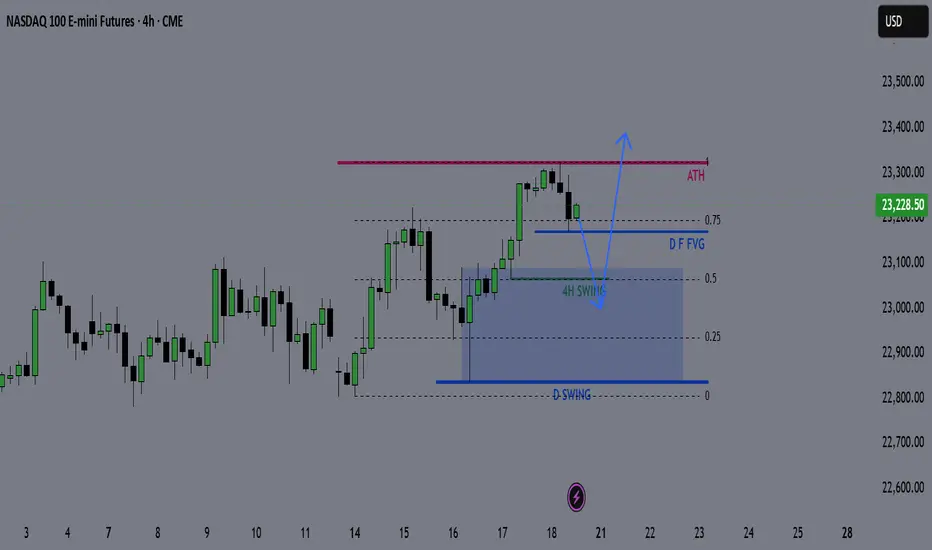
Price is currently in price discovery, and the weekly structure remains strongly bullish — so I prefer to follow the strength.
We might see a minor retracement before pushing further above the all-time high (ATH).
🎯 Game Plan:
I'm expecting a potential retracement to the 0.5 Fibonacci level, which is the discount zone in a bullish environment.
Interestingly, the 4H liquidity zone aligns perfectly with the 0.5 Fib level — this confluence suggests price may gather enough energy from there to make new highs.
✅ Follow for weekly recaps & actionable game plans.
NQ Weekly Recap-Projection 13.07.2025NQ Weekly Recap + Outlook
1️⃣ Recap:
NQ made a new All-Time High, but the breakout ended up being a deviation. Price got rejected and started pulling back.
This signals potential weakness and suggests price may want to explore lower levels.
2️⃣ Bearish Scenario:
📍Target: Daily Swing low (Blue line)
📍Deeper target: Weekly Fair Value Gap (Purple zone)
I’ll look for LTF confirmations around these zones to position for potential longs.
3️⃣ Bullish Catalyst Watch:
There’s increasing speculation that Powell may resign this week.
If that happens, we could see:
✅ Strong bullish momentum
✅ Little to no retracement
✅ Immediate push into new ATHs
Weekly Plan Summary:
🔸 Scenario 1 - Pullback Continuation:
Look for reactive long setups at Daily Swing or W FFVG zone.
🔸 Scenario 2 - Powell Resignation:
Expect a breakout move with momentum — potentially no retrace.
Stay nimble. Trade what the chart confirms, not what the news promises.

Bulls and Bears zone for 07-15-2025ETH session market is trading higher and expected to Open gap up.
Would traders be able to keep that momentum going rest of the RTH session.
Level to watch: 6328 --- 6330
Bulls and Bears Zone for 07-02-2025S&P keeps going higher after new ATH high earlier this week. Markets could go higher for a while if we see any pullback.
Level to watch: 6232 ---6234

Bulls and Bears zone for 06-12-2025Overall market is continuing to rally in general.
However, market sold off during ETH session and it's trying to recover in the morning.
Level to watch : 6017----6019

Bulls and Bears zone for 06-03-2025SPX has been trading in a range since mid May. Perhaps a pullback might be in the cards.
Level to watch: 5946 --- 5948
News to Watch:
US Factory Orders 10:00am
US JOLTS 10:00am

Nasdaq Bulls Back in the Fight – 21K Is the Battlefield📍 The 21K Line in the Sand – Nasdaq’s Second Chance Setup
The bounce off the purple EMA was no joke — big reaction, and now we’re reclaiming key structure: back above VWAP (red), white EMA, and even the weekly pivot (straight orange line).
That pivot zone at 21K is still the line in the sand. I do expect a potential breach — maybe even a quick liquidity sweep — but if buyers step in with momentum and reclaim, I’m interested in longs again.
⚔️ This is a momentum shift — structure's back in favor of bulls, and until we lose 21K with conviction, I’m treating dips into that area as buyable.
📍And if price overreacts? I’m watching 20,750 as a “second chance” zone. Strong bounce there before — I’m not ignoring that twice.
This is still a two-sided game, but for now, bulls are back in position. Let’s see if they hold the line.


Bulls and Bears zone for 05-14-2025ETH session markets trending higher, could traders continue this week's rally or need to be cautious.
Levels to watch: 5912---5914
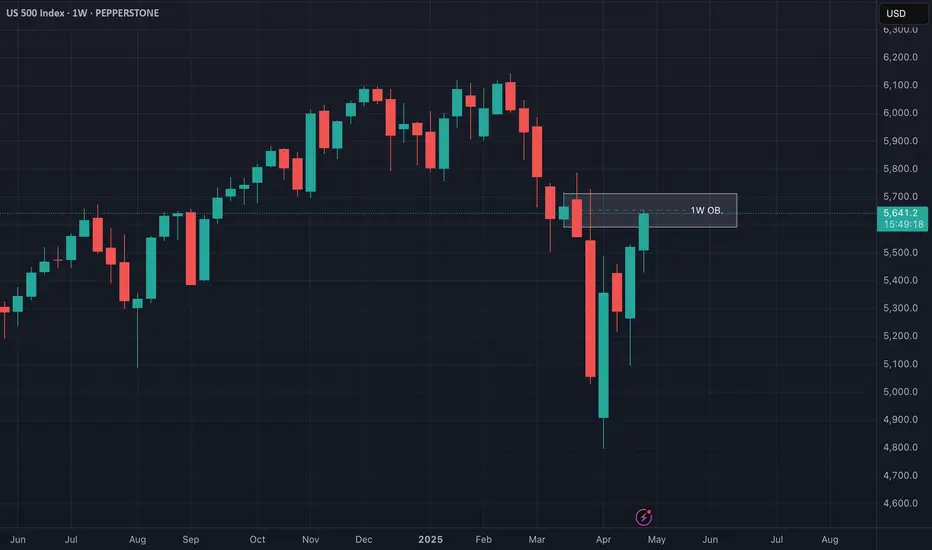
US500 at Critical Resistance - Weekly Chart Breakdown📊 US500 Weekly Chart Analysis
Taking a close look at the US500 on the weekly timeframe, we can see price has now traded directly into a bearish weekly order block 🧱 — a key distribution zone where smart money activity often emerges. At this level, the market is trading at a premium 💰 and appears to be overextended 📈.
⚠️ From a risk management standpoint, I’d advise extreme caution — the current conditions could set the stage for a sharp retracement, especially as we approach week’s end. This level aligns with areas where institutional players may look to offload risk or reverse exposure.
🔁 A potential pullback from here would not be surprising, given the elevated context and technical structure.
📚 This breakdown is for educational purposes only and should not be considered financial advice.
Bulls and Bears zone for 05-01-2025S&P 500 is going to have a gap up Open and finally closing gap from early last month.
Also traders could be taking profit after yesterday's big UP move.
Level to watch: 5643 ---5645
Reports to watch:
US : PMI Manufacturing Final 945am
US : ISM Manufacturing Index 1000am
US : Construction Spending 1000am

Weekly Price Action: S&P500 Emini Futures ES1! Tuesday 4/29/2025In this video, we will be looking into the potential price action ES1!.

S&P 500 E-mini Futures: Bullish Momentum Meets Key Resistance📈 Technical Analysis: S&P 500 E-mini Futures (ES1!) – April 2025
🚀 Market Structure & Price Action for US500
The daily chart shows the S&P 500 E-mini Futures in a bullish recovery after a significant correction. The recent rally has pushed price back toward previous swing highs, an area likely to contain resting buy-side liquidity. This move suggests that the market is currently in a markup phase, but is now approaching a critical resistance zone where profit-taking and counter-trend activity may emerge.
🧠 Wyckoff Perspective
From a Wyckoff methodology standpoint, the recent price action resembles a classic accumulation-to-markup transition. The sharp selloff in March and early April appears to have formed a selling climax (SC) followed by an automatic rally (AR) and a secondary test (ST). The current advance could be interpreted as a sign of strength (SOS), but the proximity to previous highs raises the risk of an upthrust (UTAD) or a bull trap if supply emerges.
🌊 Liquidity & Potential Pullback
As price trades into the prior highs, it is likely "eating" buy-side liquidity—triggering stops and breakout orders. This process often leads to a liquidity sweep, where price briefly exceeds resistance before reversing as large players offload positions. If the market fails to sustain above these highs, a pullback or even a reversal could be initiated, especially if volume and momentum wane.
🌐 Market Sentiment & Fundamentals
Current sentiment remains cautiously optimistic, with the S&P 500 E-mini trading above 5,500 and recent sessions showing resilience despite mixed earnings and macroeconomic uncertainty. The broader market is supported by expectations of stable Fed policy and robust corporate earnings, but there are persistent concerns about inflation and global growth. According to Markets Insider, the ES futures are up 0.59% recently, reflecting a positive but not euphoric tone. However, as noted by Investing.com, there are signs the market could be setting up for a reversal if bulls fail to maintain momentum.
🛠️ Trade Ideas
🟢 Bullish Scenario: If price breaks and holds above the previous highs with strong volume and closes, consider a long entry targeting the next psychological resistance (e.g., 5,700–5,800). Place stops just below the breakout level to manage risk. This would confirm continued demand and a potential extension of the markup phase.
🔴 Bearish Scenario: If price fails to hold above the highs and forms a reversal pattern (e.g., bearish engulfing, upthrust), look for a short entry targeting the first support zone (e.g., 5,300–5,200). Stops should be placed above the failed breakout. This would align with a Wyckoff upthrust after distribution and a likely liquidity sweep.
⚠️ Disclaimer
This analysis is for informational purposes only and does not constitute financial advice. Trading futures involves significant risk and may not be suitable for all investors. Please conduct your own research and consult with a licensed financial advisor before making any trading decisions.

Daily Price Action: S&P500 Emini Futures ES1!In this video, we will be looking into the potential price action of ES1!.

Bulls and Bears zone for 04-16-2025Earlier this week S&P 500 has formed a Death Cross which could be significant or not only time will tell.
Any test of yesterday's Close could provide direction for the day.
Level to watch: 5354 --- 5356
Reports to watch:
U.S. Housing Market Index at 10:00AM EST
U.S. Jerome Powell Speaks at 1:30PM EST

Daily Price Action: Futures S&P500 Emini ES1! Tuesday 4/15/2025 In this video, we are looking into the potential daily price action of ES1!.

NASDAQ Futures Long Setup: Pullback Entry After Tariff BoostMarket Outlook – April 13, 2025
Quick recap: In my last public analysis, I mentioned watching the 18,350–18,000 zone for signs of support — a level stacked with confluence (50–61.8% Fib, EMA, VWAP, pivot). Price broke down deeper than expected but responded beautifully:
✅ Tagged 18,000 almost to the tick
✅ Rejected hard at the 61.8 Fib
✅ Respected the 50 Fib on the way back up
All solid signs of strength.
Now with tariff exemptions announced today (bullish for tech/Nasdaq), I’m opening the door to more long setups this week.
Here’s What I’m Watching:
🔹 Scenario A: Pullback into the 18,575–18,500 zone (first dotted white line). If price reclaims structure or gives me something clean — EMA bounce, VWAP tag, candle pattern — I’ll look for longs.
🔹 Scenario B: If that level breaks or I miss the first shot, I’ll look for a second chance around 18,000–18,300. Same deal: not jumping in blindly, waiting for a setup to form.
To be clear — these are areas of interest, not automatic trades. I want clean structure and confirmation before entering.
Let’s see how it plays out. Will update if/when I take a position. Stay sharp. 📈

European session - Futures, another day down?Each morning I connect at 9am italian time. I look at Asian indexes, then FTMIB, FDAX to see how Europe is responding to the tariffs story.
I start watching ES NQ YM GC CL in early US premarket. If volatility is good we can have some shots otherwise waiting for news (often 8:30 ET ) or 9:30 US open.
This morning is a waiting for me.
FTMIB is rejecting now the 33000 JLInes but too early to start trading it.

#202513 - priceactiontds - weekly update - nasdaq e-mini futuresGood Evening and I hope you are well.
comment: Last week I wrote that we need a proper channel down and the past week was the worst case scenario for the bulls. We could not even get to the 50% retracement and turned down violently again. There is a small chance for the bulls to make this a double bottom and go sideways but as of now that is very very low probability. More likely is that we have formed the top of the channel and will get a big second leg down to 18000 or lower. If we go down below 19000, my thesis is that we go down for 2 more weeks and then earnings will decide on the next impulse. For now the technicals are clear, market could not even retrace 50%, we turned around the daily 20ema and volume on the down move is picking up again. Everything points to a bear trend.
current market cycle: strong bear trend
key levels: 19000 - 20500
bull case: Bulls running for the exits. They have some previous support at the 2024-09 low 19073 but that is most likely not stopping this freight train down. Next big support is at 18000/18100 which is my W3 target. Only question now is if we find buyers tomorrow who want to keep the market above 19000. It’s not impossible that we could see 1-2 more days of stalling around 19000 but given the current structure the selling is just too strong to look for any longs.
Invalidation is below 19000.
bear case: Bears have now erased about a year of gains and we are heading lower. Friday was another strong sell signal and bears now want to close the monthly bar at the very low to also produce a huge sell signal on the weekly and monthly charts. The selling is strong enough for at least a decent sized second leg and the measured move leads to 16200 which is between my year-end-special target of 17500 and the bull trend line from the covid lows. Plan for the next 2 weeks is the W3 and W4 where I expect W3 to hit 18000 and W4 could retest 19000.
Invalidation is above 20600.
short term: Clear bear trend now once we drop below 19000. W3 should get us to around 18000 while W4 could be good for a retest of 19000. No longs for me what so ever. Big bear trend line from 22450 has to hold.
medium-long term - Update from 2024-03-16: My most bearish target for 2025 was 17500ish, given in my year-end special. Clear W1 of this bear trend. Market now has to close below 19000 to confirm W3. Depending on how deep W3 goes, W5 will either reach only around 17500 or the bull trend line around 16000.
current swing trade: None
chart update: Added most likely upper bear trend line and adjusted the 5-wave series.
