ENA/USDT Breakout Pattern (18.04.2025)The ENA/USDT pair on the M30 timeframe presents a Potential Buying Opportunity due to a recent Formation of a Breakout Pattern. This suggests a shift in momentum towards the upside and a higher likelihood of further advances in the coming hours.
Possible Long Trade:
Entry: Consider Entering A Long Position around Trendline Of The Pattern.
Target Levels:
1st Resistance – 0.3015
2nd Resistance – 0.3217
🎁 Please hit the like button and
🎁 Leave a comment to support for My Post !
Your likes and comments are incredibly motivating and will encourage me to share more analysis with you.
Best Regards, KABHI_TA_TRADING
Thank you.
ENA

ENAUSDT 1DENA ~ 1D Analysis
#ENA The main support that you might be able to consider to start buying back from here with a short -term target of at least 10%+ from here.

ENAUSDT 2DENA ~ 2D Analysis
#ENA Buy gradually after re -testing this support with a short -term target of at least 15%+ from here.

ENA Possible Head and ShouldersENA might be forming an head and shoulders formation which could cause a significant drop in value.
Be careful if the level of 0.34 breaks. It's also a great short opportunity.
Thanks for reading.

$ENA - Scalp Long Trade IdeaENA | 2h
0.328 appears to be the local resistance level here
If we can get a valid swing point retest around 0.31-0.305, we'll considering to long targeting the bearish order block above
Setting stoploss just below 0.29
Targets:
0.347
0.379 (bearish order block)
0.392

ENA/USDT Price Analysis📌 About ENA Token
ENA is the native token of Ethena, a decentralized synthetic dollar protocol built on Ethereum. Ethena aims to provide a stable, scalable, and censorship-resistant crypto-native alternative to traditional stablecoins. The token is used for governance, staking, and liquidity incentives within the Ethena ecosystem.
📉 ENA/USDT Price Analysis (4H Chart on Binance)
🔎 Market Overview
🔹 Current Price: $0.3194
🔹 Recent High: $0.3420 (Resistance)
🔹 Recent Low: $0.2907 (Support)
🔹 Volume: 3.56M (High volume at recent dip, showing potential buyer interest)
📈 Bullish Factors:
✅ Short-Term Bounce: The price has rebounded from the $0.2907 support level, indicating buyers stepping in.
✅ Moving Average Support: The yellow line (short-term MA) is beginning to turn up, suggesting early bullish momentum.
✅ Key Resistance at $0.3420: If ENA breaks this level, it could move towards $0.3509 - $0.3718.
⚠ Bearish Risks:
❌ Overall Downtrend: ENA is still trading below the blue (medium-term) and green (long-term) moving averages, which could act as resistance.
❌ Lower Highs Pattern: The recent price structure suggests a potential bearish continuation unless it breaks above $0.3420 - $0.3509.
❌ Potential Drop to $0.2907 - $0.2530: If ENA gets rejected at resistance, a lower move to the major support around $0.2907 or even $0.2530 is possible.
📊 Possible Scenarios:
1️⃣ Bullish Case (Breakout Above $0.3420)
If ENA breaks and holds above $0.3420, the next targets are $0.3509, $0.3718, and possibly $0.3942.
A breakout confirmation would signal trend reversal.
2️⃣ Bearish Case (Rejection & Drop to Support)
If ENA fails to break $0.3420, expect a pullback to $0.3106 - $0.3060 first.
If those supports fail, ENA could retest $0.2907 and possibly drop further to $0.2530.
💡 Trading Strategy:
📌 Long Entry: If ENA breaks $0.3420, target $0.3718 - $0.3942.
📌 Short Entry: If rejected below $0.3420, look for shorts targeting $0.3106 - $0.2907.
📌 Stop Loss: Set below $0.2907 for long trades and above $0.3420 for short trades.

ENA About to Collapse or One Last Rally Before the Fall?Yello, Paradisers! Is ENA about to crash hard, or is a sneaky rally waiting to trap late bulls? Read this before making your next move!
💎#ENAUSDT has recently formed a Change of Character (CHOCH) while leaving behind a supply zone and an imbalance. Currently, we expect an upside correction toward $0.4333 and $0.4507, but this move is likely to be short lived. If the price taps these levels and faces strong resistance expect a sharp rejection, especially with the descending trendline and EMA 50 acting as barriers to bullish momentum. This setup suggests ENA is in a prime position for further downside unless it breaks above the supply zone.
💎If #ENAUSD fails to break the supply zone, a rapid sell-off toward the $0.34 support zone is highly likely. A visible gap imbalance further increases the probability of the price filling the gap before any potential reversal. Volume analysis also shows a clear surge in bearish activity, confirming strong selling pressure in the market.
💎The $0.34 level remains the most crucial support where buyers may attempt to step in. However, if this fails to hold, the next major demand zone sits around $0.30, where a deeper correction could unfold. Until a significant bullish breakout occurs, the risk of further downside remains high.
💎If the price manages to break above the supply zone, it would invalidate the bearish setup and could fuel a stronger rally. However, as long as the descending trendline and EMA 50 continue to hold back bullish momentum, the bearish outlook remains intact.
💎Will ENA hold support or break down further? Drop your thoughts in the comments! Are you positioning yourself for a move, or are you waiting for confirmation? Let’s discuss!
Stay sharp, Paradisers! The market rewards patience, discipline, and strategic thinking. Trade smart.
MyCryptoParadise
iFeel the success🌴

#ENA/USDT#ENA
The price is moving within a descending channel on the 1-hour frame, adhering well to it, and is heading for a strong breakout and retest.
We are experiencing a rebound from the lower boundary of the descending channel, which is support at 0.3530.
We are experiencing a downtrend on the RSI indicator, which is about to break and retest, supporting the upward trend.
We are looking for stability above the 100 Moving Average.
Entry price: 0.3700
First target: 0.3820
Second target: 0.3950
Third target: 0.4118

Bearish Outlook for ENA: Potential Downward TrendHello everyone! 👋
I hope you're all doing well. I wanted to share my thoughts on ENA and provide my perspective on the current market situation. Here's my outlook:
The price of this coin is exhibiting signs of weakness, suggesting it may face further downward pressure. Recent price action has broken through key support levels, while momentum indicators are pointing to a continuation of the prevailing downtrend.
If the broader market sentiment remains negative, we could see further declines toward the next major support zones. While potential rebounds are always a possibility, the overall trend currently appears to favor the bears.
Stay vigilant and manage your risk accordingly.
Best regards! BINANCE:ENAUSDT

ENA/USDT: 100% PROFIT POTENTIAL TRADE SETUP!!🚀 Hey Traders! ENA Breakout Alert – 100% Move Incoming? 👀🔥
If you’re excited for this setup, smash that 👍 and hit Follow for premium trade ideas that actually deliver! 💹🔥
🔥 ENA/USDT – Breakout & Retest in Play! 🚀
ENA has broken out of a falling wedge and is now retesting the breakout level. With momentum building, it looks poised for a massive 90-100% upside move from here! 💥
💰 Trade Setup:
📍 Entry: CMP, add more up to $0.36
🎯 Targets: $0.46 / $0.58 / $0.66 / $0.77
🛑 Stop-Loss: $0.325
⚡ Leverage: Low (Max 5x)
🔎 Strategy:
Enter with low leverage now
Add more on dips and ride the breakout momentum higher 🚀
💬 What’s Your Take?
Are you bullish on ENA’s potential for a 100% move? Share your analysis, predictions, and strategies in the comments! Let’s crush it together and lock in those gains! 💰🚀🔥

ENA...Hello friends
Given that the price has reached the bottom of the range, which is also a good support area, we can enter the trade with risk and capital management.
*Trade safely with us*

$ENA LTF Resistance to FlipENA | 4H
If we can flip its local resistance $0.40, we can see it pulls back up retesting the equilibrium $0.47 to $0.52
Local support is around $0.35-$0.32

Breaking: Ethena ($ENA) Surged 21% Today- What Next?The synthetic dollar protocol built on Ethereum that will provide a crypto-native solution for money that is not reliant on traditional banking system infrastructure, alongside a globally accessible dollar-denominated savings instrument native token Ethena ( MIL:ENA ), saw its price surge by a whooping 21% today amidst the three white crow pattern that appeared on the daily price chart hinting at increased buying pressure.
Ethena, weeks back was down losing almost half of value, bulls took advantage of the dip and capitalize on the oversold nature of MIL:ENA , presently placing the RSI at 58 which is neither overbought nor oversold but hints at a continuous buying pressure.
In the case of a market pull back, MIL:ENA might find support in the 78.6% fib retracement level, similarly, a break above the 1-month high could pave way for a new resistance point with massive influx of buyers in the long term.
Ethena Price Live Data
The live Ethena price today is $0.439498 USD with a 24-hour trading volume of $758,695,169 USD. We update our ENA to USD price in real-time. Ethena is up 16.02% in the last 24 hours, with a live market cap of $1,416,695,330 USD. It has a circulating supply of 3,223,437,500 ENA coins and the max. supply is not available.

Ethena Getting Closer To Bullish BreakoutThis is a short-term chart setup for Ethena (ENAUSDT). Support is being tested and this can lead to a higher low. A higher low can lead to the resumption of the bullish trend. The bullish trend started with the early September 2024 low.
Volume is good. The way the candles are becoming stronger as the action enters the support zone is also a bullish signal. The consolidation is similar to mid-October/late November 2024.
I am sure we will see a price advance next. This is short-term, but the action can easily go beyond all targets shown on the chart. There will be strong bullish action later this month and even stronger in April and May, that's why the targets will be easy to conquer.
We are witnessing the calm before a bullish storm. The bearish action is over and was really strong. ENAUSDT was bearish between December 2024 and March 2025. It is time for some change.
Thank you for reading.
Enjoy the profits as they come.
We are getting closer by the hour...
Namaste.

ENAUSDT 2DENA ~ 2D Analysis
#ENA Buy gradually from here if you still have a Conviction on this Coin with a minimum target of 20%+.

ENAUSDT 1H LONG (All Tsrgets Done)ENA LONG performed excellently according to all expectations and met all target marks from the provided review
Congratulations to everyone who took part in this position.
Basic review:
Update:
ENA Rebuy Setup (1D)The ENA structure has been bearish for a while. Given its significant drop and the upcoming support zones, we have identified two potential entry points for this asset. The target is marked on the chart.
A daily candle closing below the invalidation level will invalidate this analysis.
Do not enter the position without capital management and stop setting
Comment if you have any questions
thank you

ENAUSDT 1H LONG (UPdate/Results)Due to the arrival of new variables from the market , key targets and entry were be changed. A similar situation was carried out on the LTC coin (in the previous review)
The price delivery range reached the daily POI and was maintained due to large limit purchases. A long position was opened from this range with the target at the CHoCH level
The position from the main review becomes no longer relevant:

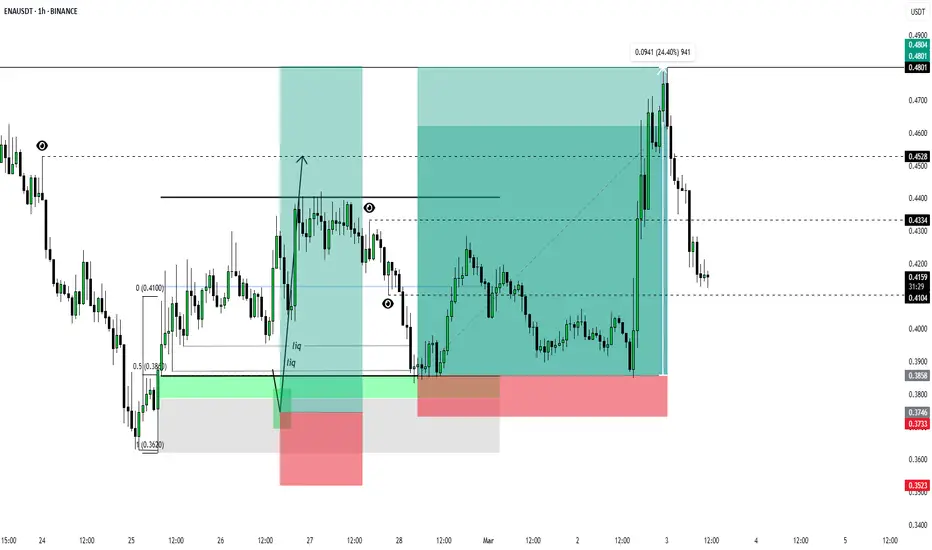
ENAUSDT 1H LONGENA looks cheerful and even very good. Taking into account the situation on the cryptocurrency, this trading instrument remains positive, both fundamental and market.
Rebalancing FGV and retest OB (bullish inefficiency) can create good conditions for finding a long setup.
An example of work is shown on the trading chart
Targets:
- $0.4300
- $0.4528
- $0.4801
Risk management - 1% on stop order

#ENA/USDT#ENA
The price is moving in a descending channel on the 1-hour frame and is expected to continue upwards
We have a trend to stabilize above the moving average 100 again
We have a descending trend on the RSI indicator that supports the rise by breaking it upwards
We have a support area at the lower limit of the channel at a price of 0.3880
Entry price 0.4480
First target 0.4870
Second target 0.5224
Third target 0.5700

ENA at Support – Is Ethena Still Alive?📉 ENA at Support – Is Ethena Still Alive?
ENA is hovering around key support, and traders are watching closely. With Ethena's synthetic dollar (USDe) promising yields and major backers like Binance Labs, Fidelity, and Wintermute, the project still has institutional weight. But with the current downtrend, the question remains: Is ENA set for a bounce, or is confidence fading?
📌 Current Market Stats (From CoinMarketCap):
🔹 Price: $0.4139 (-7.56%)
🔹 Market Cap: $1.29B
🔹 Trading Volume: $192.93M (High liquidity)
🔹 ATH: $1.52 (-72% from peak)
📉 Key Levels to Watch:
🟢 Support Zone: $0.40 - $0.35 → Holding here could trigger a bounce
🔴 Break Below: $0.30 → Potential deeper sell-off
🚀 Upside Target: $1.10 resistance if bulls step in
💡 Is Ethena Still Alive?
Strong Backing: Big-name investors are still involved
High TVL ($6.7B) shows capital is locked in
Market sentiment is shaky, but its synthetic dollar (USDe) is gaining adoption
🔮 Verdict?
ENA looks oversold, and if support holds, a short-term reversal is possible. But if this level fails, expect further downside.
💬 What’s your take? Is this an opportunity or a trap? Let me know your thoughts below!
One Love,
The FXPROFESSOR 💙

ENA/USDTHey guys
Considering the fall of this currency, in the event of a further fall, which is not expected, it is possible to buy step by step with risk and capital management in the three specified support areas and move to the specified goals...
*Trade safely with us*

ENA is looking bullish on macro timeframes!It looks like we've completed Wave 2 of our subminuette degree, and I'm anticipating a parabolic pump toward $8, aligning with our trend-based Fibonacci targets.
