Ethena Bullish Momentum Builds, Eyes 30% Rally to $0.85Hello✌
Let’s analyze Ethena’s upcoming price potential 📈.
BINANCE:ENAUSDT has demonstrated strong bullish momentum recently, supported by positive fundamental developments 📈. The price is currently near key daily and Fibonacci support levels. If these hold, a potential 30% upside targeting $0.85 looks likely 🚀.
✨We put love into every post!
Your support inspires us 💛 Drop a comment we’d love to hear from you! Thanks , Mad Whale
ENAUSD

ENA / USDT#ENA / USDT
Iam expecting big returns from ETH and its related coins in this season
This chart is also looking good
Another Potential round bottom pattern under formation
Keep an eye

Long-Term Technical Analysis of ENA CoinENA coin continues its downward movement after being rejected from the $0.70 resistance level. As long as ENA holds above the 4H support level at $0.5549 with confirmed 4-hour candle closes, it is likely to attempt a rebound toward the weekly resistance zone (marked in blue).
However, if ENA loses the $0.5549 support level and closes multiple 4H candles below it, further downside momentum is expected. In such a scenario, the initial downside target would be $0.4611.
For long-term spot investments in ENA, the price range between $0.3952 and $0.3781 should be closely monitored by investors.
Our plan is to accumulate ENA coin within the $0.3952 – $0.3781 support range for long-term spot positions. If the price reaches this zone, our target will be set at $1.
Not Financial Advice (NFA).

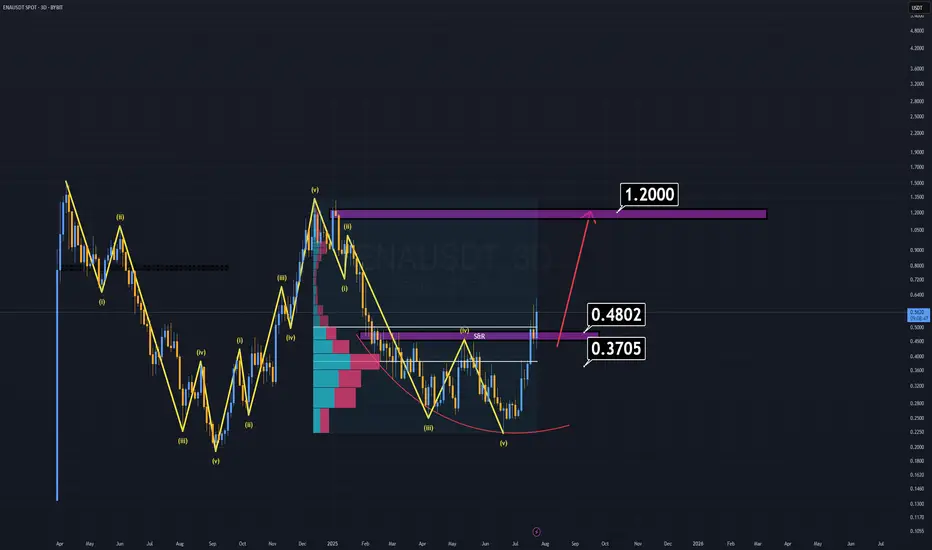
ENA Analysis (3D)ENA has been outperforming many altcoins for weeks, yet it still appears undervalued based on its fundamentals and recent investor interest.
Where to buy?
Right now, buying at current levels is extremely risky, as the ideal buy-back zones are significantly below the market price.
First major support: $0.48 — considered a "cheap" entry.
Dream entry (low probability): $0.37–$0.38 — at that point, ENA would feel almost free.
Notably, BlackRock and its partners are actively investing in ENA, which speaks volumes about its long-term credibility. That alone justifies keeping it on your radar.
Minimum target: $1.00–$1.20
Remember, that’s just the beginning. We may see even more once momentum kicks in.
Sometimes, the best trade is the one you're waiting for.
Good luck.
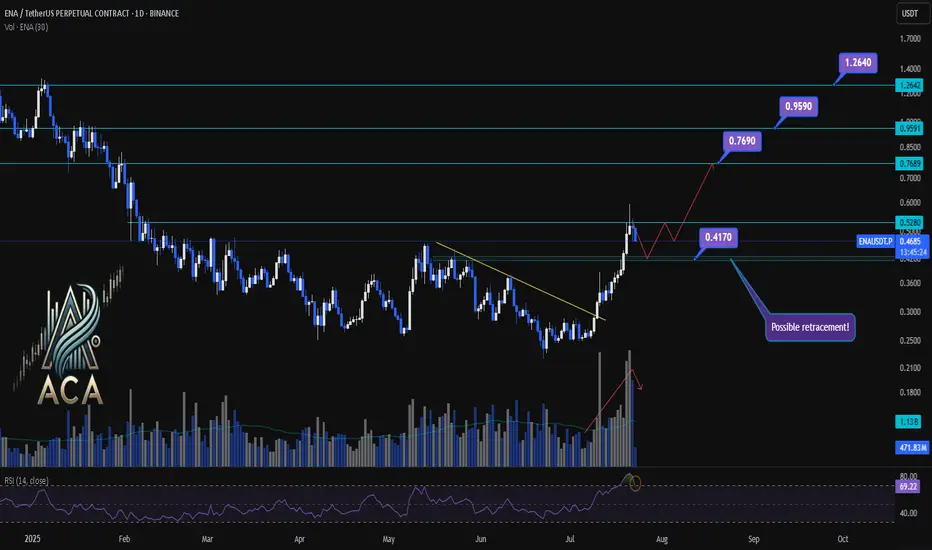
ENA/USDT Chart Analysis | Volatility Signals & Bullish TriggersENA/USDT Chart Analysis | Volatility Signals & Bullish Triggers
🔍 Let’s dive into the ENA/USDT perpetual contract and analyze recent price action, focusing on momentum shifts and key breakout scenarios.
⏳ Daily Overview
The daily chart shows that ENA recently reentered the overbought zone on the RSI, which can serve as a potential trigger for traders watching momentum shifts. Earlier, price action broke decisively above a long-standing descending trendline, resulting in a rapid, nearly 100% surge, a classic RR2 move off the trendline. This breakout coincided with a visible uptick in trading volume, confirming strong demand behind the move.
Now, during the ensuing rest or correction phase, trading volume is decreasing—often a constructive sign suggesting either profit-taking or a healthy pullback rather than panic selling.
🔺 Bullish Trigger & Setup:
- RSI Signal: Reentry into the RSI overbought zone is a potential long trigger, especially if confirmed by price action.
- Confirmation Level: A daily close with strong volume above $0.528 would add conviction to a bullish setup.
- Trendline Reference: The break above the recent trendline fueled the rapid advance, showing the importance of watching such key resistance levels.
📊 Key Targets (on further bullish confirmation):
- $0.769 — First upside resistance.
- $0.959 — Next bullish target.
- $1.264 — Extension target if momentum continues and broader market sentiment remains supportive.
🚨 Conclusion:
Eyes are on the $0.528 level—closing above it with volume, especially while RSI holds in the overbought zone, could provide the next strong entry signal. Current declining volume during pullbacks suggests this is likely a profit-taking phase or standard correction, not bearish capitulation. Keep monitoring RSI, volume profile, and price closes for the next actionable opportunity.
ENA/USDT Breakout Watch Signs of Reversal from a Key Demand Zone🔍 Full Technical Analysis:
ENA/USDT has been forming a Descending Triangle pattern since the December 2024 high — a structure often seen in continuation moves, but here it may act as a potential reversal pattern, especially since price is consolidating around a strong historical demand zone.
The price is hovering within a key support area between $0.1940–$0.2624, which has repeatedly held against bearish pressure. Recent candles are showing signs of accumulation, indicating possible base formation before a breakout.
✅ Bullish Scenario (Breakout Setup):
If the price successfully:
1. Breaks above the descending trendline (yellow line), and
2. Confirms with a breakout above the $0.28–$0.30 zone with strong volume,
We could see a powerful bullish reversal with the following upside targets:
📈 Target 1: $0.3720
📈 Target 2: $0.4569 – breakout structure confirmation
📈 Target 3: $0.6540 – prior resistance zone
📈 Target 4: $0.7702
📈 Target 5: $0.8928
💥 Extended Targets: $1.2512 – $1.3300 (Major High from December 2024)
🚨 A clean breakout from this setup may trigger major FOMO and offer multi-level swing trading opportunities.
❌ Bearish Scenario (Breakdown Risk):
If the downtrend continues and:
The price fails to break above the trendline, and
Breaks below $0.1940, which is the historical low support,
Then the door opens for further downside towards: 🔻 Bearish Target: $0.1600 or lower
⚠️ A confirmed breakdown below this key zone would suggest trend continuation and weakness in buyer interest.
🧠 Strategic Summary:
Strong Demand Zone + Historical Support suggest high probability of trend reversal.
Descending Triangle offers a textbook breakout opportunity with favorable risk-reward.
High RR potential makes this setup ideal for swing traders and mid-term investors.
💡 Success tip: Wait for breakout confirmation and volume spike before entering.
#ENAUSDT #CryptoBreakout #DescendingTriangle #BullishReversal #AltcoinSetup #CryptoTrading #SwingTrade #TechnicalAnalysis #ChartPatterns #SupportAndResistance

ENA : The largest token release...Hello dears
Given the long-term price decline that we have witnessed, it has now been announced that this currency is going to do a token release, which will naturally cause the price to fall, so be careful.
In case of a fall, we have identified important supports for you so that you can buy with risk and capital management.
The target has also been identified.
*Trade safely with us*

ENA Long / Buy Swing SetupENA Looking Good here, daily closing above 1st tp guaranteed tp 2. Ena can be the next SUI, Ondo. Below 0.31$ buying is a good choice and hold till 1st and then 2nd tp. While for the long term investors it has the potential to hit 2-3$ mark.

ENAUSDT Long / Buy SetupOn lower tf ena showing bullish momentum, while previous setups went bad due to war, but ena still holding the previous marked area, this is a short term setup not long term, still expecting another low for whole market. Will share swing setups if found strong momentum. Must use SL as btc as it's peak.

ENAUSDT 1D Analysis ENA ~ 1D Analysis
#ENA Buy back gradually from here if you still have confidence in this coin with a short term target of at least 15%+ from here.

ENA About to Explode or Dump? Key Levels You Can’t Ignore!Yello Paradisers — are you positioned right for the next potential explosion in #ENA, or will you get caught on the wrong side of the move like most retail traders? After a brutal grind in a descending channel, something big is brewing... and it’s coming faster than many realize. Let's dive in.
💎#ENAUSDT currently facing a key resistance at the upper boundary of the descending channel, clearly tested multiple times and respected well by the market structure. A candle close above this channel would trigger a confirmed breakout, which opens up a clean path for continued upside movement — the next major target sits at the resistance zone between 0.446 and 0.4725.
💎There’s a high-probability alternative setup unfolding as well: ENA holding the S/R level around 0.3448 and the demand zone below, which aligns perfectly with the multi-timeframe EMA support. If this area holds strong, expect another impulse move toward our resistance zone as momentum builds.
💎Price had been forming lower highs and lower lows, respecting the downtrend But recently we observed a Clear Change of Character (ChoCH) — ENA broke market structure by forming a higher high.What usually follows? A higher low, and that’s where we are now.
💎The most probable scenario is for price to pull back to the S/R level or dip into the demand zone, and then form a higher low before making the next leg upward toward resistance.
💎Invalidation is simple and must be respected: if we see a confirmed candle close below 0.2798, then the bullish case breaks and the setup is no longer valid. This is where you must cut quickly, avoid hope-trading, and reassess the structure from scratch.
Don’t chase. Don’t panic. React with strategy, not emotion. This is how real professionals win in crypto. Stay sharp, Paradisers.
MyCryptoParadise
iFeel the success🌴

ENAUSDT 1D Analysis ENA ~ 1D Analysis
#ENA Buy after successfully breaking this resistance line with a short term target of at least 15%+, Long term target $1.3

#ENA/USDT#ENA
The price is moving within a descending channel on the 1-hour frame, adhering well to it, and is heading for a strong breakout and retest.
We are experiencing a rebound from the lower boundary of the descending channel, which is support at 0.3700.
We are experiencing a downtrend on the RSI indicator, which is about to break and retest, supporting the upward trend.
We are looking for stability above the 100 Moving Average.
Entry price: 0.3911
First target: 0.4100
Second target: 0.4235
Third target: 0.4410

ENAUSDT 1D AnalysisENA ~ 1D Analysis
#ENA Buy after successfully breaking through this resistance line with a short-term target of at least 15%++ and a long-term target of $1.33

ENAUSD: Strong bullish wave startingEthena is neutral on its 1D technical outlook (RSI = 52.271, MACD = 0.053, ADX = 32.166) as it's trading between the 1D MA200 and 1D MA50. The last time a rebound was supported by the 1D MA50, was in October 2024 and was the start of a Channel Up to the top of the Rectangle. Go long and TP = 1.3000.
## If you like our free content follow our profile to get more daily ideas. ##
## Comments and likes are greatly appreciated. ##

Sensitive supportHello friends
Considering the good growth we had, you can see that the price has corrected after reaching its ceiling and has reached a sensitive support.
Now, with the price correction, there is a good opportunity to buy in stages and with capital management and move towards the specified goals.
*Trade safely with us*

ENA is repeating a bullish fractal (1D)Look at the red, white, yellow, and green boxes in order, and then pay attention to the white trigger lines. You’ll notice that the previous phases | the end of the bearish trend (red box), followed by a bullish move for breakout (white box), then a pullback (yellow box), and finally the main bullish move (green box) | are now repeating.
Also, the price is currently sitting within the trading range marked by the two green lines, which is a key area. After the pullback is completed, a bullish wave is expected to begin, potentially reaching at least around the previous all-time high (ATH).
For risk management, please don't forget stop loss and capital management
Comment if you have any questions
Thank You
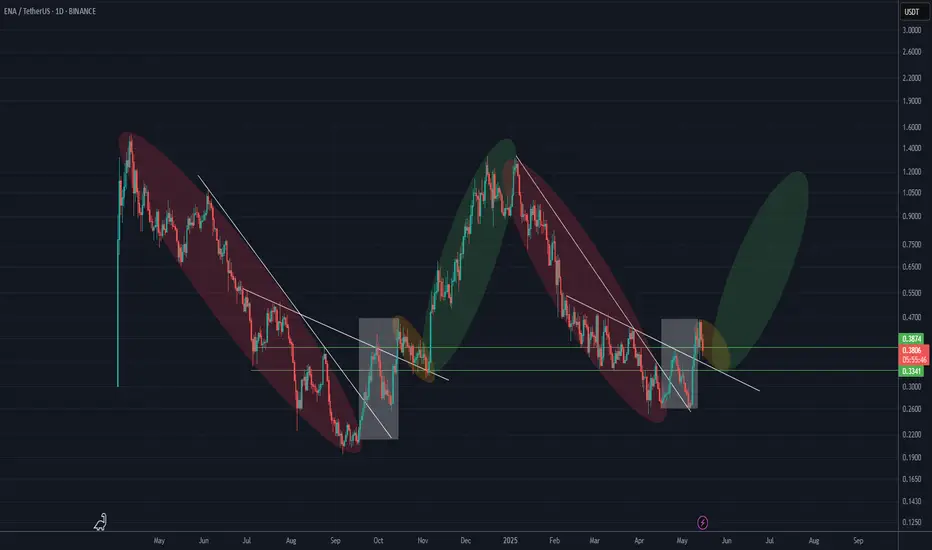
Breakout trading possible range: 0.4140-0.4424
Hello, traders.
If you "Follow", you can always get new information quickly.
Have a nice day today.
-------------------------------------
(ENAUSDT 1D chart)
The key is whether it can break through the 0.4140-0.4424 range and rise.
It is expected that breakout trading will be possible if the 0.4140-0.4424 range breaks through.
However, it is judged that it is possible to lead to additional rise only if it rises above 0.5082 at once and maintains the price.
Therefore, if breakout trading was not possible, trading is possible if support is confirmed near 0.4140-0.4424.
-
If it rises above 0.5082 and is supported, there is a possibility that it will rise significantly as there is no special resistance zone.
In other words, it seems possible that it will break through 0.7907 and 1.0382.
-
Thank you for reading to the end.
I hope you have a successful trade.
--------------------------------------------------
- Here is an explanation of the big picture.
I used TradingView's INDEX chart to check the entire range of BTC.
I rewrote it to update the previous chart while touching the Fibonacci ratio range of 1.902 (101875.70) ~ 2 (106275.10).
(Previous BTCUSD 12M chart)
Looking at the big picture, it seems that it has been maintaining an upward trend following a pattern since 2015.
That is, it is a pattern that maintains a 3-year uptrend and faces a 1-year downtrend.
Accordingly, the uptrend is expected to continue until 2025.
-
(Current BTCUSD 12M chart)
Based on the currently written Fibonacci ratio, it is displayed up to 3.618 (178910.15).
It is expected that it will not fall again below the Fibonacci ratio of 0.618 (44234.54).
(BTCUSDT 12M chart)
Based on the BTCUSDT chart, I think it is around 42283.58.
-
I will explain it again with the BTCUSD chart.
The Fibonacci ratio ranges marked in the green boxes, 1.902 (101875.70) ~ 2 (106275.10) and 3 (151166.97) ~ 3.14 (157451.83), are expected to be important support and resistance ranges.
In other words, it seems likely that they will act as volume profile ranges.
Therefore, in order to break through these ranges upward, I think the point to watch is whether they can receive support and rise near the Fibonacci ratios of 1.618 (89126.41) and 2.618 (134018.28).
Therefore, the maximum rising range in 2025 is expected to be the 3 (151166.97) ~ 3.14 (157451.83) range.
In order to do that, we need to see if it is supported and rises near 2.618 (134018.28).
If it falls after the bull market in 2025, we don't know how far it will fall, but based on the previous decline, we expect it to fall by about -60% to -70%.
Therefore, if it starts to fall near the Fibonacci ratio 3.14 (157451.83), it seems likely that it will fall to around Fibonacci 0.618 (44234.54).
I will explain more details when the bear market starts.
------------------------------------------------------

ENA is standing at a classic “make-or-break base-build” juncture
🕞 60-Second Read
Trend on the 1-D chart is still structurally bearish , yet price (spot 0.350 USDT) just printed a higher-low off the April wick and reclaimed the mid-channel line. Two large upside voids are now in play.
Hot-Zone #1 – 0.292 (15 m imbalance): fresh demand, 17 % under spot.
Hot-Zone #2 – 0.496 (3 MP-High retest): range cap & first breaker, 42 % above.
Hot-Zone #3 – 0.836 → 0.892 (Feb pivot ↔ Yearly EC): macro supply shelf.
🎲 Probability Dashboard
HTF Trend & Structure – -2
Liquidity Map (voids above) – +1
Momentum (vector flips) – +1
Derivatives (funding ≈ flat) – 0
Net Score = 0
Bear / Neutral / Bull odds ≈ 40 % / 30 % / 30 %
📈 Trade Playbook
Strategy 1
1. Layered Limit Grid – Aggressive Counter-Trend Long
Entry layers (size %):
0.300 – 25 % of your allocated ENAUSDT size
0.280 – 35 %
0.260 – 25 %
0.240 – 15 %
SL = 0.215
TP ladder:
0.350 – 20 % off-load
0.496 – 25 %
0.836 – 30 %
1.040 – 25 %
Weighted R:R ≈ 7.3
Strategy 2
2. Layered Limit Grid – Conservative Breakout Long
Trigger: daily close > 0.496, then place grid orders.
Entry layers (size %):
0.510 – 40 %
0.570 – 30 %
0.650 – 20 %
0.836 – 10 %
SL = 0.440
TP ladder:
0.836 – 30 %
1.040 – 30 %
1.516 – 25 %
1.550 – 15 %
Weighted R:R ≈ 4.8
Setup Logic
Price reclaimed mid-channel but remains inside a 69 % upside void to 0.836.
Stacked un-retested highs (0.496 / 0.836 / 1.040) act as magnetic targets.
Yearly S1 (0.220) converges with vector zone support – ideal invalidation.
Risk Radar
Perp OI up 18 % WoW – a funding spike could squeeze late longs.
Two token unlocks (2 & 5 May) add ≥ 200 M ENA supply.
Macro: FOMC (1 May) & BTC flow volatility may spill into alts.
ENA must flip 0.496 to sprint through the 0.84-1.04 air-pocket; fail that and liquidity magnets at 0.30 → 0.22 take the wheel. Trade the grid – not the hopium.
(Not financial advice – always do your own research.)

ENAUSDT 1DENA ~ 1D Analysis
#ENA The main support that you might be able to consider to start buying back from here with a short -term target of at least 10%+ from here.

ENAUSDT 2DENA ~ 2D Analysis
#ENA Buy gradually after re -testing this support with a short -term target of at least 15%+ from here.

ENA Possible Head and ShouldersENA might be forming an head and shoulders formation which could cause a significant drop in value.
Be careful if the level of 0.34 breaks. It's also a great short opportunity.
Thanks for reading.

ENA About to Collapse or One Last Rally Before the Fall?Yello, Paradisers! Is ENA about to crash hard, or is a sneaky rally waiting to trap late bulls? Read this before making your next move!
💎#ENAUSDT has recently formed a Change of Character (CHOCH) while leaving behind a supply zone and an imbalance. Currently, we expect an upside correction toward $0.4333 and $0.4507, but this move is likely to be short lived. If the price taps these levels and faces strong resistance expect a sharp rejection, especially with the descending trendline and EMA 50 acting as barriers to bullish momentum. This setup suggests ENA is in a prime position for further downside unless it breaks above the supply zone.
💎If #ENAUSD fails to break the supply zone, a rapid sell-off toward the $0.34 support zone is highly likely. A visible gap imbalance further increases the probability of the price filling the gap before any potential reversal. Volume analysis also shows a clear surge in bearish activity, confirming strong selling pressure in the market.
💎The $0.34 level remains the most crucial support where buyers may attempt to step in. However, if this fails to hold, the next major demand zone sits around $0.30, where a deeper correction could unfold. Until a significant bullish breakout occurs, the risk of further downside remains high.
💎If the price manages to break above the supply zone, it would invalidate the bearish setup and could fuel a stronger rally. However, as long as the descending trendline and EMA 50 continue to hold back bullish momentum, the bearish outlook remains intact.
💎Will ENA hold support or break down further? Drop your thoughts in the comments! Are you positioning yourself for a move, or are you waiting for confirmation? Let’s discuss!
Stay sharp, Paradisers! The market rewards patience, discipline, and strategic thinking. Trade smart.
MyCryptoParadise
iFeel the success🌴
