Bearish Outlook for ENA: Potential Downward TrendHello everyone! 👋
I hope you're all doing well. I wanted to share my thoughts on ENA and provide my perspective on the current market situation. Here's my outlook:
The price of this coin is exhibiting signs of weakness, suggesting it may face further downward pressure. Recent price action has broken through key support levels, while momentum indicators are pointing to a continuation of the prevailing downtrend.
If the broader market sentiment remains negative, we could see further declines toward the next major support zones. While potential rebounds are always a possibility, the overall trend currently appears to favor the bears.
Stay vigilant and manage your risk accordingly.
Best regards! BINANCE:ENAUSDT
ENAUSDT

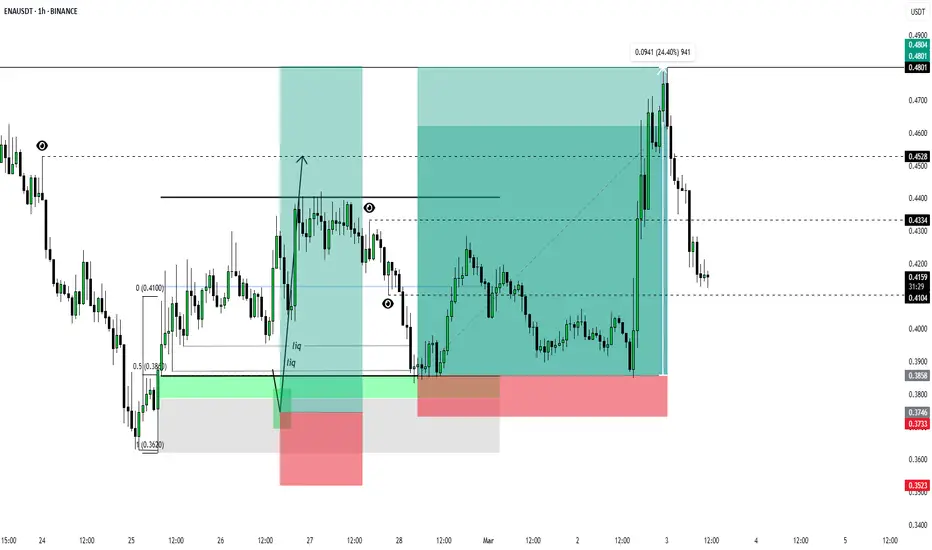
ENA/USDT Analysis: A great opportunity for a speculative longThis asset has broken an important sell zone and consolidated above it, forming a strong volume zone below at $0.415-$0.408. On a retest of this zone, we will monitor the reaction. If confirmation appears, we open a long position with the potential to break above the $0.48 level.

FireHoseReel | $ENA AnalysisWelcome to FireHoseReel!
Weekly Timeframe
BINANCE:ENAUSDT coin is currently at its strong demand zone on the weekly time frame, and it could potentially experience a pump from this area.
Let's check the lower time frames as well to find the best entry point!
Daily Timeframe
On the daily time frame, we have refined the weekly zone.
The price is currently at this zone, and there is significant liquidity to place targets, including liquidity voids and highs.
We also expect the start of the price's substructure phase on the daily time frame and the start of the minor phase on the weekly time frame.
4H Timeframe
On the 4-hour time frame, we are looking for our entry.
We have a demand zone where the price has reversed and turned bullish(CH).This zone also has a lot of liquidity above it, which serves as confirmation for our zone.
This zone will be a good entry point for a long trade.
Our target will be 0.5$ then 0.75$.

ENA/USDT: 100% PROFIT POTENTIAL TRADE SETUP!!🚀 Hey Traders! ENA Breakout Alert – 100% Move Incoming? 👀🔥
If you’re excited for this setup, smash that 👍 and hit Follow for premium trade ideas that actually deliver! 💹🔥
🔥 ENA/USDT – Breakout & Retest in Play! 🚀
ENA has broken out of a falling wedge and is now retesting the breakout level. With momentum building, it looks poised for a massive 90-100% upside move from here! 💥
💰 Trade Setup:
📍 Entry: CMP, add more up to $0.36
🎯 Targets: $0.46 / $0.58 / $0.66 / $0.77
🛑 Stop-Loss: $0.325
⚡ Leverage: Low (Max 5x)
🔎 Strategy:
Enter with low leverage now
Add more on dips and ride the breakout momentum higher 🚀
💬 What’s Your Take?
Are you bullish on ENA’s potential for a 100% move? Share your analysis, predictions, and strategies in the comments! Let’s crush it together and lock in those gains! 💰🚀🔥

ENA...Hello friends
Given that the price has reached the bottom of the range, which is also a good support area, we can enter the trade with risk and capital management.
*Trade safely with us*

Phemex Analysis #68: Is It A Good Time to Buy Ethena (ENA) Now?!Ethena has rapidly ascended in the decentralized finance (DeFi) sector, notably propelling its stablecoin, USDe, to become the world's largest by market capitalization within a year. In December 2024, Ethena Labs introduced USDtB, a stablecoin backed by BlackRock's tokenized money market fund, BUIDL, aimed at stabilizing USDe during bearish crypto market phases. More recently, a proposal has been put forward to integrate Ethereal, a decentralized exchange (DEX), into Ethena's reserve management system. This integration seeks to enhance trading capabilities for USDe and distribute governance tokens to ENA holders, further enriching the ecosystem.
Despite these fundamental advancements, ENA's price has experienced significant volatility. After reaching a high of $1.32, the token's value declined by approximately 75%, hitting a low of $0.33. However, the downward momentum has recently slowed, coinciding with a broader market recovery. This shift has led many to question whether now is an opportune time to invest in ENA, especially considering its substantial real-world developments.
Potential Scenarios
1. Continued Downtrend
If ENA fails to maintain current support levels at $0.316, it could test lower price points. Factors such as broader market downturns or negative investor sentiment could exacerbate this decline.
Pro Tips:
Short Positions: Experienced traders might consider short-selling strategies to capitalize on potential declines, especially if the price drops below $0.316 with high volume.
Buying at Support Levels: Long-term investors may consider accumulating ENA gradually near established support levels such as $0.26 and $0.20.
2. Consolidation Phase
ENA may enter a consolidation phase, trading within a defined range as the market seeks direction. This period of sideways movement could last until new catalysts emerge.
Pro Tips:
Range Trading: Identify key support ($0.316) and resistance levels ($0.48) to execute buy and sell orders effectively within the trading range.
Patience: Avoid overtrading during consolidation; wait for clear signals before making significant moves.
3. Bullish Reversal
Given ENA's recent positive developments and technical indicators, there is potential for a bullish reversal. Sustaining levels above recent resistance points could signal renewed investor confidence and an upward trend.
Pro Tips:
Breakout Entry: If the price breaks above the $0.40 resistance level with high volume, consider a long position with profit targets at $0.48, $0.54, and $0.70.
Accumulate Gradually: Consider dollar-cost averaging to build a position without exposing yourself to immediate market volatility.
Conclusion
Deciding to invest in ENA requires careful consideration of these scenarios. By employing strategic approaches tailored to each potential outcome, traders can better navigate the complexities of the cryptocurrency market. As always, thorough research and prudent risk management are essential when making investment decisions.
Tips:
🔥 Break free from "buy low, sell high"! Our new Pilot Contract empowers you to profit from ANY market direction on DEX coins with up to 3x leverage. Go long, go short, go further!
Check out Phemex - Pilot Contract today!
Disclaimer: This is NOT financial or investment advice. Please conduct your own research (DYOR). Phemex is not responsible, directly or indirectly, for any damage or loss incurred or claimed to be caused by or in association with the use of or reliance on any content, goods, or services mentioned in this article.

$ENA LTF Resistance to FlipENA | 4H
If we can flip its local resistance $0.40, we can see it pulls back up retesting the equilibrium $0.47 to $0.52
Local support is around $0.35-$0.32

TradeCityPro | ENAUSDT Ready to Go!👋 Welcome to the TradeCityPro channel!
Let's go together to analyze and review one of my favorite coins and DeFi coins that we are likely to have and experience a movement in the coming days
🌐 Overview Bitcoin
Before starting the analysis, I want to remind you again that we moved the Bitcoin analysis section from the analysis section to a separate analysis at your request, so that we can discuss the status of Bitcoin in more detail every day and analyze its charts and dominances together.
This is the general analysis of Bitcoin dominance, which we promised you in the analysis to analyze separately and analyze it for you in longer time frames.
📊 Weekly Timeframe
On the weekly time frame, after we hit the 1.2788 level, which was our ATH, we got rejected from it and engulfed the previous weekly candle.
This was also an exit point or a take profit for us, and after this, it is very logical to withdraw some of our capital, and the reason is that the buyers could not do anything and push the price above this level!
📈 Daily Timeframe
On the daily time frame, but after we followed a parabolic move and its slope reached the end of the road, we were rejected by the important resistance of 1.2788
This rejection caused our parabolic move to end and after its failure, we went for an upward move again, but we were rejected by the resistance and went for the support of 0.7857
After the failure of this support and the pullback to it, we went for a rejection again from this resistance and are currently suffering between 0.3282 and 0.4833, with the difference that there is still more presence of sellers for this event
To buy at risk, you can also make a long position at risk after the level of 0.4833 because we can only be active in DeFi and take our coins to DeFi. Now that we are talking about DeFi, you can in this space Also set the liquidity range of the money and we can exit to activate the spot below the level of 0.3282!
📝 Final Thoughts
Stay calm, trade wisely, and let's capture the market's best opportunities!
This analysis reflects our opinions and is not financial advice.
Share your thoughts in the comments, and don’t forget to share this analysis with your friends! ❤️

ENA Breaks Downtrend – Is a Rally Incoming?$ENA/USDT 12H chart shows a breakout above the resistance trendline and the 50 EMA, indicating a potential trend reversal. However, the price is currently facing resistance near the previous support-turned-resistance zone.
A retest of the trendline breakout is possible before further upside. If the price holds above the trendline and reclaims support, it could confirm a bullish continuation.
However, failure to hold may result in a fakeout and further downside.
DYOR, NFA

Breaking: Ethena ($ENA) Surged 21% Today- What Next?The synthetic dollar protocol built on Ethereum that will provide a crypto-native solution for money that is not reliant on traditional banking system infrastructure, alongside a globally accessible dollar-denominated savings instrument native token Ethena ( MIL:ENA ), saw its price surge by a whooping 21% today amidst the three white crow pattern that appeared on the daily price chart hinting at increased buying pressure.
Ethena, weeks back was down losing almost half of value, bulls took advantage of the dip and capitalize on the oversold nature of MIL:ENA , presently placing the RSI at 58 which is neither overbought nor oversold but hints at a continuous buying pressure.
In the case of a market pull back, MIL:ENA might find support in the 78.6% fib retracement level, similarly, a break above the 1-month high could pave way for a new resistance point with massive influx of buyers in the long term.
Ethena Price Live Data
The live Ethena price today is $0.439498 USD with a 24-hour trading volume of $758,695,169 USD. We update our ENA to USD price in real-time. Ethena is up 16.02% in the last 24 hours, with a live market cap of $1,416,695,330 USD. It has a circulating supply of 3,223,437,500 ENA coins and the max. supply is not available.

Ethena Getting Closer To Bullish BreakoutThis is a short-term chart setup for Ethena (ENAUSDT). Support is being tested and this can lead to a higher low. A higher low can lead to the resumption of the bullish trend. The bullish trend started with the early September 2024 low.
Volume is good. The way the candles are becoming stronger as the action enters the support zone is also a bullish signal. The consolidation is similar to mid-October/late November 2024.
I am sure we will see a price advance next. This is short-term, but the action can easily go beyond all targets shown on the chart. There will be strong bullish action later this month and even stronger in April and May, that's why the targets will be easy to conquer.
We are witnessing the calm before a bullish storm. The bearish action is over and was really strong. ENAUSDT was bearish between December 2024 and March 2025. It is time for some change.
Thank you for reading.
Enjoy the profits as they come.
We are getting closer by the hour...
Namaste.

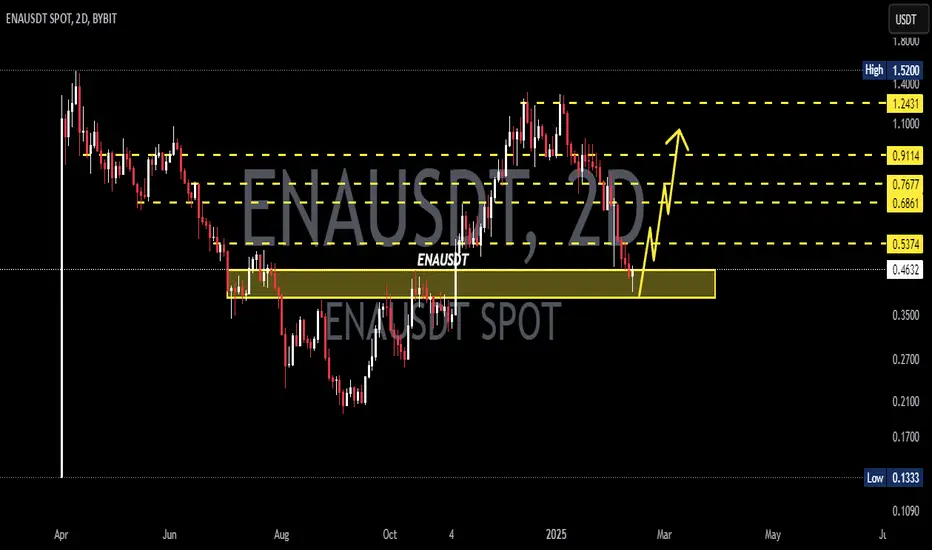
ENAUSDT 2DENA ~ 2D Analysis
#ENA Buy gradually from here if you still have a Conviction on this Coin with a minimum target of 20%+.

ENAUSDT 1H LONG (All Tsrgets Done)ENA LONG performed excellently according to all expectations and met all target marks from the provided review
Congratulations to everyone who took part in this position.
Basic review:
Update:
ENA Rebuy Setup (1D)The ENA structure has been bearish for a while. Given its significant drop and the upcoming support zones, we have identified two potential entry points for this asset. The target is marked on the chart.
A daily candle closing below the invalidation level will invalidate this analysis.
Do not enter the position without capital management and stop setting
Comment if you have any questions
thank you

ENAUSDT 1H LONG (UPdate/Results)Due to the arrival of new variables from the market , key targets and entry were be changed. A similar situation was carried out on the LTC coin (in the previous review)
The price delivery range reached the daily POI and was maintained due to large limit purchases. A long position was opened from this range with the target at the CHoCH level
The position from the main review becomes no longer relevant:

ENAUSDT 1H LONGENA looks cheerful and even very good. Taking into account the situation on the cryptocurrency, this trading instrument remains positive, both fundamental and market.
Rebalancing FGV and retest OB (bullish inefficiency) can create good conditions for finding a long setup.
An example of work is shown on the trading chart
Targets:
- $0.4300
- $0.4528
- $0.4801
Risk management - 1% on stop order

#ENA/USDT#ENA
The price is moving in a descending channel on the 1-hour frame and is expected to continue upwards
We have a trend to stabilize above the moving average 100 again
We have a descending trend on the RSI indicator that supports the rise by breaking it upwards
We have a support area at the lower limit of the channel at a price of 0.3880
Entry price 0.4480
First target 0.4870
Second target 0.5224
Third target 0.5700

ENA/USDTHey guys
Considering the fall of this currency, in the event of a further fall, which is not expected, it is possible to buy step by step with risk and capital management in the three specified support areas and move to the specified goals...
*Trade safely with us*

Ena usdtHey guys, this is the ena scenario, where will the decline stop? This is not a trading recommendation, do DYOR before entering

ENAUSDT 2DENA ~ 2D Analysis
#ENA If you still have a Conviction on this Coin, Maybe this support you can consider to start buying back with a minimum target of 15%+.
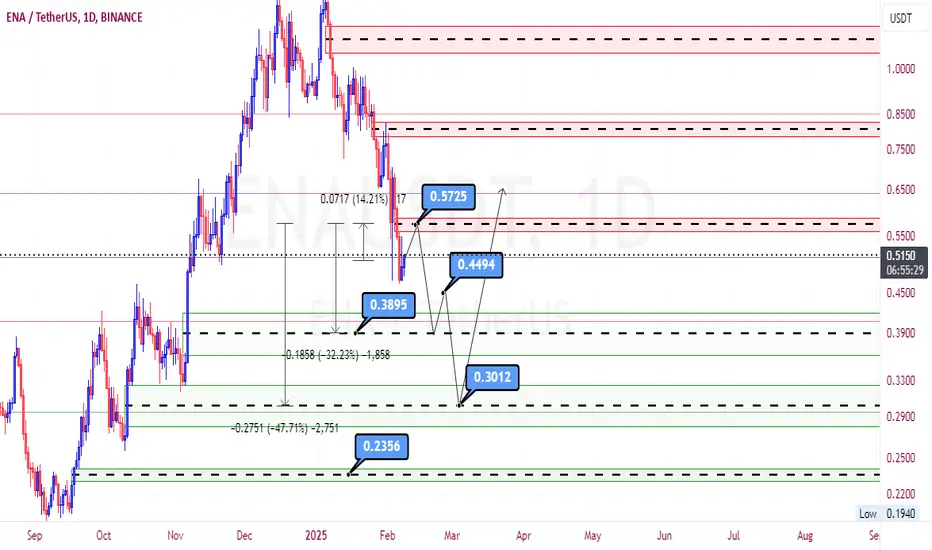
Analysis of currency $ENAIntroduction:
The MIL:ENA token is fundamentally one of the relatively good currencies in the market. Therefore, it can be beneficial for long-term investment. However, buying at these prices is not recommended for the long term, and in the next season of the market, as we enter the cryptocurrency winter, an updated analysis for accumulating this token will be provided. Of course, many fundamental issues in the entire crypto market may undergo unforeseen changes, so discussing the distant future is not very logical.
Short-term analysis:
I strongly believe that in the coming days, the price will reach $0.572, which represents about 14% profit. However, from there, it is likely that the price will be pushed back and revert to lower levels around $0.3895.
Mid-term analysis:
There is a high probability that if the market wants to correct, the price could even see lower levels around $0.3012. I guess the market can be well supported and rise from this price. If a fear atmosphere prevails in the market and negative news for altcoins is presented doubly, reaching a price of $0.2356 is not out of reach.
In my opinion, if you intend to purchase this currency during the upcoming alt season, place your first buy step around $0.3012 and your second buy step around $0.2356. I recommend just these two steps. Buying at higher numbers does not seem logical from my perspective. Also, allocate a larger percentage of your purchase to the second step. It should be noted that this analysis is suited for a trader with a medium risk profile in this market. If you are more optimistic about this market, you can make your purchases at higher levels.
At the end, I would be pleased to receive your valuable comments regarding the price movement in this chart below this analysis.
ENAUSDT – Massive Breakout Incoming? Yello, Paradisers! Are we about to witness a major reversal, or is #ENAUSDT gearing up for another leg down? Let’s break it down before the big move happens!
💎#ENAUSDT has been forming a falling wedge a classic bullish reversal pattern. The price has been consistently rejecting from the descending resistance while finding support at the lower boundary. But here’s the key part: price action is now testing a crucial support zone at $0.4690 an area where buyers have historically stepped in to push the market higher. This could be a major turning point.
💎If bulls take control and we see a breakout above the wedge resistance, it could trigger a strong rally. The first major target sits in the $0.8229–$0.8794 range, followed by a key resistance zone near $1.2690. With volume confirmation, this move could accelerate quickly, fueled by short squeezes and renewed bullish momentum.
💎On the flip side, if bulls fail to hold the support and the price breaks below, it could open the door for a deeper correction trapping late buyers and causing further liquidations.
This is not the time for emotional decisions. A big move is coming, but patience is key. Whether it’s a breakout or a breakdown, only a few traders will time it right.
MyCryptoParadise
iFeel the success🌴

Sniper Mode Activated – The Perfect Entry is Coming! Sniper Mode Activated – The Perfect Entry is Coming! 🎯💥
“Look, I know I’m aiming a little lower than most, but that’s what separates the best traders. I don’t chase – I snipe the perfect entry. Precision, patience, and massive profits!”
Here’s the Plan:
Blue Box = BIG Opportunity – If CDV, lower time frame breakouts, and volume profile align, these zones could be incredibly profitable.
Patience is Power – I don’t jump in blindly. I wait for confirmation, for the perfect shot, and then I strike. That’s how pros trade.
Momentum is Key – When the breakout happens, you don’t want to be late. You want to be ahead of the move, positioned for maximum gains.
Final Thoughts:
“I’ve got my eyes on this like a hawk. CDV, volume profile, liquidity heatmap – all must align. No confirmation, no trade. But when the signal comes? We take the shot and win big.”
Good luck, traders – the setup is coming, and it could be massive! 🚀🔥
Let me tell you, this is something special. These insights, these setups—they’re not just good; they’re game-changers. I've spent years refining my approach, and the results speak for themselves. People are always asking, "How do you spot these opportunities?" It’s simple: experience, clarity, and a focus on high-probability moves.
Want to know how I use heatmaps, cumulative volume delta, and volume footprint techniques to find demand zones with precision? I’m happy to share—just send me a message. No cost, no catch. I believe in helping people make smarter decisions.
Here are some of my recent analyses. Each one highlights key opportunities:
🚀 RENDERUSDT: Strategic Support Zones at the Blue Boxes +%45 Reaction
🎯 PUNDIXUSDT: Huge Opportunity | 250% Volume Spike - %60 Reaction Sniper Entry
🌐 CryptoMarkets TOTAL2: Support Zone
🚀 GMTUSDT: %35 FAST REJECTION FROM THE RED BOX
🎯 ZENUSDT.P: Patience & Profitability | %230 Reaction from the Sniper Entry
🎯 DEXEUSDT %180 Reaction with %9 Stop
🐶 DOGEUSDT.P: Next Move
🎨 RENDERUSDT.P: Opportunity of the Month
💎 ETHUSDT.P: Where to Retrace
🟢 BNBUSDT.P: Potential Surge
📊 BTC Dominance: Reaction Zone
🌊 WAVESUSDT.P: Demand Zone Potential
🟣 UNIUSDT.P: Long-Term Trade
🔵 XRPUSDT.P: Entry Zones
🔗 LINKUSDT.P: Follow The River
📈 BTCUSDT.P: Two Key Demand Zones
🟩 POLUSDT: Bullish Momentum
🌟 PENDLEUSDT.P: Where Opportunity Meets Precision
🔥 BTCUSDT.P: Liquidation of Highly Leveraged Longs
🌊 SOLUSDT.P: SOL's Dip - Your Opportunity
🐸 1000PEPEUSDT.P: Prime Bounce Zone Unlocked
🚀 ETHUSDT.P: Set to Explode - Don't Miss This Game Changer
🤖 IQUSDT: Smart Plan
⚡️ PONDUSDT: A Trade Not Taken Is Better Than a Losing One
💼 STMXUSDT: 2 Buying Areas
🐢 TURBOUSDT: Buy Zones and Buyer Presence
🌍 ICPUSDT.P: Massive Upside Potential | Check the Trade Update For Seeing Results
🟠 IDEXUSDT: Spot Buy Area | %26 Profit if You Trade with MSB
📌 USUALUSDT: Buyers Are Active + %70 Profit in Total
🌟 FORTHUSDT: Sniper Entry +%26 Reaction
🐳 QKCUSDT: Sniper Entry +%57 Reaction
📊 BTC.D: Retest of Key Area Highly Likely
This list? It’s just a small piece of what I’ve been working on. There’s so much more. Go check my profile, see the results for yourself. My goal is simple: provide value and help you win. If you’ve got questions, I’ve got answers. Let’s get to work!
