MGY: Technical Breakout + Fundamental Momentum = Quiet Winner?Magnolia Oil & Gas (MGY) is showing one of the cleanest technical breakouts in the energy sector — and the market hasn’t priced it in yet. After months of pressure, price has broken above both the 50-day and 200-day moving averages with rising volume, signaling a clear phase shift from distribution to accumulation. Recent candles confirm control shifting to the buyers, with a tight structure, rising lows, and bullish momentum building underneath resistance.
The fundamentals back the technical setup. In the latest earnings report, MGY delivered a 9.7% revenue increase, $110M in free cash flow, and continues to pay dividends with low leverage. UBS upgraded the stock with a $29 target, which aligns precisely with the post-breakout projection. Operationally, the company is expanding in key U.S. basins like Eagle Ford, while seeing growing demand from Australia and Latin America.
With oil prices pushing higher and geopolitical tensions rising, MGY stands out as a stable energy play in a volatile world. Holding above the $24.00–$24.30 zone keeps the breakout valid, with $29+ as a natural magnet for price. Most investors are still asleep on this name — but the structure is already telling a very different story.
Energy Commodities

PLAINS - LONG TERM BUY OPPORTUNITY FOR 25%+ GAINSPLAINS ALL AMERICAN PIPELINE, L.P. (PAA) has been recovering from all-time lows at $3.00 per share in 2020 with a nice upward channel forming over the past 5 years. Expect some choppy price movements around $20.00 per share but once price breaks above, the next price target is $30.00 per share over the next few years. With uncertainty and war in the middle east, oil and oil stocks can be considered great investments, especially when the U.S. decides to invest more in producing oil domestically. Don't be surprised if the rise moves faster than anticipated if more uncertainty arises in the middle east.

Buy OIL & GOLD, Sell Stocks Indices When Missiles Are Flying!In this Weekly Market Forecast, we will analyze the S&P 500, NASDAQ, DOW JONES, Gold and Silver futures, for the week of June 16-20th.
When missiles start flying in the Middle East, investors become reactively risk averse. Money goes from stocks to safe havens and oil. That's it. Expect oil prices to rise, Gold to reach new highs, and the equity markets to see more sellers than buyers.
This environment may last a few days or a few weeks. Keep an ear to the news.
Enjoy!
May profits be upon you.
Leave any questions or comments in the comment section.
I appreciate any feedback from my viewers!
Like and/or subscribe if you want more accurate analysis.
Thank you so much!
Disclaimer:
I do not provide personal investment advice and I am not a qualified licensed investment advisor.
All information found here, including any ideas, opinions, views, predictions, forecasts, commentaries, suggestions, expressed or implied herein, are for informational, entertainment or educational purposes only and should not be construed as personal investment advice. While the information provided is believed to be accurate, it may include errors or inaccuracies.
I will not and cannot be held liable for any actions you take as a result of anything you read here.
Conduct your own due diligence, or consult a licensed financial advisor or broker before making any and all investment decisions. Any investments, trades, speculations, or decisions made on the basis of any information found on this channel, expressed or implied herein, are committed at your own risk, financial or otherwise.

USOIL: Absolute Price Collapse Ahead! Short!
My dear friends,
Today we will analyse USOIL together☺️
The recent price action suggests a shift in mid-term momentum. A break below the current local range around 73.387 will confirm the new direction downwards with the target being the next key level of 72.481.and a reconvened placement of a stop-loss beyond the range.
❤️Sending you lots of Love and Hugs❤️

BRIEFING Week #24 : is Stagflation Coming next ?Here's your weekly update ! Brought to you each weekend with years of track-record history..
Don't forget to hit the like/follow button if you feel like this post deserves it ;)
That's the best way to support me and help pushing this content to other users.
Kindly,
Phil

USOIL Will Go Up From Support! Long!
Please, check our technical outlook for USOIL.
Time Frame: 12h
Current Trend: Bullish
Sentiment: Oversold (based on 7-period RSI)
Forecast: Bullish
The price is testing a key support 73.374.
Current market trend & oversold RSI makes me think that buyers will push the price. I will anticipate a bullish movement at least to 78.914 level.
P.S
The term oversold refers to a condition where an asset has traded lower in price and has the potential for a price bounce.
Overbought refers to market scenarios where the instrument is traded considerably higher than its fair value. Overvaluation is caused by market sentiments when there is positive news.
Disclosure: I am part of Trade Nation's Influencer program and receive a monthly fee for using their TradingView charts in my analysis.
Like and subscribe and comment my ideas if you enjoy them!

Israel VS Iran War: Oil Spike!Tensions between Israel and Iran have escalated dramatically, with both nations engaging in direct military strikes. Israel launched Operation Rising Lion, targeting Iran’s nuclear infrastructure, missile factories, and military personnel. In response, Iran retaliated with missile attacks on Israel, hitting Tel Aviv and wounding civilians
The conflict stems from long-standing hostilities, particularly over Iran’s nuclear program, which Israel views as an existential threat. The situation has drawn international attention, with the United States distancing itself from Israel’s actions while maintaining strategic interests in the region.
The escalation has raised concerns about a wider regional war, with analysts warning of unintended consequences and further retaliation. The global markets have also reacted, with oil prices surging amid uncertainty.

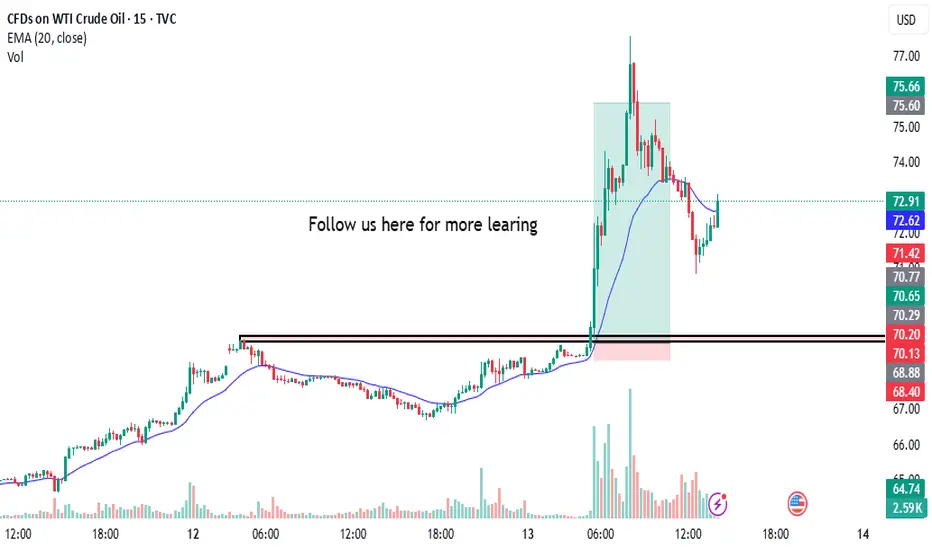
Captures 1:15 in US OIL Today i captures 1:15 in us oil
the annalysis was simple and clean as always i took trade on breakout of zone with proper research & annalysis and booom, as always we got our profit
follow us for more learing here
Israel creates a risk-off environmentThe current geopolitical tensions continue to escalate and this is creating a risk-off environment, forcing investors to worry. Let's dig in.
MARKETSCOM:OIL
TVC:USOIL
Let us know what you think in the comments below.
Thank you.
77.3% of retail investor accounts lose money when trading CFDs with this provider. You should consider whether you understand how CFDs work and whether you can afford to take the high risk of losing your money. Past performance is not necessarily indicative of future results. The value of investments may fall as well as rise and the investor may not get back the amount initially invested. This content is not intended for nor applicable to residents of the UK. Cryptocurrency CFDs and spread bets are restricted in the UK for all retail clients.

Oil Price Rally Stalls at $77.72, Just Below 2025 HighFenzoFx—Oil prices resumed their bullish trend, accelerating after geopolitical tensions in the Middle East. The rally paused at $77.72, just below the 2025 high.
RSI 14 indicates an overbought market, while volume accumulation at $73.7 suggests possible sell orders. A consolidation phase is likely before further gains.
If oil pulls back, key demand zones at $64.00 and $66.00 offer bullish opportunities, with a potential move toward the 2025 high at $80.59.

USOIL:Go long
Stay on the long side.
Trading Strategy:
BUY@71.8-72.3
TP: 74-74.3
↓↓↓ More detailed strategies and trading will be notified here ↗↗↗
↓↓↓ Keep updated, come to "get" ↗↗↗

USOIL || Geopolitical Spike Hits Major Resistance - Watch $77.77🛢️
📅 June 13, 2025
👤 By: MJTRADING
🔍 🧭 Fundamental Context – Risk Premium on the Rise:
Crude oil surged sharply today following reports of Israeli airstrikes on Iranian territory — a move that reawakens fears of broader Middle East escalation. Iran plays a crucial role in OPEC and controls the strategic Strait of Hormuz , through which ~20% of global oil passes.
While Iran has not officially responded yet, markets are pricing in the potential for:
* Military retaliation
* Disruption of oil exports or maritime routes
* Heightened volatility across global risk assets
=======================================================
📉 📊 Technical Structure – Tag of Key Resistance at $77.7:
Price exploded upward, piercing the descending channel that's been intact since mid-2022.
Today's daily wick tagged the $77.70 level, a major horizontal resistance and channel top.
This zone has repeatedly acted as a pivot in both bullish and bearish phases.
Volume confirmed the move – highest daily volume in months, suggesting institutional reaction.
💡 Trading Outlook:
🔼 Scenario A – Breakout & Close Above $77.7 = Bull Continuation
If tomorrow closes firmly above $77.70:
Target 1: $88.88 supply zone
Target 2: $90.00 psychological resistance
Setup: Conservative entries on retest of $75–77 area with tight invalidation
🔽 Scenario B – Failed Breakout → Fade Back Inside Channel
If this was a headline-driven spike with no follow-through, bears may re-enter strongly
A close below $75 could confirm bull trap
Support zone to watch: $66.66 (mid-channel, EMA confluence)
⚠️ Risk Factors to Monitor:
Iran’s response (military, diplomatic, strategic)
US/NATO reaction to potential escalation
Strait of Hormuz disruption
OPEC commentary or Saudi-led output adjustment
Market sentiment unwind (profit-taking from overbought spike)
💬 Markets love emotion, but traders survive with structure. This is not the time to be reckless — size down, be responsive, and respect both breakouts and fakeouts.
📎 #CrudeOil #Geopolitics #OilSpike #WTI #MiddleEastTensions #Iran #IranIsrael #TechnicalAnalysis #MJTRADING

California Resources Corporation (CRC) – Stock Analysis and ForeCalifornia Resources Corporation, a key player in crude oil production and carbon management, has recently experienced a notable uptick in investor interest.
This momentum appears to be supported by macroeconomic tailwinds, including renewed trade tensions between the United States and other major economies.
Historically, geopolitical uncertainty often leads to increased energy demand and price volatility, both of which tend to benefit domestic oil producers like CRC.
From a fundamental standpoint, investor sentiment toward CRC has grown increasingly positive. The company’s strategic positioning in California's energy transition—particularly its focus on carbon capture and storage (CCS)—is beginning to resonate more with institutional investors looking to align portfolios with sustainable yet profitable energy operations.
If these supportive fundamentals continue, there is potential for the stock to reach $56 in the coming months, assuming no major changes to current market dynamics or geopolitical influences.
Technical Outlook:
Entry Point: $44.68
Stop Loss: $42.73
Take Profit 1: $50.84
Take Profit 2: $55.88
As always, trade with care, apply proper risk management, and ensure your positions align with your overall investment strategy.
If you find this helpful, kindly follow me, subscribe, like, comment and share.

Crude Oil - Two Scenarios and about Brain PowerPrice retests the L-MLH.
VI. - Price breaks upward, target is the centerline
VII. - Price reverses again, then the target is the 1/4 line, with a subsequent extended target at the red centerline, and possibly even lower at the white dashed warning line.
On a personal note:
I was once again told that the price didn’t do what I had projected.
...yeah, really, that’s how it is §8-)
After over 30 years in the markets and hundreds of coaching sessions, I’m still amazed that people think you can predict price movements as if with a magic crystal ball.
The fact that this belief still persists (even though they don’t understand even the absolute basics of trading) deeply concerns me at the core of my trading soul.
Because this growing irrationality clearly indicates that far too little is being done in terms of education – or humanity might simply go extinct in the next 100 years due to rapidly declining intelligence!
...maybe I should just create a chart and apply a few median lines/forks?
Happy trading to all of you and I pray for those with lesser brain power.

Geopolitical Scenario. Market Outlook during London OpenCovering Gold Dax NQ and other assets with proper reasoning.

CL - Crude Oil - long strategyCL - Crude Oil - long strategy
RSI confirmed potential new long opportunities
H&S reversal pattern
There are conditions for inversion

Israel Strikes Iran. Oil and Gold Prices SurgeIsrael Strikes Iran. Oil and Gold Prices Surge
According to media reports, Israel launched a large-scale overnight strike on Iranian territory, targeting dozens of military and strategic facilities linked to the country’s nuclear programme and missile capabilities. Israeli officials justified the action by citing an existential threat from Tehran, which, according to their intelligence, is accelerating its development of nuclear weapons and expanding its arsenal of ballistic missiles.
In response, Iran has vowed severe retaliation, stating that the United States and Israel will “pay a heavy price” for the attack. US President Donald Trump has urgently convened a meeting to assess the situation.
Commodities Market Reaction
In the wake of these developments, gold — the primary safe-haven asset — surged sharply. The XAU/USD price broke above its May high, rising past $3,440. However, the all-time high near $3,498 remains intact for now.
Oil prices also spiked due to fears of supply disruption. The military conflict threatens shipping through the Strait of Hormuz, a crucial chokepoint through which one-fifth of the world’s oil supply passes. Traders quickly priced in the risk of war, anticipating a supply shortage driven by large-scale instability in the Middle East.
Technical Analysis of the XBR/USD Chart
Brent crude oil price has risen to the upper boundary of a large-scale descending channel (shown in red), which is defined by lower highs from 2024–2025. As anticipated, this upper boundary acted as resistance, with the price forming a peak above $76 before reversing downward (as illustrated by the black arrow).
From a technical standpoint, following such a sharp rally, Brent is vulnerable to a corrective move. In this scenario, a pullback into the orange zone is possible, where support may be found at:
→ The psychologically important $70 level;
→ The 50% Fibonacci retracement level;
→ The former resistance of the purple descending trendline, now turned support.
Nevertheless, given the scale of the geopolitical threat, it is unlikely that market sentiment will allow Brent to decline significantly in the near term.
This article represents the opinion of the Companies operating under the FXOpen brand only. It is not to be construed as an offer, solicitation, or recommendation with respect to products and services provided by the Companies operating under the FXOpen brand, nor is it to be considered financial advice.

USOIL:Go long
USOIL:Crude oil rose sharply under the tension in the Middle East, the early repeatedly suggested that the continuous low shock after the upward breakthrough, the time of storage force is long enough, especially the watershed 64.8 break after the rising space has been opened, the trading idea is still to step back and do long.
Trading Strategy:
BUY@66.9-67.2
TP: 68.6-69
↓↓↓ More detailed strategies and trading will be notified here ↗↗↗
↓↓↓ Keep updated, come to "get" ↗↗↗

Chasing Oil Spikes? How Geopolitics Can Wreck SetupsOil prices surged over 12% in Asia on Middle East headlines, sparking a surge of volatility across safe-haven currencies and stock market futures during thin trade.
It felt like a good time to provide food for thought to newer traders looking to chase these moves, highlight the mockery geopolitics can make of technical analysis with recent examples, and provide a filter for when the waters may be safer to reenter.
Matt Simpson, Market Analyst at City Index and Forex.com

WTI Oil D1 | Potential bounce off a pullback supportWTI oil (USOIL) is falling towards a pullback support and could potentially bounce off this level to climb higher.
Buy entry is at 73.17 which is a pullback support that aligns with the 23.6% Fibonacci retracement.
Stop loss is at 70.50 which is a level that lies underneath a a pullback support and the 38.2% Fibonacci retracement.
Take profit is at 78.07 which is a a pullback resistance.
High Risk Investment Warning
Trading Forex/CFDs on margin carries a high level of risk and may not be suitable for all investors. Leverage can work against you.
Stratos Markets Limited (tradu.com ):
CFDs are complex instruments and come with a high risk of losing money rapidly due to leverage. 63% of retail investor accounts lose money when trading CFDs with this provider. You should consider whether you understand how CFDs work and whether you can afford to take the high risk of losing your money.
Stratos Europe Ltd (tradu.com ):
CFDs are complex instruments and come with a high risk of losing money rapidly due to leverage. 63% of retail investor accounts lose money when trading CFDs with this provider. You should consider whether you understand how CFDs work and whether you can afford to take the high risk of losing your money.
Stratos Global LLC (tradu.com ):
Losses can exceed deposits.
Please be advised that the information presented on TradingView is provided to Tradu (‘Company’, ‘we’) by a third-party provider (‘TFA Global Pte Ltd’). Please be reminded that you are solely responsible for the trading decisions on your account. There is a very high degree of risk involved in trading. Any information and/or content is intended entirely for research, educational and informational purposes only and does not constitute investment or consultation advice or investment strategy. The information is not tailored to the investment needs of any specific person and therefore does not involve a consideration of any of the investment objectives, financial situation or needs of any viewer that may receive it. Kindly also note that past performance is not a reliable indicator of future results. Actual results may differ materially from those anticipated in forward-looking or past performance statements. We assume no liability as to the accuracy or completeness of any of the information and/or content provided herein and the Company cannot be held responsible for any omission, mistake nor for any loss or damage including without limitation to any loss of profit which may arise from reliance on any information supplied by TFA Global Pte Ltd.
The speaker(s) is neither an employee, agent nor representative of Tradu and is therefore acting independently. The opinions given are their own, constitute general market commentary, and do not constitute the opinion or advice of Tradu or any form of personal or investment advice. Tradu neither endorses nor guarantees offerings of third-party speakers, nor is Tradu responsible for the content, veracity or opinions of third-party speakers, presenters or participants.

USOIL CRACK!Usually, these types of events are great selling opportunities as they are short-lived. However, this time may be different.
I would expect a pullback then if it lasts and escalates a breakout. For now, just observe, have patience, and look for the 2nd crack!
If it cracks a 2nd time, it is definitely not good for US inflation.

WTI(20250613)Today's AnalysisMarket news:
The number of initial jobless claims in the United States for the week ending June 7 was 248,000, higher than the expected 240,000, the highest since the week of October 5, 2024. The monthly rate of the core PPI in the United States in May was 0.1%, lower than the expected 0.30%. Traders once again fully priced in the Fed's two interest rate cuts this year.
Technical analysis:
Today's buying and selling boundaries:
66.96
Support and resistance levels:
69.10
68.30
67.78
66.13
65.61
64.81
Trading strategy:
If the price breaks through 67.78, consider buying in, and the first target price is 68.30
If the price breaks through 66.96, consider selling in, and the first target price is 66.13

Iran tensions rise: a setup brewing for gold and oil Geopolitical tensions surrounding Iran might fuel safe-haven demand for gold.
A break above $3,403 might open the door for a test of the May high at $3,437. However, price action over the last two sessions potentially indicates that buyers are reluctant to drive spot prices above $3,400.
At the same time, analysts are suggesting that oil could climb toward $120 if Israel takes military action against Iran. “I don’t want to say it’s imminent, but it looks like something that could very well happen,” President Trump said during a White House event.
Meanwhile, cooler-than-expected US CPI and PPI prints have potentially strengthened expectations that the Federal Reserve could begin cutting interest rates by September, with a second cut possibly following before year-end.
