Bullish momentum remains robust.International oil prices surged then pulled back. Brent crude oil futures fell 47 cents to $69.40 per barrel, while U.S. West Texas Intermediate (WTI) dropped 33 cents to $67.84. In the previous session, both Brent and WTI recorded over 4% gains, hitting their highest levels since early April.
On Wednesday, U.S. President Trump stated that the U.S. is withdrawing some personnel from the Middle East due to the region's potential danger, reiterating that Iran will not be allowed to develop nuclear weapons. Meanwhile, market surveys showed the U.S. is preparing partial evacuations of personnel from its embassy in Iraq and allowing family members in Bahrain and other areas to leave. U.S. and Iraqi sources revealed the move primarily stems from heightened security risks in the region.
Current upward momentum in the oil market is driven by dual factors: geopolitical tensions in the Middle East and unexpected declines in U.S. inventories. In the short term, as long as tensions between Iran and the U.S. show no signs of easing, the market will continue to monitor potential supply disruption risks. Additionally, the alleviation of trade concerns and global economic recovery expectations will provide strong long-term support for oil prices. However, risks of sharp volatility from sudden deterioration in geopolitical situations should be vigilantly monitored.
With moving averages diverging upward, the short-term objective trend is clearly established as bullish. It is expected that crude oil prices will continue to rise and hit new highs.
Humans need to breathe, and perfect trading is like breathing—maintaining flexibility without needing to trade every market swing. The secret to profitable trading lies in implementing simple rules: repeating simple tasks consistently and enforcing them strictly over the long term.
Trading Strategy:
buy@65.5.0-66.0
TP:67.5-68.0
Energy Commodities
Slowing Global Economy and Output Hikes Weigh on Brent OilBrent crude oil is holding steady around the $60 level, even after OPEC announced another 411,000 barrels per day increase in output, following similar hikes in May, June and smaller one in April. This latest adjustment comes at a time when global economic slowdown concerns are rising, making the decision a risky one. Although the main reason points to non-compliance from Kazakhstan and Iraq, some believe the United States may have played a role, possibly through pressure from Trump aimed at controlling inflation during the ongoing tariff hikes.
With several consecutive production increases now in place, a growing surplus is likely to develop over the second half of 2025. This would maintain downward pressure on oil prices if demand fails to keep pace. At the same time, the broader economic outlook is weakening. Recent manufacturing activity data from China, the United States, the European Union, and the United Kingdom all came in below 50, suggesting a faster rate of contraction. The presence of widespread tariffs is expected to continue weighing on business sentiment and consumer demand, potentially leading to rising unemployment and slowing growth.
In this environment, any short-term spikes in Brent and WTI prices are likely to remain opportunities to sell, unless there is a meaningful shift in underlying fundamentals. For a more detailed view of economic trends, please refer to the latest monthly report.
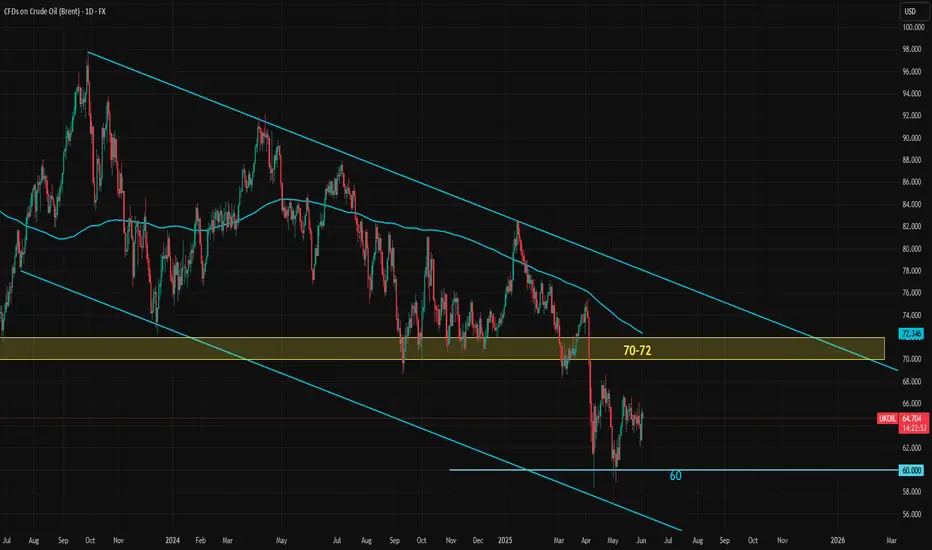
Brent crude has been in a steady downtrend since March of last year. While the price movement doesn't follow a perfect trend channel, the structure has generally held well. At the moment, Brent is hovering near the middle of this declining channel.
The former long-term support zone around $70 to $72. If prices move up toward this zone, it could present a fresh selling opportunity as long as the resistance holds. On the downside, the $60 level and the area just below it have formed a solid medium-term support, which has held up so far.
Still, oil bulls should be cautious around the $60 mark. Even though support looks strong for now, the overall direction of the trend and the broader fundamental backdrop suggest that this level could eventually break. Any long positions taken near current levels should factor in the potential for renewed downside pressure.
WTI OIL Massive rejection on the 1D MA200.WTI Oil (USOIL) has been trading within a Channel Down for over a year now and today its latest Bullish Leg hit the 1D MA200 (orange trend-line) for the first time since February 03 2025.
Unless we see a sustainable structured rise that turns it into a Support, the long-term bearish trend should prevail, and the market has already reacted to this with a strong rejection.
With the 1D RSI almost overbought (>70.00), being consistent with the last 3 major tops, we expect a gradual decline towards Support 1, as it happened on the January - February 2025 Bearish Leg.
Our Target is just above it at $55.50.
-------------------------------------------------------------------------------
** Please LIKE 👍, FOLLOW ✅, SHARE 🙌 and COMMENT ✍ if you enjoy this idea! Also share your ideas and charts in the comments section below! This is best way to keep it relevant, support us, keep the content here free and allow the idea to reach as many people as possible. **
-------------------------------------------------------------------------------
💸💸💸💸💸💸
👇 👇 👇 👇 👇 👇

Crude Oil Eyes 65.40 Support Amid Middle East Uncertainty!!Hey Traders,
In today’s trading session, we’re closely monitoring USOIL for a potential buying opportunity around the 65.40 zone. The commodity remains in an overall uptrend, and is currently undergoing a corrective phase, approaching a key support/resistance area near 65.40. This level aligns well with the broader trend structure and may offer a favorable risk-to-reward setup.
On the fundamental side, geopolitical tensions are on the rise. Reports indicate that U.S. embassy personnel are being evacuated from parts of the Middle East amid growing regional instability. Allegedly, Israel is preparing for potential military action against Iran should nuclear deal talks collapse.
If these tensions escalate further into military conflict, oil prices could spike in response to the heightened risk to regional supply chains.
Trade safe,
Joe

CRUDE OIL (WTI): Pullback From Key Level
WTI Crude Oil looks overbought after a test of key daily horizontal resistance level.
A violation of a minor horizontal support on an hourly time frame after its test
provides a strong intraday confirmation.
I expect a retracement to 66.33 level.
❤️Please, support my work with like, thank you!❤️

WTI Oil H4 | Potential bullish bounceWTI oil (USOIL) is falling towards a pullback support and could potentially bounce off this level to climb higher.
Buy entry is at 66.44 which is a pullback support.
Stop loss is at 64.25 which is a level that lies underneath an overlap support and the 50% Fibonacci retracement.
Take profit is at 69.11 which is a pullback resistance.
High Risk Investment Warning
Trading Forex/CFDs on margin carries a high level of risk and may not be suitable for all investors. Leverage can work against you.
Stratos Markets Limited (tradu.com ):
CFDs are complex instruments and come with a high risk of losing money rapidly due to leverage. 63% of retail investor accounts lose money when trading CFDs with this provider. You should consider whether you understand how CFDs work and whether you can afford to take the high risk of losing your money.
Stratos Europe Ltd (tradu.com ):
CFDs are complex instruments and come with a high risk of losing money rapidly due to leverage. 63% of retail investor accounts lose money when trading CFDs with this provider. You should consider whether you understand how CFDs work and whether you can afford to take the high risk of losing your money.
Stratos Global LLC (tradu.com ):
Losses can exceed deposits.
Please be advised that the information presented on TradingView is provided to Tradu (‘Company’, ‘we’) by a third-party provider (‘TFA Global Pte Ltd’). Please be reminded that you are solely responsible for the trading decisions on your account. There is a very high degree of risk involved in trading. Any information and/or content is intended entirely for research, educational and informational purposes only and does not constitute investment or consultation advice or investment strategy. The information is not tailored to the investment needs of any specific person and therefore does not involve a consideration of any of the investment objectives, financial situation or needs of any viewer that may receive it. Kindly also note that past performance is not a reliable indicator of future results. Actual results may differ materially from those anticipated in forward-looking or past performance statements. We assume no liability as to the accuracy or completeness of any of the information and/or content provided herein and the Company cannot be held responsible for any omission, mistake nor for any loss or damage including without limitation to any loss of profit which may arise from reliance on any information supplied by TFA Global Pte Ltd.
The speaker(s) is neither an employee, agent nor representative of Tradu and is therefore acting independently. The opinions given are their own, constitute general market commentary, and do not constitute the opinion or advice of Tradu or any form of personal or investment advice. Tradu neither endorses nor guarantees offerings of third-party speakers, nor is Tradu responsible for the content, veracity or opinions of third-party speakers, presenters or participants.

Crude Oil Going Higher - TA and fundamentals aligneThe 0-5 count is not over yet.
Sudo 4 and 5 are still lurking.
It's good to see how the Medianline-Set cought the Highs of the swings. Likewise we can see the subborn rejection at the Center-Line at P3.
I will not trade CL to the short side, until it's clear that P4 is engraved in this Chart. Until then, I maybe shoot for some intraday or dayli trades in Crude.
Economy Facts that support a rise, up to P4:
Crude oil refineries typically switch to producing more gasoline (fuel for cars) in the spring, particularly around March to April in the United States and other northern hemisphere countries.
Seasonal demand: Warmer months mean more driving and vacation travel, increasing gasoline demand.
Regulatory change: Refineries begin producing summer-grade gasoline, which has lower volatility and is required by environmental regulations (especially in the U.S. under EPA rules).
The switch to summer-grade gasoline must be completed by June 1st for retail and May 1st for terminals and pipelines in the U.S.
In Summary:
- Switch begins: March–April
- Completed by: May (terminals), June (retail)
- This seasonal shift is often called the "refinery maintenance season" or "spring blend switch."

WTI Crude Oil 4H Chart – Bullish Setup from Demand Zone📈 Current Price: $61.74
🔵 Key Zones & Levels
🔹 Demand Zone (Buy Area):
🟦 $59.48 – $61.39
→ Price expected to bounce here
→ 🔄 Potential reversal zone
🔹 Entry Point:
🎯 $61.39
→ Ideal level to enter LONG
→ Just above demand zone
🔹 Stop Loss:
🛑 Below $59.48
→ Exit if price drops here
→ Protects capital
🔹 Target Point:
🚀 $67.00
→ Profit-taking zone
→ Strong resistance zone nearby:
* 66.63
* 66.75
* 67.60
📊 Indicators
📍 EMA (70): 🔴 61.40
→ Price trading above = bullish signal
→ EMA acting as support
📏 Trendline Channel:
🔼 Higher highs & higher lows
→ Supports uptrend continuation
📌 Trade Plan Summary
* Bias: 📈 Bullish
* Buy: At 61.39
* Stop: Below 59.48 🛑
* Target: 67.00 🎯
* Risk-Reward: ✔️ Favorable (~1:3)
🔍 What to Watch
* ✅ Bullish candles in demand zone
* 🔁 Retest of EMA or lower channel
* ❌ Avoid if it breaks below $59.48

WTI(20250612)Today's AnalysisMarket news:
① The EU hopes that the trade negotiations will be extended beyond the suspension period set by Trump. ② Bessant: As long as "sincerity" is shown in the negotiations, the Trump administration is willing to extend the current 90-day tariff suspension period beyond July 9. ③ Trump will hold multiple bilateral talks during the G7 summit. ④ The total customs revenue of the United States in May reached a record high of US$23 billion, an increase of nearly four times year-on-year. ⑤ Lutnick: One deal after another will be reached.
Technical analysis:
Today's buying and selling boundaries:
66.02
Support and resistance levels:
69.56
68.23
67.38
64.66
63.80
62.47
Trading strategy:
If the price breaks through 67.38, consider buying in, and the first target price is 68.23
If the price breaks through 66.02, consider selling in, and the first target price is 64.66

GME COLLAPSE - NET SELLOFF - MARKET ANALYSISGameStop (GME) is dropping in after-hours trading following its $1.3 billion convertible senior notes offering, which investors see as potential dilution. Similarly, Cloudflare (NET) is also falling due to concerns over its $1.75 billion convertible debt offering, which could impact shareholder value.
On the flip side, Oracle (ORCL) surged after reporting strong Q4 earnings, with cloud infrastructure revenue expected to grow over 70% in fiscal 2026. This could provide a tailwind for the broader cloud sector.
The market’s pullback today was much needed, with many stocks retesting key breakout zones

USOUL:Go long near 65.5
USOIL:Crude oil broke through the watershed 64.85 after the emergence of strong unilateral bulls, daily cycle relying on short-term average to go even Yang form, rising space has opened, pay attention to the strong will continue at least a few trading days, short-term relying on 65 defense needs to be more, pay attention to 65.5 near the long, see 66.7-67
Trading Strategy:
BUY@65.5
TP: 66.7-67
↓↓↓ More detailed strategies and trading will be notified here ↗↗↗
↓↓↓ Keep updated, come to "get" ↗↗↗

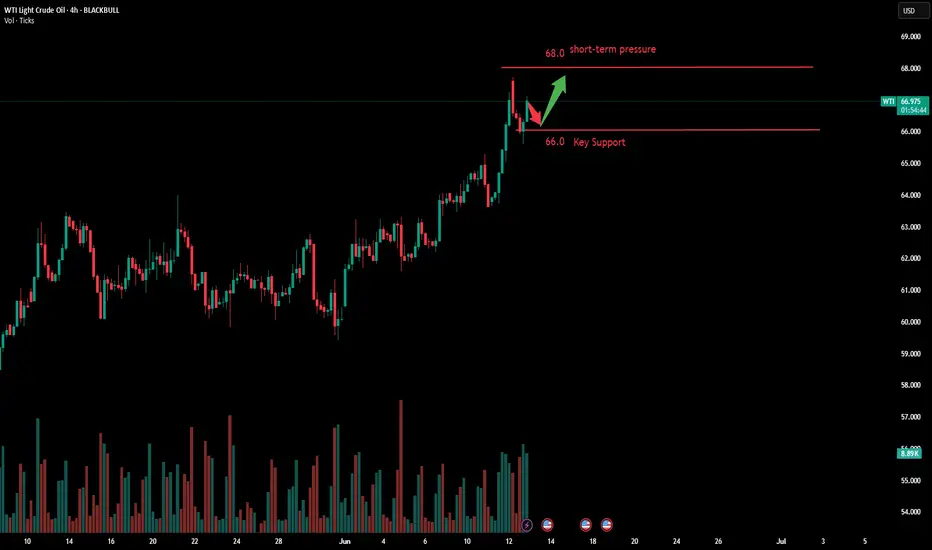
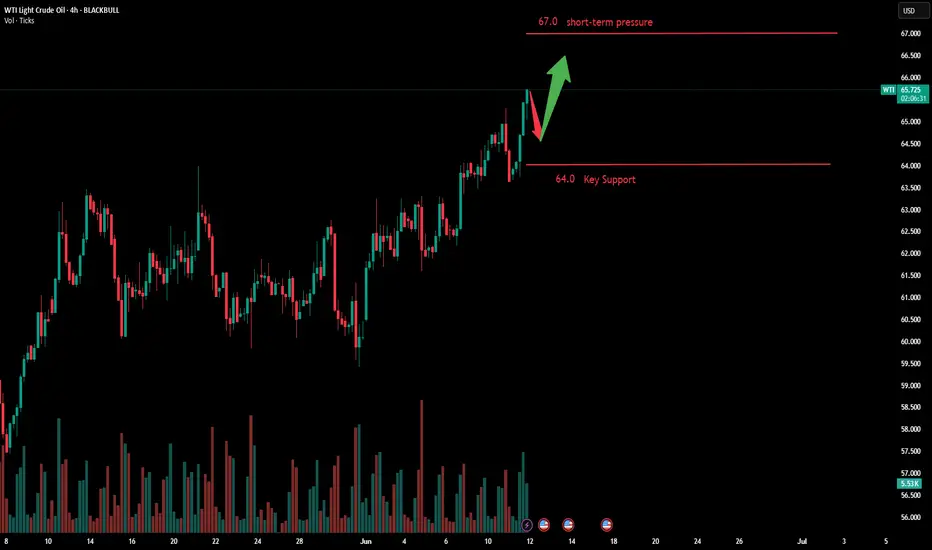
"Go long on crude oil with strong unilateral pullback"The market is weighing the impact of global trade tensions on the global crude oil demand outlook. After two days of intense consultations in London, the Asian giant and the U.S. have reached a framework agreement on restarting trade talks. U.S. Commerce Secretary Howard Lutnick said after the negotiations that the framework still needs review and approval from President Trump. Crude oil continued to rise after a pullback correction, showing a single bearish candlestick retracement pattern on the daily chart. With price supported at the MA5 level, it continues to make new highs, and this rally could target the 67.0 level.
Humans need to breathe, and perfect trading is like breathing—maintaining flexibility without needing to trade every market swing. The secret to profitable trading lies in implementing simple rules: repeating simple tasks consistently and enforcing them strictly over the long term.
Trading Strategy:
buy@64.0-64.5
TP:66.5-67.0
Crude Oil Surges on Summer Demand and Trade OptimismOn the weekly chart, crude oil trades above the mid-range of a descending channel that has been in place since the 2022 highs. The RSI remains just below the neutral zone, suggesting a cautiously bullish-to-neutral outlook while prices hover near the $65 resistance level.
From a daily perspective, oil prices are breaking out above the $65 resistance, and a firm hold could pave the way toward $66 and potentially retest the $71 and $73 levels.
On the downside, the psychological support at $60 remains critical. A break below $60—and more critically, below the $58 moving average—could reintroduce long term bullish positioning from $55 and $49.
- Razan Hilal, CMT

USOIL:Go short before you go long
USOIL:Crude oil trend in line with expectations to break 65, hourly level to see adjustment, trading can be done first short and then long. Here are my range trading ideas.
Trading Strategy:
SELL@65.4-65.5
TP:64.5-64.
BUY@64.5-64
TP: 65.3-65.5
↓↓↓ More detailed strategies and trading will be notified here ↗↗↗
↓↓↓ Keep updated, come to "get" ↗↗↗

WTI on high time frame , price reach 60$?
"Hello friends, focusing on WTI, the price is currently in a bullish trend on the daily time frame. During the last NY session, the price swept liquidity in the $66 zone and faced a strong rejection. Considering both technical analysis and fundamental news, I believe the price is gearing up for a decline, with the initial target likely around $60."
If you need further clarification or have more details to discuss, feel free to share!

Will Oil Prices Face Downward Pressure After EIA's Forecast?Macro approach:
- The EIA’s latest short-term outlook projects weaker oil prices as rising global inventories weigh on the market. Sluggish demand growth and increased production are expected to push output above consumption, building stockpiles and adding pressure on prices.
- Traders are also monitoring the ongoing US-China trade talks in London. Sentiment remains cautiously optimistic after US Commerce Secretary Lutnick described the negotiations as progressing well.
- On the supply side, Saudi Aramco has reduced its Jul oil shipments to China by 1 million barrels compared to Jun, suggesting that the recent OPEC+ production hike may not translate into substantial new supply.
Technical approach:
- USOIL retested both the descending trendline and resistance near 64.50 before pulling back. The price remains above both EMAs, signaling that bullish momentum is still intact.
- A breakout above 64.50 and the descending trendline could open the door to 68.00–70.00.
- However, failure to clear this resistance may lead to a retreat toward the 60.00 support level.
Analysis by: Dat Tong, Senior Financial Markets Strategist at Exness

WTI Crude Oil Stalls At Technical JunctureCrude oil has enjoyed a decent rally in recent weeks thanks to improved sentiment and OPEC+ scaling back production. Yet momentum turned against bulls on Tuesday, despite positive trade talks between the US and China. Today I discuss whether this could be a turning point for oil, or simply a bump in the road.
Matt Simpson, Market Analyst at City Index and Forex.com

RIG Mega Profits SecuredRIG is a high beta oil stock. We secured profits today and looking for another entry.
With the recent breakout and upside momentum in oil, this name caught a massive bid.
Crude oil has seen a sharp rise in just the last week and shaping up for a continuation move higher.
If this breakout holds energy stocks should continue to fly.
WTI has its first major resistance level coming up within 1% from current price.
Look for pullback buys in energy if oil continue to hold the inverse head & shoulder breakout.

WTI Cash Bearish Divergence BearishU.S. Iran tensions, U.S. China Talks, U.S. Production capacity down,Inflation high
Techincally: Volume surges, Divergence,
Targets: See the chart.
Entries: 3 approches(red Boxes)
I am short. I stay short. At current level (above 64 risk of being bullish is higher than being short).
Mange risk tightly.

Crude Oil Surges StronglyAs market participants await positive outcomes from negotiations between a major Asian economy and the U.S., crude oil prices edge higher modestly. During Tuesday's Asian session, Brent crude oil futures rose by $0.12 to $67.16 per barrel, while U.S. WTI crude oil gained $0.13 to $65.42, briefly hitting a new high since April 4th intraday. In the previous trading day, Brent surged to $67.19, the highest level since April 28th, primarily driven by market expectations of a potential deal between the U.S. and China.
Current oil prices stand at a crossroads of multiple factors. In the short term, the global trade landscape dictates the main thread of market sentiment. If a mitigation plan is reached, it will boost demand expectations. However, the resumption of Iranian exports and OPEC's production increase strategy may lead to a potential supply glut in the second half of the year, emerging as the primary risk suppressing oil prices.
Technically, the K-line has pierced below the moving average system, indicating a shift in the short-term objective upward trend. The formation of a large-bodied bearish candle in the subsequent session establishes the main rhythm, suggesting that oil prices may further decline to around $63.50 today before seeking new support.
Overall, today's trading strategy for crude oil is recommended to focus on rebound shorting as the primary approach and pullback long positions as a supplement. In the short term, monitor resistance at the $67.5-68.0 range, while support lies at the $65.0-64.5 level.
Humans need to breathe, and perfect trading is like breathing—maintaining flexibility without needing to trade every market swing. The secret to profitable trading lies in implementing simple rules: repeating simple tasks consistently and enforcing them strictly over the long term.

WTI oil has approached a key area of resistanceThe technical picture of WTI oil shows that the commodity is now near one of its key downside resistance lines. Could we get a break, or trendline will remain intact?
Let's dig in!
TVC:USOIL
MARKETSCOM:OIL
Let us know what you think in the comments below.
Thank you.
77.3% of retail investor accounts lose money when trading CFDs with this provider. You should consider whether you understand how CFDs work and whether you can afford to take the high risk of losing your money. Past performance is not necessarily indicative of future results. The value of investments may fall as well as rise and the investor may not get back the amount initially invested. This content is not intended for nor applicable to residents of the UK. Cryptocurrency CFDs and spread bets are restricted in the UK for all retail clients.

USOIL BEST PLACE TO SELL FROM|SHORT
USOIL SIGNAL
Trade Direction: short
Entry Level: 65.62
Target Level: 62.64
Stop Loss: 67.59
RISK PROFILE
Risk level: medium
Suggested risk: 1%
Timeframe: 9h
Disclosure: I am part of Trade Nation's Influencer program and receive a monthly fee for using their TradingView charts in my analysis.
✅LIKE AND COMMENT MY IDEAS✅

CRUDE OIL (WTI): Detailed Support & Resistance Analysis
Here is my latest structure analysis for WTI Oil.
Resistance 1: 63.6 - 65.9 area
Resistance 2: 68.2 - 69.2 area
Resistance 3: 71.4 - 75.2 area
Support 1: 61.8 - 62.8 area
Support 2: 59.0 - 60.8 area
Support 3: 55.1 - 57.2 area
Consider these structures for pullback/breakout trading.
❤️Please, support my work with like, thank you!❤️
