Crude Oil | Support Level 62.700-61.700Crude Oil reached support level.
Take Profit : 71.750
Stop Loss : 60.680
Energy Commodities

Natural gas prices may be poised for a short-term reboundNatural gas prices have fallen by nearly 30% since early March and now appear to have reached oversold conditions, suggesting a potential bounce of more than 10% back to $3.75 per million British thermal units. Natural gas has risen above its 10-day exponential moving average (EMA), indicating a possible short-term trend change. The 10-day EMA, which previously acted as resistance, could provide support as the commodity’s price increases. A failure to maintain it may signal that the attempted trend reversal has been unsuccessful.
Natural gas reached oversold conditions around 20 April, when its relative strength index (RSI) fell to 30 and prices touched the lower Bollinger Band. Momentum now appears to be shifting, with the RSI showing signs of turning upwards and potentially breaking its downtrend. If this positive momentum continues building, natural gas prices could rise towards their 20-day simple moving average (SMA) at $3.56. Should prices extend beyond the 20-day SMA, they could rise to $3.75, where prices consolidated for several days around early April.
A failure to reach the 20-day SMA, or an inability to push beyond that level, could suggest natural gas prices may fall back to retest recent lows around $3.05 to $3.10, with the potential to decline further towards the lower Bollinger Band at $2.85.
For now, natural gas prices indicate a possible short-term turnaround. However, prices will need to continue extending higher to confirm that a bottom has indeed been reached.
Written by Michael J Kramer, founder of Mott Capital Management
Disclaimer: CMC Markets is an execution-only service provider. The material (whether or not it states any opinions) is for general information purposes only and does not take into account your personal circumstances or objectives. Nothing in this material is (or should considered to be) financial, investment or other advice on which reliance should be placed.
No opinion given in the material constitutes a recommendation by CMC Markets or the author that any particular investment, security, transaction, or investment strategy is suitable for any specific person. The material has not been prepared in accordance with legal requirements designed to promote the independence of investment research. Although we are not specifically prevented from dealing before providing this material, we do not seek to take advantage of the material prior to its dissemination.

Short on Oil/Back to 57$ SOONI believe we can continue the retest of previous major support level at 65-66$ and fibonacci 0.618. This major support will be flipped to resistance in my opinion. We can see a significant sell-off back towards the 57$ area and below from this location.
I will be looking to enter a short trade from the 0.618 region/66$ if there is a rejection.
My mid-term/end-of-year prediction for US OIL is between 45-50$ and possibly lower.
If you believe in the fundamentals and idea of this setup, feel free to follow and use it.
Not financial advice.

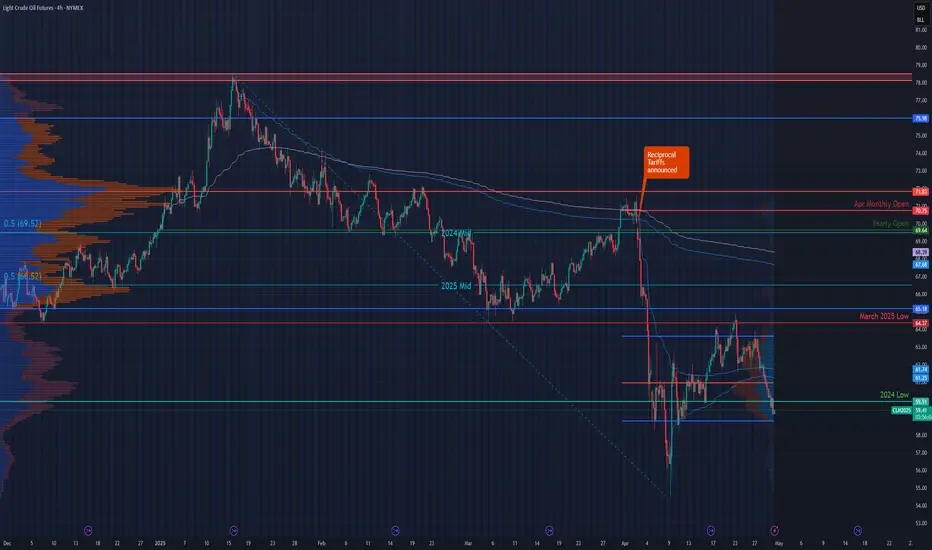
Planning for the Next Trade in Crude OilNYMEX:CL1!
Key Levels – Higher Timeframe:
• 2025 High: 78.56
• Yearly Open (2025): 69.64
• 2025 mCVPOC: 71.83
• Yearly VWAP: 68.41
• AVWAP from Yearly Highs: 67.71
• 2025 mCVAL: 65.28
• March 2025 Low: 64.37
• 2024 Low: 59.91
April 2025 Key Levels:
• April mCVAL: 58.79
• April mCVPOC: 60.94
• April AVWAP from Lows: 61.29
• April AVWAP from Highs: 61.76
• April mCVAH: 63.73
Our previous trade idea played out as expected. With updated levels now in place, we aim to reassess the market context without falling into recency or confirmation bias. These biases often lead to an overly bearish outlook at market lows, especially amid ongoing headlines around trade war tensions and supply concerns. While such fundamentals are important, maintaining objectivity is key.
This leads us to the central question: Is all this bearish sentiment already priced in? If so, why are sellers still dominant?
From a broader perspective, the overall context for crude remains bearish. However, this does not imply an immediate continuation to lower prices.
Currently, price is trading below both the midpoint of 2025 and that of 2024. Additionally, the recent price swing failed at the March 2025 low—an important technical rejection. The 2024 low at 59.91 now serves as key structural support. We anticipate further consolidation within the April 2025 value range, specifically between mCVAH (63.73) and mCVAL (58.79).
We define the area between April’s mCVPOC (60.94) and AVWAPs (61.29 / 61.76) as a "noise zone"—a region where price action is likely to be choppy and directionless. This zone is not favorable for directional trades.
Potential Trade Setup – Range-Bound Play
Example Trade 1: Long Crude Oil
• Entry: 59.91
• Stop: 59.20
• Target: 61.76
• Risk: 71 ticks
• Reward: 185 ticks
• Risk/Reward Ratio: 2.6R
Example Trade 2: Long Crude Oil
• Entry: 58.80
• Stop: 58.20
• Target: 61.76
• Risk: 60 ticks
• Reward: 296 ticks
• Risk/Reward Ratio: 4.93 R
Important Notes:
• These are example trade ideas and not financial advice or recommendations.
• Traders should conduct independent analysis and ensure proper risk management.
• Stop-loss orders are not guaranteed; slippage may occur, resulting in losses beyond predefined levels.
• AVWAP levels are accurate at the time of posting, they may vary as indicator further calculates prices with new volume and price information.
Glossary Index for all technical terms used:
ATH: All time high
VPOC: Volume Point of Control
VAL: Value Area Low
VAH: Value Area High
VP: Volume Profile
AVP: Anchored Volume Profile
C: Composite (prefix before VAL, VAH, VPOC, VP, AVP)
mC: micro-Composite (prefix before VAL, VAH, VPOC, VP, AVP)
AVWAP: Anchored Volume Weighted Average Price
Green Zones: Bull/ Buyers support zones
Red Zones: Bear/Seller resistance zones
Crude oil------sell near 61.60, target 60.00-58.00Crude oil market analysis:
Crude oil has also started to fluctuate recently. Yesterday's daily line finally began to decline. Crude oil is bearish in both the big and small trends. Continue to sell when it rebounds to the moving average. The crude oil pattern is still weak on the daily line. The current suppression position has begun to move down. Crude oil 61.68 is an opportunity to sell. The daily moving average has begun to rush down. Don't intercept it.
Fundamental analysis
Today, we will start to pay attention to the ADP data, as well as PCE data and EIA crude oil inventory data.
Operation suggestions
Crude oil------sell near 61.60, target 60.00-58.00

USOIL BULLS WILL DOMINATE THE MARKET|LONG
USOIL SIGNAL
Trade Direction: long
Entry Level: 59.70
Target Level: 63.67
Stop Loss: 57.06
RISK PROFILE
Risk level: medium
Suggested risk: 1%
Timeframe: 12h
Disclosure: I am part of Trade Nation's Influencer program and receive a monthly fee for using their TradingView charts in my analysis.
✅LIKE AND COMMENT MY IDEAS✅

Oil : April Could Be the Worst Month in Three and a Half YearsOil Prices: April Could Be the Worst Month in Three and a Half Years
As the XTI/USD chart shows:
→ at the beginning of April, WTI crude was trading above $71 per barrel;
→ this morning, on the last day of the month, the price has fallen below $60.
The overall decline may reach 16% — the worst monthly performance since November 2021.
Why Is Oil Falling?
The primary driver behind the sharp drop in oil prices earlier this month was the introduction of new US tariffs, particularly targeting China and the EU. This raised concerns that a potential global trade war could slow economic growth and, in turn, reduce global oil demand.
According to a Reuters poll, the tariffs imposed by Trump have made a global recession in 2025 a realistic risk.
In addition, growing attention is being paid to OPEC+ and its plans to increase oil production. The next meeting is scheduled for 5 May.
Technical Analysis of the XTI/USD Chart
Oil price fluctuations in 2025 have formed a descending channel (highlighted in red), with lower highs and lower lows reflecting continued bearish sentiment.
Bulls may hope for support to emerge around the $58.85 level, as:
→ this has acted as support before (as indicated by arrows);
→ this level aligns with the lower boundary of a local upward trend (shown in blue), which formed after news broke that Trump had postponed the implementation of some tariffs — triggering a sharp rebound in oil prices from the 9 April low.
Nevertheless, the broader structure remains bearish: the rise towards point C appears to be a corrective recovery following the impulse drop from A to B. Given the potential impact of upcoming news — including statements from the White House and OPEC+ decisions — a bearish breakout below the blue channel cannot be ruled out.
This article represents the opinion of the Companies operating under the FXOpen brand only. It is not to be construed as an offer, solicitation, or recommendation with respect to products and services provided by the Companies operating under the FXOpen brand, nor is it to be considered financial advice.

USOIL - Bearish Double TOPHello Traders !
The USOIL price formed a double top pattern.
Currently, The neckline is broken !
So, I expect a bearish move📉
________________
TARGET: 59.410🎯

OIL TRADE IDAHello
Hi everyone. Regarding oil movements, I see a long opportunity at the level of 59.61. If the price closes below 58.56, there is a possibility of a temporary rise before continuing to drop to 55.
good luck all
**My trading strategy is not intended to be a signal. It's a process of learning about market structure and sharpening my trading my skills also for my trade journal**
Thanks a lot for your support

Oil Price Rebound UnravelsThe price of oil may continue to give back the rebound from the monthly low ($54.46) as it extends the decline from the start of the week.
The price of oil starts to carve a series of lower highs and lows as it snaps the range bound price action from last week, with a move/close below the $59.20 (78.6% Fibonacci retracement) to $60.90 (78.6% Fibonacci retracement) region bringing the 2023 low ($52.24) on the radar.
Next area of interest comes in around $49.10 (100% Fibonacci extension), but lack of momentum to move/close below the $59.20 (78.6% Fibonacci retracement) to $60.90 (78.6% Fibonacci retracement) region may push the price of gold back towards the weekly high ($63.92).
Need a close above $64.70 (61.8% Fibonacci retracement) to bring the $70.80 (61.8% Fibonacci extension) to 72.30 (38.2% Fibonacci retracement) zone on the radar, with the next region of interest coming in around the February high ($74.30).
--- Written by David Song, Senior Strategist at FOREX.com

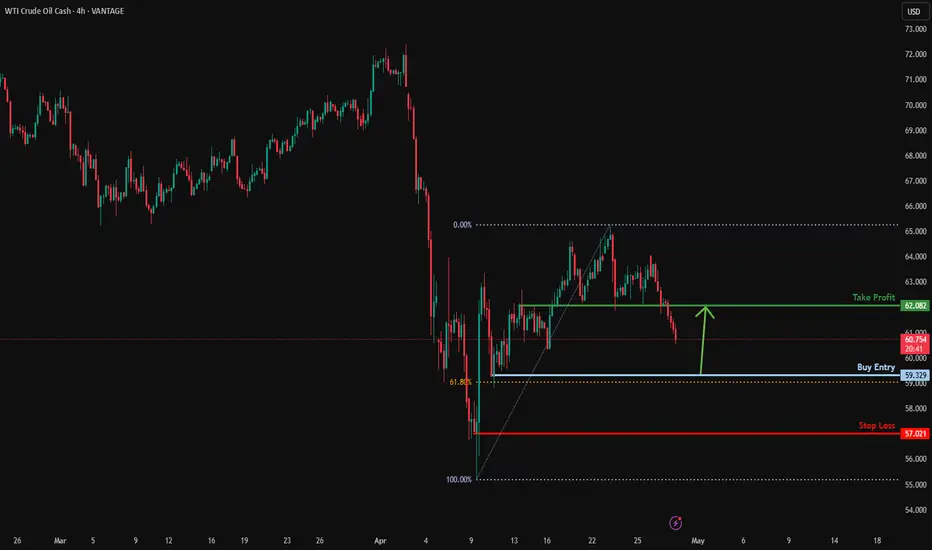
Could the price bounce from here?USO/USD is falling towards the support level which is a pullback support that lines up with the 61.8% Fibonacci retracement and could bounce from this level to our take profit.
Entry: 59.32
Why we like it:
There is a pullback support level that lines up with the 61.8% Fibonacci retracement.
Stop loss: 57.02
Why we like it:
There is a pullback support level.
Take profit: 62.08
Why we like it:
There is an overlap resistance level.
Enjoying your TradingView experience? Review us!
Please be advised that the information presented on TradingView is provided to Vantage (‘Vantage Global Limited’, ‘we’) by a third-party provider (‘Everest Fortune Group’). Please be reminded that you are solely responsible for the trading decisions on your account. There is a very high degree of risk involved in trading. Any information and/or content is intended entirely for research, educational and informational purposes only and does not constitute investment or consultation advice or investment strategy. The information is not tailored to the investment needs of any specific person and therefore does not involve a consideration of any of the investment objectives, financial situation or needs of any viewer that may receive it. Kindly also note that past performance is not a reliable indicator of future results. Actual results may differ materially from those anticipated in forward-looking or past performance statements. We assume no liability as to the accuracy or completeness of any of the information and/or content provided herein and the Company cannot be held responsible for any omission, mistake nor for any loss or damage including without limitation to any loss of profit which may arise from reliance on any information supplied by Everest Fortune Group.
WTI OIL Bearish Cross confirming more selling ahead.WTI Oil (USOIL) has been trading within a Channel Down pattern since the December 06 2024 Low. The last Bearish Leg started on a 1D MA200 (orange trend-line) rejection and was confirmed with a 1D MACD Bearish Cross 3 days after.
At the moment we have had a 1D MA50 (blue trend-line) rejection and today we will complete a new 1D MACD Bearish Cross. As a result, we almost have a new sell confirmation. Once completed, sell and target $53.50 (-19% from the point of the rejection).
-------------------------------------------------------------------------------
** Please LIKE 👍, FOLLOW ✅, SHARE 🙌 and COMMENT ✍ if you enjoy this idea! Also share your ideas and charts in the comments section below! This is best way to keep it relevant, support us, keep the content here free and allow the idea to reach as many people as possible. **
-------------------------------------------------------------------------------
Disclosure: I am part of Trade Nation's Influencer program and receive a monthly fee for using their TradingView charts in my analysis.
💸💸💸💸💸💸
👇 👇 👇 👇 👇 👇

Oil - Short Term Sell Trade Update!!!Hi Traders, on April 17th I shared this idea "Oil - Looking To Sell Pullbacks In The Short Term"
I expected to see bearish continuation until the two Fibonacci resistance zones hold. You can read the full post using the link above.
The price is currently holding in the first Fibonacci resistance zone.
Until both the Fibonacci resistance zones hold my bearish view still remains.
If you enjoy this idea, don’t forget to LIKE 👍, FOLLOW ✅, SHARE 🙌, and COMMENT ✍! Drop your thoughts and charts below to keep the discussion going. Your support helps keep this content free and reach more people! 🚀
-------------------------------------------------------------------------------------------------------------------
Disclosure: I am part of Trade Nation's Influencer program and receive a monthly fee for using their TradingView charts in my analysis.

AGL - Bull pending?Are there bulls lurking here ahead of potential rate cuts?
Our Bullfinder-official Team has identified a potential opportunity within ASX:AGL
If price can hold above the $10.00 mark, there may be potential for a re-rating of momentum to 'bullish'.
We would like to note however that below ~$10.00 significant bearish continuation risk comes into play.
We're inspired to bring you the latest developments across worldwide markets, helping you look in the right place, at the right time.
Thank you for reading! Stay tuned for further updates, and we look forward to being of service along your trading & investing journey...
Disclaimer: Please note all information contained within this post and all other Bullfinder-official Tradingview content is strictly for informational purposes only and is not intended to be investment advice. Please DYOR & Consult your licensed financial advisors before acting on any information contained within this post, or any other Bullfinder-official TV content.

USOIL Will Go Down! Sell!
Here is our detailed technical review for USOIL.
Time Frame: 8h
Current Trend: Bearish
Sentiment: Overbought (based on 7-period RSI)
Forecast: Bearish
The market is approaching a significant resistance area 61.191.
Due to the fact that we see a positive bearish reaction from the underlined area, I strongly believe that sellers will manage to push the price all the way down to 56.009 level.
P.S
Overbought describes a period of time where there has been a significant and consistent upward move in price over a period of time without much pullback.
Disclosure: I am part of Trade Nation's Influencer program and receive a monthly fee for using their TradingView charts in my analysis.
Like and subscribe and comment my ideas if you enjoy them!

Crude oil---sell near 63.00, target 60.00-58.00Crude oil market analysis:
The recent crude oil daily line has also begun to decline. Yesterday, the daily line closed negative, and the selling began to decline. Today's idea is to consider selling opportunities near the rebound of 63.00. Crude oil continues to be bearish. No matter the fundamentals or technical aspects, there is no sign of bullishness. Today, crude oil is expected to fluctuate and fall. Don't chase the rebound. We are considering it. In addition, crude oil will also close the monthly line. Pay attention to its monthly line.
Fundamental analysis:
This week is a data week. Starting from Wednesday, big data will be released one by one. In addition, continue to pay attention to the situation of the US dollar and the changes in tariff policies.
Operation suggestions:
Crude oil---sell near 63.00, target 60.00-58.00

WTI Oil H4 | Bearish reversal off an overlap resistance?WTI oil (USOIL) is rising towards an overlap resistance and could potentially reverse off this level to drop lower.
Sell entry is at 62.04 which is an overlap resistance.
Stop loss is at 64.95 which is a level that sits above a multi-swing-high resistance.
Take profit is at 59.18 which is a swing-low support that aligns close to a 61.8% Fibonacci retracement.
High Risk Investment Warning
Trading Forex/CFDs on margin carries a high level of risk and may not be suitable for all investors. Leverage can work against you.
Stratos Markets Limited (tradu.com):
CFDs are complex instruments and come with a high risk of losing money rapidly due to leverage. 63% of retail investor accounts lose money when trading CFDs with this provider. You should consider whether you understand how CFDs work and whether you can afford to take the high risk of losing your money.
Stratos Europe Ltd (tradu.com):
CFDs are complex instruments and come with a high risk of losing money rapidly due to leverage. 63% of retail investor accounts lose money when trading CFDs with this provider. You should consider whether you understand how CFDs work and whether you can afford to take the high risk of losing your money.
Stratos Global LLC (tradu.com):
Losses can exceed deposits.
Please be advised that the information presented on TradingView is provided to Tradu (‘Company’, ‘we’) by a third-party provider (‘TFA Global Pte Ltd’). Please be reminded that you are solely responsible for the trading decisions on your account. There is a very high degree of risk involved in trading. Any information and/or content is intended entirely for research, educational and informational purposes only and does not constitute investment or consultation advice or investment strategy. The information is not tailored to the investment needs of any specific person and therefore does not involve a consideration of any of the investment objectives, financial situation or needs of any viewer that may receive it. Kindly also note that past performance is not a reliable indicator of future results. Actual results may differ materially from those anticipated in forward-looking or past performance statements. We assume no liability as to the accuracy or completeness of any of the information and/or content provided herein and the Company cannot be held responsible for any omission, mistake nor for any loss or damage including without limitation to any loss of profit which may arise from reliance on any information supplied by TFA Global Pte Ltd.
The speaker(s) is neither an employee, agent nor representative of Tradu and is therefore acting independently. The opinions given are their own, constitute general market commentary, and do not constitute the opinion or advice of Tradu or any form of personal or investment advice. Tradu neither endorses nor guarantees offerings of third-party speakers, nor is Tradu responsible for the content, veracity or opinions of third-party speakers, presenters or participants.

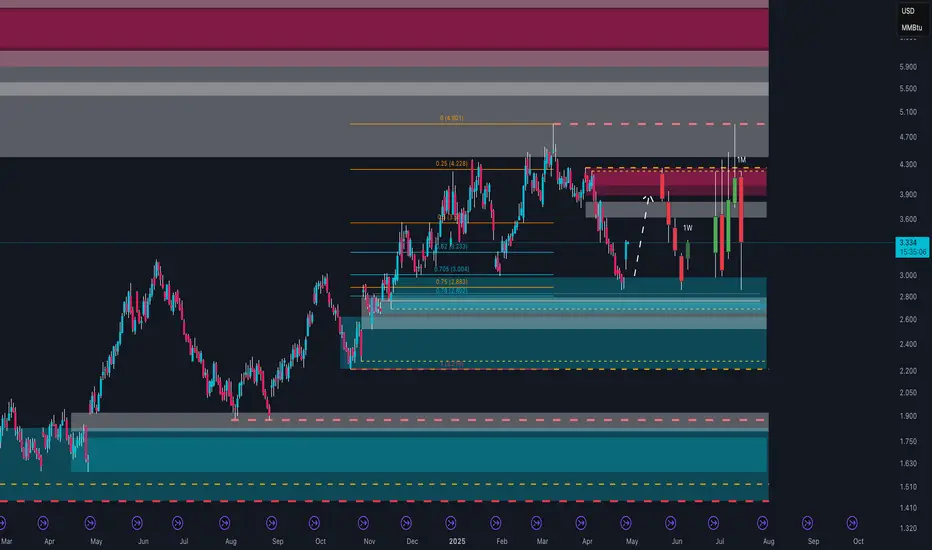
Natural Gas Ready to Explode?In recent months, Natural Gas (NG1!) has shown significant volatility, but now there are clear signals suggesting a major directional move could be imminent.
On the weekly technical chart, price has bounced from a strong demand zone between 2.50 and 2.70 USD/MMBtu, an area historically defended by institutional players. Currently, it is trading above 3.30 USD, consolidating in preparation for the next move. Key resistance zones to watch are between 3.90 and 4.20 USD, a region of high volume confluence and institutional supply.
Retail sentiment is extremely interesting: over 75% of retail traders are currently long. Historically, an excess of retail longs often leads to either corrections or accumulation/distribution phases, as large players tend to act against the majority.
Looking at the COT Report, the data supports the bullish thesis: non-commercials (speculative funds) remain net short, while commercials (physical operators) are increasing their long positions, indicating expectations of higher real demand in the medium term. This is a historically bullish signal, although it may not materialize immediately: commercials often start accumulating well before price movements occur.
Finally, seasonality favors the bulls: historically, from late April through mid-June, Natural Gas tends to perform positively, fueled by storage accumulation ahead of summer and the following winter season.
Strategically, a consolidation phase above 2.90–3.00 USD could serve as a base for larger moves towards 3.90 and eventually 4.90 USD, with the bullish scenario invalidated only below the 2.80 USD area.
USOIL 2025/04/29Scenario USOIL TF H4
- Stick to your stop loss to protect your trades
- Manage your positions patiently until you hit the target
- Profit always in risk, take the risk or lose the chance

WTI CRUDE OIL: Buy signal at the bottom of the Channel Up.WTI Crude Oil turned bearish on its 1D technical outlook (RSI = 42.387, MACD = -1.000, ADX = 27.186) as it crossed under the 4H MA50. Still, it hit and is so far contained at the bottom of the Channel Up, which makes it a strong short term buy opportunity. Aim for the 4H MA200 (TP = 65.00).
## If you like our free content follow our profile to get more daily ideas. ##
## Comments and likes are greatly appreciated. ##


April 28, 2025 - Broken Supply Chains, and the DC CircusHello everyone, it’s April 28, 2025. The week ahead promises to be spectacular (or a complete disaster) depending on which way the wind blows out of Washington. So far, the futures are down about 0.6% this morning, as everyone’s trying to cut risk ahead of a week crammed with Big Tech earnings ( NASDAQ:AAPL , NASDAQ:MSFT , NASDAQ:AMZN , NASDAQ:META ), a mountain of macro data (PCE, GDP, ISM, jobs), and of course, the never-ending Trump tariff soap opera.
On the US politics front, Trump stayed uncharacteristically quiet over the weekend, no new bombshells. But whispers about “talks” with China surfaced, without any real confirmation. Meanwhile, several countries are supposedly rushing to negotiate tariff deals with the US. Expect headlines (and chaos) throughout the week.
Supply chains are starting to crack. Container traffic from China to the US has plunged 60%, and if deals aren’t made by mid-May, we could be staring down empty shelves and layoffs in transport and retail sectors. Think “Black Friday” without anything to buy.
Meanwhile, the drama at the Fed continues. Kevin Warsh, still salty about not replacing Powell, attacked the Fed’s “media circus” style, blaming it for post-Covid inflation. Warsh wants the Fed to go old-school: shut up, protect the dollar, and stop playing superhero. No forecasts, no endless press conferences. Just cigars and silence.
On the macro side, this week’s economic data could turn into a horror show: weak jobs numbers, soft GDP, slowing PCE, all raising the probability of recession. If that happens, expect markets to start begging the Fed to cut rates sooner rather than later.
Assets snapshot:
• BLACKBULL:WTI : $63.36
• OANDA:XAUUSD : $3,307
• INDEX:BTCUSD : $94,000
In short: expect maximum volatility, endless surprises from DC, and a market that could spin on a dime. Stay sharp, stay skeptical, and brace for anything.

USOIL Long Idea#USOIL
Under current market conditions, the area near 62.28 has been identified as a critical support zone, where the AI model detects a high-probability trade setup.
From a technical perspective, a clear directional bias based on recent price action patterns. If the market demonstrates increased volume and price stability above key moving averages in the 62.28 area, traders are advised to monitor for trend-continuation entry opportunities in alignment with the prevailing momentum.
Profit targets are defined at 63.67 and 64.86, corresponding to logical technical resistance zones. These levels are designed for staged profit-taking across different trade management styles. Stop-loss should be strictly enforced at the designated level; once breached, the strategy is considered invalidated in order to limit potential downside.
