Potential Decline of Brent Oil Price to $50 in the Near Future.Brief Overview of Events and News Explaining the Potential Decline of Brent Oil Price to $50 in the Near Future.
➖ Increased OPEC+ Production:
On April 3, 2025, eight OPEC+ countries unexpectedly decided to accelerate production increases, adding 411,000 barrels per day starting in May. This decision triggered a price drop, with Brent falling 6.42% to $70.14 per barrel at the time.
Analysts like Amrita Sen from Energy Aspects noted that this move pressures “lagging” countries to meet quotas, but the market interpreted it as an oversupply signal.
Source: OilPrice.com, "OPEC+ to Raise Oil Production by More Than Expected in May," April 3, 2025 (oilprice.com)
➖ Decreased Demand Due to Economic Challenges:
On April 14, 2025, OPEC revised its 2025 oil demand growth forecast downward by 150,000 barrels per day to 1.3 million barrels per day, citing trade tensions and weak economic indicators. JPMorgan also raised the likelihood of a global recession to 60%.
Source: OilPrice.com, "OPEC Lowers 2025 Oil Demand Forecast on Trade Tensions," April 14, 2025 (oilprice.com)
➖ Trade Tariffs and Global Instability:
On April 3, 2025, U.S. President Donald Trump announced new tariffs on trading partners, heightening recession fears. Fitch Ratings described this as the highest level of U.S. import tariffs since 1910. Brent dropped 4% immediately following the announcement.
Source: OilPrice.com, "OPEC+ to Raise Oil Production by More Than Expected in May," April 3, 2025 (oilprice.com)
➖ Geopolitical De-escalation:
On April 25, 2025, reports emerged of progress in U.S.-Russia talks on Ukraine, as well as Iran’s openness to nuclear negotiations. This reduces geopolitical risks and increases the likelihood of higher oil supply on the market.
Source: OilPrice.com, "Oil Set For Weekly Loss on OPEC+ Supply Rumors," April 25, 2025 (oilprice.com)
Technical Analysis Section:
The monthly chart shows similarities between the 1999–2002 and 2020–2025 periods: an initial impulse, followed by a correction, and then a 6-year upward trend.
Nearest entry point targets at the 161.8% Fibonacci level:
• $52,46
• $49,06
• $46,50
Growth Potential
Medium-term:
• $138,00
Long-term:
• $500,00
Once the price of oil UKOIL reaches $52.46, a review for the entry point will be prepared.
Charts:
•
•
Energy Commodities

Potential Decline of Natural Gas Prices to $2.43–$2.74Brief Overview of Events and News Explaining the Potential Decline of Natural Gas Prices to $2.43–$2.74.
➖ Weather Forecast and Reduced Demand
On April 23, 2025, the U.S. National Weather Service forecasted milder-than-average weather across the U.S. for late spring and early summer 2025, particularly in key gas-consuming regions like the Northeast and Midwest.
Warmer weather reduces the demand for heating, a primary driver of natural gas consumption. This led to a 2.5% decline in Henry Hub natural gas futures, settling at $3.05 per MMBtu on April 24, 2025.
Source: Reuters
➖ High U.S. Natural Gas Inventories
The U.S. Energy Information Administration (EIA) reported on April 17, 2025, that natural gas inventories increased by 75 billion cubic feet (Bcf) for the week ending April 11, 2025, significantly exceeding the five-year average build of 50 Bcf. Total U.S. inventories are now 20% above the five-year average, indicating an oversupply that pressures prices downward.
Source: EIA, "Weekly Natural Gas Storage Report," April 17, 2025
➖ Weak Global LNG Demand
On April 22, 2025, Bloomberg reported a decline in demand for liquefied natural gas (LNG) in Asia, particularly in China, due to an economic slowdown and a shift to cheaper coal alternatives. China’s LNG imports in Q1 2025 dropped 10% year-over-year, reducing export opportunities for U.S. gas producers and adding pressure on domestic prices.
Source: Bloomberg, "China’s LNG Imports Fall as Coal Use Rises," April 22, 2025
Technical Analysis
Natural gas futures (NYMEX) are currently around $3.15 per MMBtu as of April 28, 2025, following a recent decline from a peak of approximately $4.90 in 2025.
Fibonacci retracement levels indicate correction targets at 38.2% ($2.74) and 50% ($2.43).
Fundamental factors, such as oversupply and reduced demand, support a bearish scenario that could drive prices to these levels in the near term.
Nearest Entry Point Target:
• $2.74
Growth Potential:
Long-term:
• $10
Screenshot:

Is this still the ‘Top Trade’ of 2025? (WTI crude oil)It’s not a big secret actually- I’m talking about crude oil!
In the final week of 2024, the team and I highlighted two versions of the WTI crude oil weekly chart and asked ‘is this the top trade of 2024?’
Version 1 has already happened, WTI crude hit $55 per barrel, the downside objective of the smaller triangle pattern on the chart.
Version 2 showed a much larger triangle pattern (which we show again this week) and had a downside target of nearly $30! It would take a lot of conviction to ride the price that far down, but could crude oil still move a lot lower this year?
What’s interesting is that this is still one of the ‘less talked about’ situations in the market today because of the huge volatility seen in both stocks, forex and fixed income.
And I like that nobody’st talking about it - because you don’t want everyone in on it - that means the move could already be over.
Crude oil hit a five-year low. That’s meaningful.
Strong markets don’t hit 5-year lows, weak markets do. And we like to sell weak markets.
Of course, ‘oversold markets’ hit 5-year lows too - and that largely explains the ‘bottom feeders’ who bought WTI crude oil at $55.
Downside volatility got extreme owing to Trump’s tariffs and mean-reversion helped it rebound on news of the 90-day pause, much like stock markets.
I am completely open to the idea that $55 is a multi-year low and essentially marked the bottom. The huge Hammer reversal candlestick pattern adds weight to that idea.
But with the price having hit $65 last week, buying the lows is yesterday’s trade. What do we do today?
We will be looking to do what we said in Week 53 of 2024 in case crude oil turns out to be the ‘top trade of 2025’ as we imagined.
By the way, Brent crude oil has a very similar setup so this is not a ‘US oil’ thing.
There are two parts to trading ‘planning the trade, and trading the plan’.
There isn’t much use in making a plan, and not taking the trade.
There are always reasons not to take a trade- but if it’s a ‘good trade’ that fits the rules of your trading strategy, then those reasons are usually just ‘noise’.
WTI Crude (USO/USD)
Long term chart (weekly)
Trend: Down
Phase: Re-test of breakdown
Resistance = $70
Support = $55
Price action: Price has broken down, rebounded and is now testing the breakdown level, while under the 30-week moving average. Should the price break back over the broken long term rising trendline then we know the idea, or at least the timing on the idea is not right.
View: Bearish while under broken up-sloping long term support

Weekly Market Forecast: Buy Stocks! Sell Oil! Buy Gold!In this video, we will analyze the S&P 500, NASDAQ, DOW JONES, Oil, Gold and Silver futures, for the week of April 28 - May 2nd.
Markets are looking tradeable again.
The indices look bullish, creating +FVGs as they move higher.
Oil has corrected a bearish impulse, so it could be poised to move lower from the Daily and Weekly -FVG.
Gold took a breather last week and could move higher from the Weekly +FVG it just created.
Let's go!
Enjoy!
May profits be upon you.
Leave any questions or comments in the comment section.
I appreciate any feedback from my viewers!
Like and/or subscribe if you want more accurate analysis.
Thank you so much!
Disclaimer:
I do not provide personal investment advice and I am not a qualified licensed investment advisor.
All information found here, including any ideas, opinions, views, predictions, forecasts, commentaries, suggestions, expressed or implied herein, are for informational, entertainment or educational purposes only and should not be construed as personal investment advice. While the information provided is believed to be accurate, it may include errors or inaccuracies.
I will not and cannot be held liable for any actions you take as a result of anything you read here.
Conduct your own due diligence, or consult a licensed financial advisor or broker before making any and all investment decisions. Any investments, trades, speculations, or decisions made on the basis of any information found on this channel, expressed or implied herein, are committed at your own risk, financial or otherwise.

Bullish on USOILAs the chart shows, in the 1 - hour timeframe, USOIL is in an upward - trending channel 📈. The price fluctuates upwards between two trendlines. Despite pullbacks, the uptrend persists, suggesting short - term bullish dominance. Still, the frequent swings reveal ongoing bull - bear market battles.📈
⚡⚡⚡ USOIL ⚡⚡⚡
🚀 Buy@61.5 - 62.0
🚀 TP 63.5 - 65.0
Accurate signals are updated every day 📈 If you encounter any problems during trading, these signals can serve as your reliable guide 🧭 Feel free to refer to them! I sincerely hope they'll be of great help to you 🌟

USOIL: Bearish Forecast & Outlook
The recent price action on the USOIL pair was keeping me on the fence, however, my bias is slowly but surely changing into the bearish one and I think we will see the price go down.
Disclosure: I am part of Trade Nation's Influencer program and receive a monthly fee for using their TradingView charts in my analysis.
❤️ Please, support our work with like & comment! ❤️

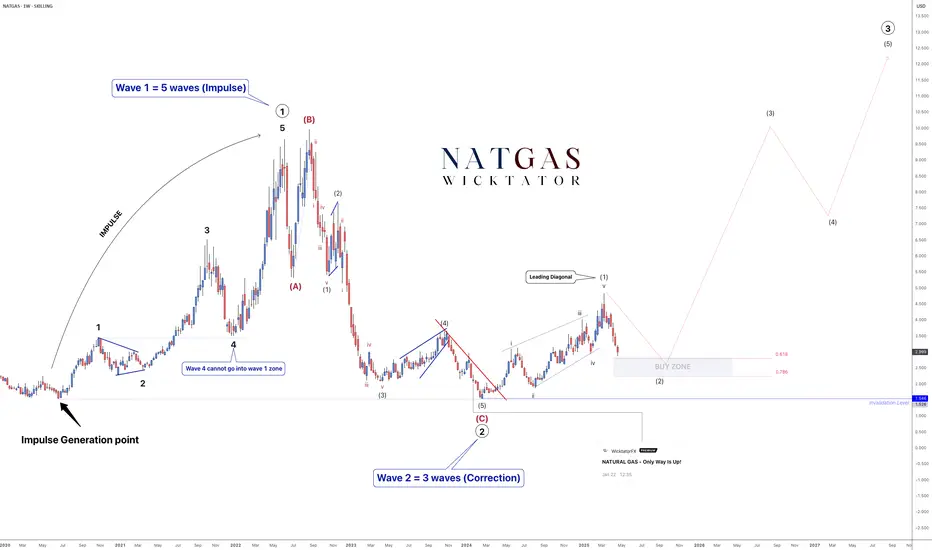
NATGAS Elliott Waves – Preparing for a Multi-Year Rally!Following our last post on Natural Gas, we have now seen a breakout, suggesting the start of a larger bullish wave — a move that could last multiple years.
From a technical perspective:
- Wave 1 (5-wave impulse) is complete.
- Wave 2 (ABC correction) is also complete.
- We are now in Wave 3, which itself will form 5 subwaves.
Wave 3:
Subwave 1 of Wave 3 has formed as a leading diagonal.
We are now in Subwave 2, which typically retraces around 61.8% of Subwave 1.
Our buy zone is positioned around this retracement area, and we will be looking for a lower timeframe breakout to confirm entries.
Important note:
Subwave 2 could form a more complex ABC correction, so patience is required while it develops.
Trade Plan:
- Wait for price to reach the buy zone.
- Look for lower timeframe bullish confirmation (trendline break, BOS, structure shift, etc.).
- Enter after confirmation.
Stoploss Placement:
- Aggressive option: Below the corrective low.
- Conservative option: Below the broader invalidation level.
Targets: 8, 10, 12
See below for our last NatGas analysis:
USOIL Opening Trends and Trading Strategies Next WeekTrend Analysis
As shown in the chart, in the 1 - hour time frame, USOIL is moving within an upward - trending channel 📈. This channel is defined by two trendlines, and the price is fluctuating upwards within it. Although there have been pullback trends during this period, the overall trend remains upward. This indicates that in the short term, the bullish forces are relatively dominant, driving the price to gradually climb 📈. However, the frequent price fluctuations also reflect a certain degree of game - playing between the bulls and bears in the market 🤺.
⚡⚡⚡ USOIL ⚡⚡⚡
🚀 Buy@61.5 - 62.0
🚀 TP 63.5 - 65.0
Accurate signals are updated every day 📈 If you encounter any problems during trading, these signals can serve as your reliable guide 🧭 Feel free to refer to them! I sincerely hope they'll be of great help to you 🌟

CRUDE OIL Move Down Ahead! Sell!
Hello,Traders!
USOIL was making a
Bullish correction but
It is in the downtrend
Overall, so as the price
Is hovering beneath the
Horizontal resistance
Of 64.80$ from where
We will be expecting a
Local bearish correction
Sell!
Comment and subscribe to help us grow!
Check out other forecasts below too!
Disclosure: I am part of Trade Nation's Influencer program and receive a monthly fee for using their TradingView charts in my analysis.

BRIEFING Week #17 : AAPL's fate is the SP'sHere's your weekly update ! Brought to you each weekend with years of track-record history..
Don't forget to hit the like/follow button if you feel like this post deserves it ;)
That's the best way to support me and help pushing this content to other users.
Kindly,
Phil

Surge Energy (SGY) Elliott Wave Outlook26/04/25 SGY Update
I’ve been long Surge Energy since Jan 24. Price did move higher initially following my entry but has since ground lower in what looks like an ending diagonal pattern in red C of a larger ABC zig zag correction. There is RSI divergence on the weekly time frame which helps the case that SGY could be bottoming, but that will of course be effected by what the price of oil does.
Any further downside on SGY I will be looking at the yellow zone which contains the 786 retracement at $3.9, measured move target of the red A wave at $3.28 & 886 retracement at $2.64. There is an ending diagonal invalidation level at $3.2, if this is tagged, I will need to adjust the current count.
The completion of Red C will complete the (X) wave of the higher degree (W)(X)(Y) in yellow, from these levels the (Y) wave target will be $16-$17.

USOIL: Bears Are Winning! Short!
My dear friends,
Today we will analyse USOIL together☺️
The market is at an inflection zone and price has now reached an area around 63.133 where previous reversals or breakouts have occurred.And a price reaction that we are seeing on multiple timeframes here could signal the next move down so we can enter on confirmation, and target the next key level of 62.366..Stop-loss is recommended beyond the inflection zone.
❤️Sending you lots of Love and Hugs❤️

ENIC, 1W Trend Reversal Setup and Breakout AnticipationOn the weekly chart of ENIC, a broad expanding triangle formation transitioning into a base accumulation structure is visible. The price is now approaching a critical resistance zone around $3.90–$4.00, an area that previously triggered major reversals. Currently, the market is consolidating just below this resistance, forming a platform for a potential breakout and retest.
Technical structure:
- EMA 50, EMA 100, and EMA 200 are starting to converge, signaling the potential for a bullish crossover — a key indicator of mid-term trend reversal.
- The 0.618 Fibonacci retracement at $3.25 has been broken and price is stabilizing above it, reinforcing the bullish setup.
- Higher lows and higher highs have been established — a clear early sign of a new upward trend.
- Volume during the consolidation phase remains stable without signs of heavy distribution or capitulation.
Fundamental analysis of Enel Chile:
- Sector: Energy, Renewable Energy Transition
- Enel Chile is aggressively expanding into green energy, reducing its coal generation portfolio and investing heavily in solar and wind projects.
- Financials: The company maintains stable dividend payouts and holds a manageable debt-to-cash-flow ratio.
- Chile’s national energy policy shift towards renewable energy and international demand for clean energy solutions provide strong long-term tailwinds.
- Global trends favor companies with sustainable energy models, positioning Enel Chile strategically for growth.
Structural targets:
After a successful breakout above $3.90 and a retest confirmation, the next upside targets are:
- $4.61 (0.382 Fibonacci retracement)
- $5.45 (0.236 Fibonacci retracement)
- Extended channel and Fibonacci target: $6.81
Enel Chile (ENIC) is building a mature base structure for a long-term bullish reversal. A confirmed breakout above $3.90, combined with bullish EMA alignment, would unlock a strong upside scenario toward and beyond $6.00. Both technical formation and fundamentals strongly support this outlook. This is a structure you don't want to miss.

Buy idea on Crude Oil (CL1!)Based on :
- US10Y Leading long spike
- Commercials and Non Commercials at Extremes
- Open Interest at Extremes
- Cycles and quantitative data
- Undervalued conditions
-Demand zone

Chevron: The Chart’s Reaching a Critical PointChevron is starting to look very interesting again — but let’s be clear from the start: Chevron, like every oil giant, lives and dies by the price of oil. If oil rips higher or collapses due to global politics, supply shocks, or economic chaos, Chevron NYSE:CVX follows. No exceptions.
That said, what we’re seeing on the chart right now is increasingly pointing toward a deeper correction — specifically down to the $113–$100 zone. That would make sense structurally as a Wave 4 retracement.
But there’s a technical nuance here. Wave 1’s high sits at $103 — and depending on how strict your Elliott Wave rules are, Wave 4 dipping into Wave 1 is bad territory. Personally, I’m okay with a brief touch into that range, but I don’t want to see price hanging around below $103 for long.
From a trend perspective, we’re clearly in a downward channel. We just saw a textbook bull trap:
Chevron broke out with a solid +7% move over two weeks,
Followed immediately by a massive 22% drop,
One of the sharpest two-week declines since — yeah — March 2020, pandemic levels.
Now, price is hovering around $130, and the setup is simple:
If this level holds, great — maybe we’re bottoming.
If it breaks, I’m looking to buy between $113 and $100. That’s where the structure aligns, the volume kicks in, and risk/reward starts to make sense again.
So here’s the real question:
Do we see $200 first — or $100?
I’m leaning $100 first.
Not because I’m bearish long-term— but because that level would clean up the chart, shake out the noise, and give us a real shot at riding the next strong leg higher with conviction.
Would love to hear what you think — where’s your bet?

USOIL Potential UpsidesHey Traders, in today's trading session we are monitoring USOIL for a buying opportunity around 60.80 zone, USOIL is trading in an uptrend and currently is in a correction phase in which it is approaching the trend at 60.80 support and resistance area.
Trade safe, Joe.

April 25, 2025 - Trump’s Tango, Tech, and Insider DramaHello everyone, it’s April 25, 2025. We’re closing in on Trump’s 100-day mark back in the White House, and if there’s one word to sum up his impact on markets: chaos. With 137 executive orders signed already, he’s turned global markets into a high-stakes rollercoaster though this week saw signs of recovery, confidence remains fragile, and volatility is still running the show.
The main trigger? You guessed it: Trump and his tariff diplomacy. After weeks of U-turns, threats, and NYSE:TWTR meltdowns, he’s finally announced that talks with China have begun. That was enough to send the AMEX:SPY up 2%, pull the CME_MINI:NQ1! out of correction territory (+2.74%), and ignite a 5.63% jump in the Philadelphia Semiconductor Index, even though it’s still miles below its all-time high.
OANDA:XAUUSD is sitting at $3,332, BLACKBULL:WTI hovers around $63.21, and INDEX:BTCUSD has skyrocketed to $93,200. Not bad for a week that started in total disarray.
Now here’s where things get fishy: US indices started climbing before Trump’s announcement—classic “somebody knew something.” Insider trading? Just your average Thursday. And while Trump claims talks are underway, the Chinese side played coy, denying any ongoing negotiations. Either someone’s lying, or the talks are happening over dim sum in DC.
Beyond geopolitics, NASDAQ:GOOG crushed earnings expectations and added a juicy dividend and GETTEX:70B in buybacks, exploding 6% after-hours. Meanwhile, NASDAQ:INTC flopped—flat profits, poor outlook, and a CEO trying to turn cost-cutting into a growth story. The market wasn’t buying it: down 5.7% after-hours.
NYSE:NOW , though, is living its best life. Strong results, AI momentum, and federal contracts boosted shares 15%. Other names like NASDAQ:PEP , NYSE:PG , and NASDAQ:AAL warned on the future thanks to—you guessed it—political and economic uncertainty.
On the macro front, ECONOMICS:USIJC (US jobless claims) ticked higher, inflation seems to be cooling, and if next week’s PCE and employment data confirm the slowdown, the Fed might just blink and cut rates in May. Market hopes are pinned on Powell holding steady—unless, of course, Trump decides to live-tweet through it.
Futures are up 0.37% ( CME_MINI:ES1! ) this morning, signaling optimism—possibly misplaced—in Trump’s “friendly” overtures toward China. Let’s just say we’re one golf game away from another market tantrum.
Enjoy your weekend, stay alert, and cross your fingers for a quiet Sunday tweet-wise.

CRUDE OIL BEARISH WEDGE|SHORT|
✅CRUDE OIL has formed a
Bearish wedge pattern and
Then made a breakout and a
Pullback so we are locally
Bearish biased and we will
Be expecting a further
Bearish move down
SHORT🔥
✅Like and subscribe to never miss a new idea!✅
Disclosure: I am part of Trade Nation's Influencer program and receive a monthly fee for using their TradingView charts in my analysis.

$BTC $GOLD Performance% Comparison Chart (Apr '24-Apr '25)Performance% Comparison Chart (Apr '24-Apr '25)...
CRYPTOCAP:BTC surges back, locking in a 42% gain alongside TVC:GOLD over a year! S&P 500 shows life, but #Oil is the big loser, taking the biggest hit with a brutal -26% decline. Let's watch the shifts! But where does the momentum go next?!🤔
CRYPTOCAP:BTC TVC:GOLD SP:SPX MARKETSCOM:OIL
Cheers!

USOIL ANALYSISHello friends
Everything is clear on the chart for you, our probability is price growth to the specified areas.
Be sure to observe risk and capital management.
*Trade safely with us*

OIL...SHORT BLACKBULL:WTI
is approaching the key resistance zone at .
I'm watching closely for a valid reaction before considering any position.
***If the level breaks and price retests it successfully, I may consider a counter-directional setup.

WTI crude about to resume lower?WTI formed a large bearish engulfing candle on its daily chart yesterday near the key $65 resistance level. Was that an indication that prices have ended their corrective bounce? Time will tell, but today's oil prices have bounced back. With the trade uncertainty in the background, demand concerns remain high.
So, I wouldn't be surprised if prices were to resume lower from here. The trend is clearly bearish with the moving averages all pointing lower, not to mention the lower highs and lower lows.
If the selling resumes, watch for possible bounces at the next key round handles like $62, $61 and $60. But there is always the possibility of a sweep below this month's earlier lows if macro concerns intensify.
Meanwhile, the bullish idea is off the table for me for now until we see some progress in US-China trade talks at least, or if prices show a major bullish reversal signal.
By Fawad Razaqzada, market analyst with FOREX.com

Crude oil---sell near 64.00, target 63.00-62.00Crude oil market analysis:
Recently, crude oil has been running up. Yesterday, the daily line had a technical retracement under the pressure of 65.00. Today, we are still bearish. Let's continue to sell when it rebounds. There is still a lot of room for crude oil to fall. Today's crude oil rebounded near 64.00 and sold. If it breaks below 60.00, it will open up a new space for a big drop. The recent data and fundamentals of crude oil are suppressing it. Buy today and expect a big rebound.
Operational suggestions:
Crude oil---sell near 64.00, target 63.00-62.00
