USOIL Is Bearish! Short!
Please, check our technical outlook for USOIL.
Time Frame: 2h
Current Trend: Bearish
Sentiment: Overbought (based on 7-period RSI)
Forecast: Bearish
The market is approaching a key horizontal level 66.402.
Considering the today's price action, probabilities will be high to see a movement to 64.925.
P.S
We determine oversold/overbought condition with RSI indicator.
When it drops below 30 - the market is considered to be oversold.
When it bounces above 70 - the market is considered to be overbought.
Disclosure: I am part of Trade Nation's Influencer program and receive a monthly fee for using their TradingView charts in my analysis.
Like and subscribe and comment my ideas if you enjoy them!
Energy Commodities

ADANI GREEN ENERGY Ready to FIRE ( LONG TERM IDEA ) !!!Weekly counts for ADANI Green Energy are recommended, with a bullish wave structure.
Both appear to be optimistic, and this stock's invalidation number is 758.
Investing in declines is a smart move for long-term players.
Long-term investors prepare for strong returns over the next two to five years.
The energy sector has a promising future.
Every graphic / chart used to comprehend the theory of elliot waves, harmonic waves, gann theory, and time theory
Every chart is for educational purposes.
We have no accountability for profit or loss.

DIESEL OIL GOES 'STILL-RUNNING', AND IT IS NOT A MEME AGAINDiesel Oil NY Harbor ULSD December 2025 futures contracts are trading around $2.25/gallon, once again above its 52-week average, with recent technical ratings indicating a strong buy.
The market has shown a 4.50% rise in the past 5-Day time span, reflecting bullish momentum.
Fundamental Perspective
Supply: Distillate inventories are 20% below the five-year seasonal average, the lowest since 2022. Refinery utilization is high at 94.7%, leaving little buffer for disruptions.
Demand: Distillate consumption has risen to 3.794 million barrels per day, up 260,000 b/d year-over-year, driven by robust industrial activity and summer travel.
Geopolitics: A U.S.-brokered ceasefire in the Middle East has reduced immediate supply risks, but the situation remains fragile and could quickly change.
Macroeconomic Risks: While fundamentals are bullish, potential U.S. recession risks and data reporting delays add uncertainty. Monitoring GDP growth and manufacturing PMIs is crucial.
Summary
ULSD futures are technically strong and fundamentally supported by tight inventories and robust demand, but traders should remain vigilant for macroeconomic and geopolitical shifts.
--
Best wishes,
@PandorraResearch Team 😎

CRUDEOIL1! at Best Support Zone !!This is the Daily Chart of CRUDEOIL1!.
CRUDEOIL1! having a good law of polarity at 5500-5600 level .
CRUDEOIL1! is currently trading between its quarterly pivot 5603 level and monthly pivot 5805 levels , indicating a range-bound movement."
Once the Crudeoil1! sustains above the monthly pivot, it may trigger a potential upside rally."
If this lop is sustain , then we may see higher prices in CRUDEOIL1!
Thank You !!

USOIL - Bearish Double TOPHello Traders !
The USOIL failed to create a new higher high!
The price formed a double top pattern.
Currently, The neckline is broken !
So, I expect a bearish move📉
________________
TARGET: 64.960🎯


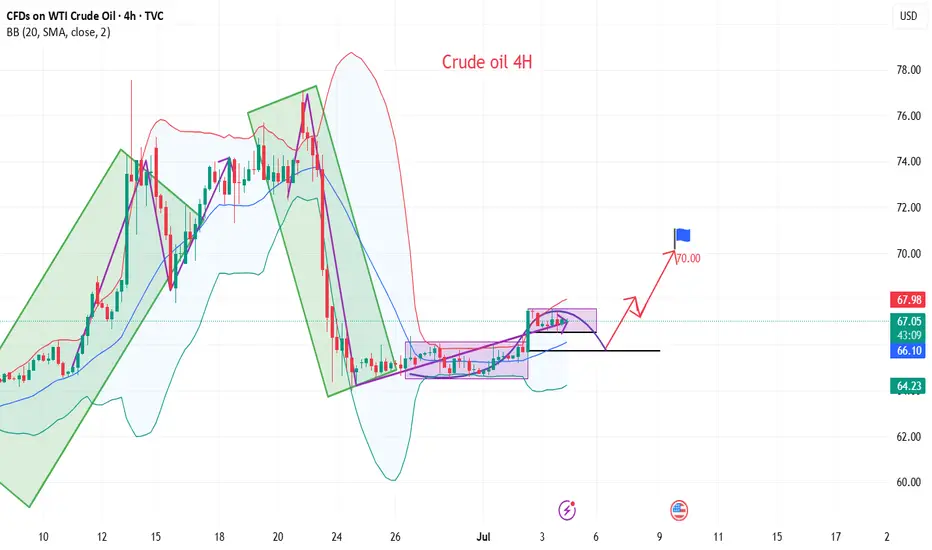
OIL fell sharply, opportunity for upside target of 70$OIL fell sharply and has now been in a contraction for a while, I am taking it into account for a potential breakout, as it shows tightening price action, which reflects market indecision.
Price action has now coiled into a symmetrical triangle, this is often a classic continuation or reversal pattern, and it’s building pressure for a potential breakout. So, if we do get a clean breakout above this pattern, with strong bullish candles, volume, or bullish divergence, that’s your confirmation cue.
This is totally achievable. It aligns beautifully with the 0.25 to 0.5 Fibonacci retracement zone from the recent swing high to low. It’s not just a psychological round number, it’s technically supported.
If the lower boundary of the triangle is broken with momentum, you’ve got to step back. No trade is better than a bad one. Watch how price interacts with the zone. If it loses it, you could be looking at a deeper leg down, potentially revisiting deeper support levels from prior bullish structure.

WTI Oil H4 | Potential bearish reversalWTI oil (USOIL) could rise towards a pullback resistance and potentially reverse off this level to drop lower.
Sell entry is at 68.28 which is a pullback resistance.
Stop loss is at 70.90 which is a level that sits above the 50% Fibonacci retracement and a pullback resistance.
Take profit is at 63.86 which is a pullback support that aligns closely with the 161.8% Fibonacci extension.
High Risk Investment Warning
Trading Forex/CFDs on margin carries a high level of risk and may not be suitable for all investors. Leverage can work against you.
Stratos Markets Limited (tradu.com ):
CFDs are complex instruments and come with a high risk of losing money rapidly due to leverage. 63% of retail investor accounts lose money when trading CFDs with this provider. You should consider whether you understand how CFDs work and whether you can afford to take the high risk of losing your money.
Stratos Europe Ltd (tradu.com ):
CFDs are complex instruments and come with a high risk of losing money rapidly due to leverage. 63% of retail investor accounts lose money when trading CFDs with this provider. You should consider whether you understand how CFDs work and whether you can afford to take the high risk of losing your money.
Stratos Global LLC (tradu.com ):
Losses can exceed deposits.
Please be advised that the information presented on TradingView is provided to Tradu (‘Company’, ‘we’) by a third-party provider (‘TFA Global Pte Ltd’). Please be reminded that you are solely responsible for the trading decisions on your account. There is a very high degree of risk involved in trading. Any information and/or content is intended entirely for research, educational and informational purposes only and does not constitute investment or consultation advice or investment strategy. The information is not tailored to the investment needs of any specific person and therefore does not involve a consideration of any of the investment objectives, financial situation or needs of any viewer that may receive it. Kindly also note that past performance is not a reliable indicator of future results. Actual results may differ materially from those anticipated in forward-looking or past performance statements. We assume no liability as to the accuracy or completeness of any of the information and/or content provided herein and the Company cannot be held responsible for any omission, mistake nor for any loss or damage including without limitation to any loss of profit which may arise from reliance on any information supplied by TFA Global Pte Ltd.
The speaker(s) is neither an employee, agent nor representative of Tradu and is therefore acting independently. The opinions given are their own, constitute general market commentary, and do not constitute the opinion or advice of Tradu or any form of personal or investment advice. Tradu neither endorses nor guarantees offerings of third-party speakers, nor is Tradu responsible for the content, veracity or opinions of third-party speakers, presenters or participants.

Crude oil moves up alternately during the day
💡Message Strategy
WTI crude oil prices snapped a three-day winning streak and were trading around $66.00 a barrel in early European trading Thursday. Crude oil prices fell as rising U.S. crude inventories heightened concerns about weak demand in the United States, the world's largest oil consumer.
📊Technical aspects
From the daily chart level, crude oil fluctuates upward in the medium term and tests around 78. The K-line closes with a large real negative line, which has not yet destroyed the moving average system and is still supported. The medium-term objective upward trend remains unchanged.
However, from the perspective of momentum, the MACD indicator crosses downward above the zero axis, indicating that the bullish momentum is weakening. It is expected that the medium-term trend of crude oil will fall into a high-level oscillation pattern.
The short-term trend of crude oil (4H) fluctuated and consolidated for two trading days. The oil price repeatedly crossed the moving average system, and the objective trend direction fluctuated. From the perspective of the primary and secondary rhythms, the current rhythm is a secondary oscillation rhythm. According to the law of primary and secondary alternation, the subjective trend still maintains an upward direction. In terms of momentum, there are signs of weakening upward momentum, and it is expected that the crude oil trend will continue to be mainly upward.
💰Strategy Package
Long Position:65.50-66.00,SL:64.50,Target:69.00-70.00
Brent Crude Oil Long Swing Setup – Support Break at Key LevelBrent Crude Oil OANDA:BCOUSD has broken to the next key support level after a cease-fire announcement in the Middle East. A long position is considered only if support holds at $69.00.
📌 Trade Setup:
• Entry Zone: $69.00
• Take Profit Targets:
🥇 $73.50 – $76.00
🥈 $79.00 – $83.00
• Stop Loss: Daily close below $67.00
#BrentCrude #OilTrading #ForexTrading #LongPosition #SupportLevel #TradeSetup #CrudeOil #MarketAnalysis #TradingOpportunities #Commodities #OilMarket #Investing #PriceAction #OilPrices #TradingStrategy #ForexCommunity #InvestmentOpportunities #MarketUpdate

Nat Gas; Dip then RipA slight breather as expected for NG prices after such a strong reversal, from the storage report lows on 6/27/2025. Support for NG based on volume looks to be in the $3.55 to $3.65 range, before continuing a move up to $4+. NYMEX:NG1!

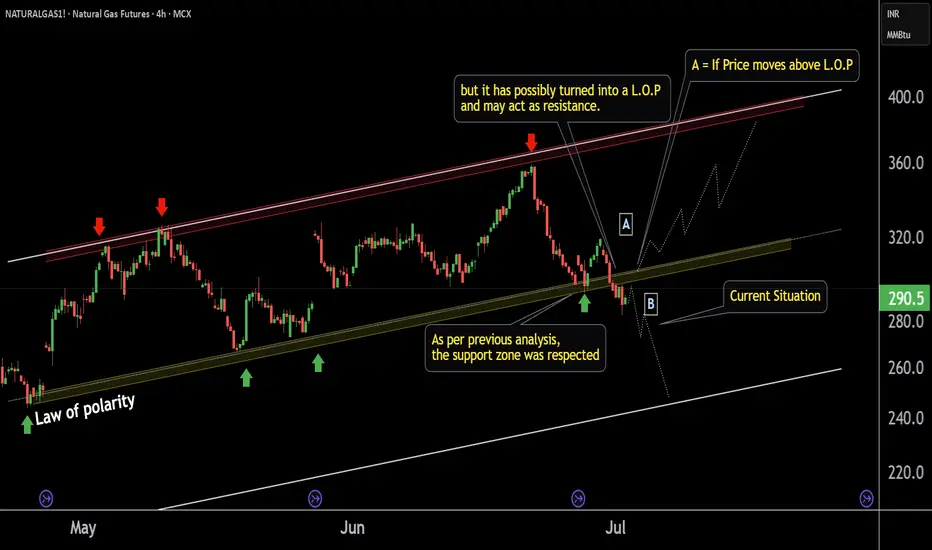
NATURALGAS1! Short time Breadkdown Alert !!This is the 4 hour chart of Natural Gas Futures.
NATURALGAS1 has given a short-term channel breakdown; the previous support may now possibly act as resistance at 300 level.
The breakdown target is the lower boundary of the broader channel, which may now act as support near at 240 level.
If lop is sustain then we may see lower prices in NATURALGAS1.
Thank You !!
USOIL BEARS ARE GAINING STRENGTH|SHORT
USOIL SIGNAL
Trade Direction: short
Entry Level: 66.89
Target Level: 61.90
Stop Loss: 70.21
RISK PROFILE
Risk level: medium
Suggested risk: 1%
Timeframe: 8h
Disclosure: I am part of Trade Nation's Influencer program and receive a monthly fee for using their TradingView charts in my analysis.
✅LIKE AND COMMENT MY IDEAS✅

CRUDE OIL (WTI): Consolidation is Over
Crude Oil was consolidating for 6 trading days in a row
after a test of a key daily support.
The yesterday's Crude Oil Inventories data made the market bullish
and the price successfully violated a minor resistance of a sideways movement.
We can expect that the market will grow more.
Next resistance - 69.27
❤️Please, support my work with like, thank you!❤️

USOIL is Nearing the Daily TrendHey Traders, in tomorrow's trading session we are monitoring USOIL for a buying opportunity around 64.30 zone, USOIL is trading in an uptrend and currently is in a correction phase in which it is approaching the trend at 64.30 support and resistance area.
Trade safe, Joe.

Sudden Oil Spike - what you need to know!Iran suspended cooperation with the U.N. nuclear watchdog, amid a surprise build in US crude inventories.
Iran’s move added a modest risk premium to prices, though analysts noted that no actual supply disruptions have occurred.
$66 is a key level for WTI crude to hold above.
If it can maintain this area, we will likely see higher price. $66 is a multi year trendline of support going back to 2021.
Energy stocks / XLE basket is showing some bullish divergence, perhaps indicating this oil move has legs.

NATURAL GAS - Who can Predict this wild beast?Natural gas got demolished today, down over 8%.
The one headline we saw hitting the tape that is having some partial influence:
"Vessel Arrives at LNG Canada to Load First Cargo, Strengthening Global Supply Outlook – LNG Recap"
Today, we did hedge our core long UNG position with a short dated $56 put on EQT.
We are already green on that trade and looking for $56 level to come into play.
Natural gas volatility sure trades in a world of its own which is why it is key to size accordingly.

USOIL:Narrow trading strategy
USOIL: There is no update in the past two days, because the oil price still continues to fluctuate in a narrow range, and the space for volatility is gradually reduced, which is not very different from our overall trading idea. The original long target of 65.9-66.4 can be adjusted to 65.8-66.2 with the reduction of the space for volatility. It is expected that the trend will come out this week, and we will adjust our thinking then.
Friends who do not trade at present can refer to the interval trading strategy within a day:
BUY@64.7-65
TP: 65.8 to 66.2
SELL@65.8-66.2
TP: 64.7-65
More detailed strategies and trading will be notified here ↗↗↗
Keep updated, come to "get" ↗↗↗

USOIL:Today's trading strategy
Oil prices have been sideways for the fourth trading day, volatility began to narrow, the market is brewing a new round of trend, short-term range 64-66.4. Today you can sell high and buy low around a narrow range.
Trading Strategy:
BUY@64.7-65.1
TP: 65.9-66.4
SELL: 66-66.4
TP: 65.1-64.5
More detailed strategies and trading will be notified here ↗↗↗
Keep updated, come to "get" ↗↗↗

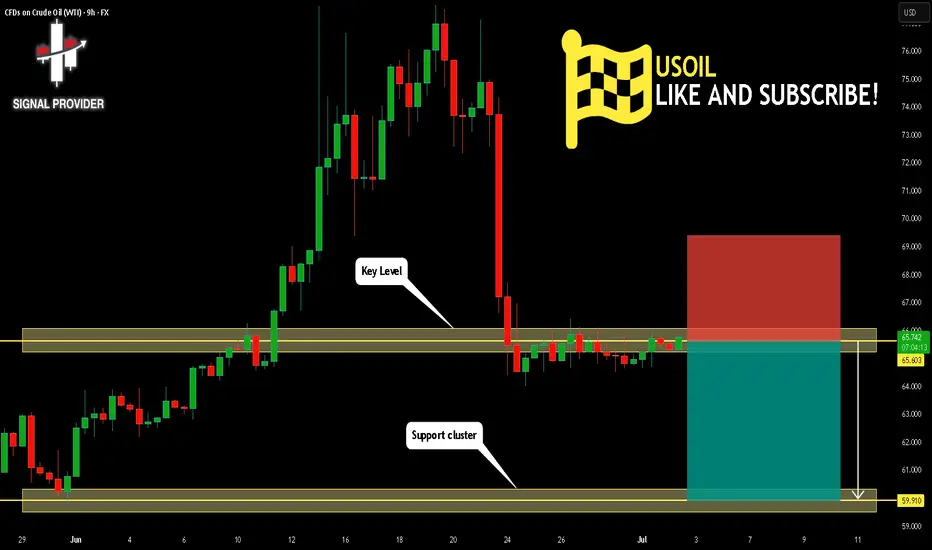
USOIL Will Fall! Sell!
Take a look at our analysis for USOIL.
Time Frame: 9h
Current Trend: Bearish
Sentiment: Overbought (based on 7-period RSI)
Forecast: Bearish
The market is testing a major horizontal structure 65.603.
Taking into consideration the structure & trend analysis, I believe that the market will reach 59.910 level soon.
P.S
The term oversold refers to a condition where an asset has traded lower in price and has the potential for a price bounce.
Overbought refers to market scenarios where the instrument is traded considerably higher than its fair value. Overvaluation is caused by market sentiments when there is positive news.
Disclosure: I am part of Trade Nation's Influencer program and receive a monthly fee for using their TradingView charts in my analysis.
Like and subscribe and comment my ideas if you enjoy them!
WTI Oil H4 | Potential bearish reversalWTI oil (USOIL) is rising towards a pullback resistance and could potentially reverse off this level to drop lower.
Sell entry is at 67.15 which is a pullback resistance that aligns with the 23.6% Fibonacci retracement.
Stop loss is at 70.90 which is a level that sits above the 50% Fibonacci retracement and a pullback resistance.
Take profit is at 62.51 which is a swing-low support.
High Risk Investment Warning
Trading Forex/CFDs on margin carries a high level of risk and may not be suitable for all investors. Leverage can work against you.
Stratos Markets Limited (tradu.com ):
CFDs are complex instruments and come with a high risk of losing money rapidly due to leverage. 63% of retail investor accounts lose money when trading CFDs with this provider. You should consider whether you understand how CFDs work and whether you can afford to take the high risk of losing your money.
Stratos Europe Ltd (tradu.com ):
CFDs are complex instruments and come with a high risk of losing money rapidly due to leverage. 63% of retail investor accounts lose money when trading CFDs with this provider. You should consider whether you understand how CFDs work and whether you can afford to take the high risk of losing your money.
Stratos Global LLC (tradu.com ):
Losses can exceed deposits.
Please be advised that the information presented on TradingView is provided to Tradu (‘Company’, ‘we’) by a third-party provider (‘TFA Global Pte Ltd’). Please be reminded that you are solely responsible for the trading decisions on your account. There is a very high degree of risk involved in trading. Any information and/or content is intended entirely for research, educational and informational purposes only and does not constitute investment or consultation advice or investment strategy. The information is not tailored to the investment needs of any specific person and therefore does not involve a consideration of any of the investment objectives, financial situation or needs of any viewer that may receive it. Kindly also note that past performance is not a reliable indicator of future results. Actual results may differ materially from those anticipated in forward-looking or past performance statements. We assume no liability as to the accuracy or completeness of any of the information and/or content provided herein and the Company cannot be held responsible for any omission, mistake nor for any loss or damage including without limitation to any loss of profit which may arise from reliance on any information supplied by TFA Global Pte Ltd.
The speaker(s) is neither an employee, agent nor representative of Tradu and is therefore acting independently. The opinions given are their own, constitute general market commentary, and do not constitute the opinion or advice of Tradu or any form of personal or investment advice. Tradu neither endorses nor guarantees offerings of third-party speakers, nor is Tradu responsible for the content, veracity or opinions of third-party speakers, presenters or participants.

LNG Bull Market: How Geopolitics and Demand Are Fueling XNG🔥 The Natural Gas market presents a compelling risk/reward opportunity with strong fundamental support from ⚖️ supply/demand imbalances and 🌍 geopolitical factors. The technical chart shows a healthy 📊 consolidation after the explosive 🚀 February–March rally, with the potential for another leg higher.
📌 Key Investment Thesis:
• 📈 Structural bull market driven by demand growth outpacing supply
• 🌐 Geopolitical premium supporting price floor
• 🌦️ Weather-driven volatility creating trading opportunities
• 🛳️ LNG export growth providing long-term demand foundation
🧭 Recommended Approach:
• 💰 Accumulate positions on weakness near $3.00–$3.40 levels
• 🎯 Target initial resistance at $4.00, with extended targets at $5.00+
• ⚠️ Maintain disciplined risk management with stops below $2.60
• 👀 Monitor weather patterns and geopolitical developments closely
📊 Risk Rating: MODERATE TO HIGH (due to volatility)
💵 Return Potential: HIGH (⏫ 50–100% upside potential over 12–18 months)
❗ This analysis is for informational purposes only and should not be considered as financial advice.
⚠️ Natural gas trading involves significant risk and volatility.
📚 Always consult with a qualified financial advisor and conduct your own research before making investment decisions.

Natural Gas - Silver Lining!Natural gas is ending the day with a daily bottoming tail.
Potentially forming an inverse head and shoulder pattern that takes us above the key $3.83 level.
We took profits on our EQT put hedge! The put contract went up over 100%
Lets see if Nat gas can build some pressure.
