GBPAUD ...4H view..after formation of great pinbar candle in weekly timefram with bullish engulfing candle and formation of inverted H&S pattern in 4h and daily timefram ... i will go long with GBPAUD specially after breakage of the neck line (NL) ... goodluck.
Engulfing Candle

SPX: Is it a BUY now? Only if it does this.Hello traders and investors! The index hit the 4,456 today again, and as we have been saying, this is the most important resistance to defeat. As long as it stays under this point, it won’t be bullish for real. Let’s see what’s going on here.
In the 1h chart, the index is in a bear trend, and the only thing that could make it reverse is the breakout of the 4,456, in my view. If we do, probably the index will fill the gap at 4,481, and seek the next resistance at 4,521.
If it doesn’t react quickly, it’ll just keep dropping, probably to the 4,400 again, or even lower. Let’s look for more clues in the daily chart:
The index just hit its 50% retracement, and it is doing a good reaction. Yesterday, we had a classic Bullish Engulfing candlestick pattern, which is great, but we still must break the 4,456. Keep in mind that the 4,456 is at the same time the 38.2% retracement and it is near the 21 ema in the daily chart, making it the most important resistance level in multiple time frames.
The 4,400 is at the same time the 50% retracement and the previous top on March, and if the index loses this point, the 61.8% retracement would be our next stop (4,345).
Since the SPX is still inside our “danger zone”, my neutral view didn’t change, and I will only believe in a bullish reaction if we break the 4,456, or in a bearish reaction if we lose the 4,400. I prefer to see a bullish reaction, because the Risk/Reward ratio favors the bulls (the upside potential is higher than the downside potential).
Since I do daily analysis on the SPX, I’ll keep you guys updated on this every day, so remember to follow me to keep in touch with my future analyses.
Have a great Holiday/Weekend.

LONG ON GBP/ZNDGreat setup on the GBP/NZD
Price is coming out of a major support zone with a massive bullish engulfing candle and momentum.
This is a very long term swing play:
Here is the play I will be taking on this pair:
P = 1.84739
SL = 1.84739 - 733 PIPS
TP = 2.05051 - 1297 PIPS

Potential Bearish Shark EntryWe have a MACD bearish crossing up here after testing the PCZ a few times and getting rejected.

AUDUSD shortOANDA:AUDUSD
Expecting a bearish movement on AUDUSD with price breaking structure on the 1H. On the DAILY and WEEKLY timeframes a long wick(shooting star candlestick) formed on a major/key level of resistance. Price also broke support and is making a retest

USDCAD Buy analysis for the week, probability is high and trust So you can see the reason of the bias written in the chart as you can see. we got the King high broken and we getting the retest to the valid Orderrblock, the whole move reacted of a valid OB and killed a inducement OB before hand. so I know it will switch to a bullish market this week. Trade safe and enjoy

FANG is not holding up.Happy Weekend Everyone.
I put together a custom FANG Plus index to track the overall strength of the popular large cap growth stocks as these stocks have been the most widely held stocks for the past several years. This particular chart is a weekly candle chart using Fibonacci retracement levels taking the previous low from the past calendar year to the last high. As you can see the index retraced 100% of the previous 1 year move and then rallied back to the 50% retracement level. However that 50% retracement level proved to be hard resistance as we can see on the chart. Moreover, the last three weekly candles completed a bearish evening star pattern and the closing weekly candle is a bearish engulphing. While the two patterns are not text book perfect, the main tenets are in place IMO. Also bearish is that the basket of stocks could not hold the 30 Week EMA. RSI seems to confirm this negative setup. The RSI did get into positive territory during the rally from the low, but it failed to hold and fell back into the bearish regime. If the downtrend continues the 78% retracement level could offer support. Seasonality says that stocks should do well for April. It doesn't say that all stocks should do well. Time will tell. Anyway I found this interesting.
Good luck to all.
NASDAQ:AMZN
NASDAQ:AAPL
NASDAQ:GOOG
NASDAQ:FB
NASDAQ:NVDA
NASDAQ:ADBE
NASDAQ:MSFT
NASDAQ:NFLX
NASDAQ:TSLA
On another note, I have Carolyn Boroden's book on Fibonacci Trading but I find it lacking. If anyone has a good book recommendation on Fibonacci please leave it in the comments below. Thank you!

GBPUSD ShortOANDA:GBPUSD
GBPUSD broke support and made a retest at 61.8% fib prz. It further made a bearish engulfing candle on the lower timeframes
and the EMA and SMA crosses gave extra confirmation for a sell setup.

LONG ON GBP/CHFPrice has risen from a major support zone on this pair.
We have a bullish engulfing candle that has broken above the 50 period moving average with volume.

[Candlestick Patterns] Just need to know these three!#Candlestick #CandlePattern #Tocademy #Tutorial
Hello traders from all over the world, this is Tommy =)
I was unexpectedly surprised by many of you who liked and supported my last post about the basic concept of TA(Technical Analysis). Today I prepared a brief lecture about the Candlestick Pattern, one of the most fundamental phenomenon and behaviors that traders must be well-informed. In fact, we should be very familiar with these textbook contents and interpret it in a glimpse on the technical chart unconsciously. Just like we don't pay direct attention about each breathes when breathing, like we don't care each and all of the alphabets when we speak, or like we don’t perceive location of each keyboards every moment as we type, this very technique should be performed automatically and quickly by observing dominant formations of candlestick bars.
As a matter of fact, comprehending market trends and price actions only by referring to the candlesticks is yet too spurious. It should be used in such a way to weight on certain scenarios in a macroscopic view, rather than deriving precise and specific PRZ(Potential Reversal Zone)s and distinguish the accurate market trend. It’s never like ‘The price must go up because this pattern just appeared’. Furthermore, I strongly believe that the reliability of the candlestick pattern strategy is declining especially in recent financial market, where we encounter countless non-traditional and abnormal situations that were not very common in the past. Hence among the existing ‘Textbook’ candlestick pattern strategies that can easily be found on Google, there are particular patterns that are still very reliable on current market and there are ones that are not as reliable as it used to be. So here, I will organize everything very clearly for you guys.
The technical chart is well known as sort of a map tracing the mob-psychology of all the stakeholders in the market. Investors’ sentiments such as FUD(Fear, Uncertainty, and Doubt) and FOMO(Fear of Missing Out) that often cause panic buy/sell are visualized as data. Those with a clear understanding of the fundamental nature of how candlesticks are being formed, don’t even need to memorize these patterns one by one. As I emphasized at my previous post, candlesticks should be interpreted as a whole structure, unlike the line chart expressed in one-dimensional. Candlesticks are newly formed in each time interval and we can choose the timeframe for the chart that we are about to analyze. For instance, each candlestick in a daily chart is formed every day while each candlestick in a 5minute chart is formed every 5 minutes. Higher the timeframe of the chart is, longer-term the scope within the chart is. It is important as a TA analyst to start from macro-perspective with higher timeframe first, then go deeper to lower timeframe and find short-term factors.
There are four independent prices composing a candlestick: open, high, low and close price. Open price indicates the starting point while close price indicates the ending point of a candlestick. Just like the wording, high/low prices are formed at the highest/lowest price during the time period of candlestick being formed. A bullish candlestick is when the closing price is above the opening price (i.e., when the price rises), while a bearish candle is when the closing price is below the opening price (i.e., when the price is falling), and the two are expressed in different colors (green & red or red & blue). The thick part between the opening and closing price is called the ‘Body’, and the thin part is called the ‘Tail’ (Wick or Shadow).
Typically, the length of the body implies the strength of an ongoing trend. We learned from the textbook that the candlesticks with a longer body means stronger trend and those with shorter tails mean clearer trend. Back in the days, there was time when we could detect if whales are involved and deduct impulsiveness of ongoing trend when distinctly long bodied candlesticks with relatively high trading volumes take places. I am afraid to tell you that it is better to erase that memory. First of all, it is too obvious and cliché to announce that the long candlesticks with high volumes mean strong market trend. This criterion itself is quite vague and not 100% reliable to identify future trends or find insightful signals. Moreover, in recent days (especially in Crypto), whales like to deceive retail traders with a strong faith of trading volumes and since the future markets are becoming bigger, giving too much weight on trading volume paired to each candlestick is not as effective as it was when textbook used to work very well. I am not saying textbook is wrong. It just needs slight updates since the market we are dealing with keeps changing over time.
In TA world, closing price of a candlestick carries a great meaning and thus closing prices at higher timeframes should very well be monitored to become a successful trader. Sometimes whales even battle aggressively right before a major closing time often causing a weird ‘scam’ moves with a high volume. As shown below, we usually find the price and time when certain TA variables (such as top/bottom of trendline, channels, pivot levels, and other indicators) are broken, meaning if the price has penetrated those variables successfully, in order to find breakout entries, stoplosses, and target prices, etc. This whole concept of breaking above or below is quite vague, subjective, and relative idea. So, what we traders refer to as a reliable criterion is confirming whether the candle closed above and below the factors. For instance, let’s say that we are seeking and waiting for the breakout of the downward trendline. Well sometimes it’s not as easy as expected to precisely spot and determine whether the price has successfully pierced through the trendline. There are times when price breaks the trendline, but ends up coming back below leading close price of the candlestick to be formed below the trendline like the case 2 below. In this very case, it’s difficult to determine whether the breakout happened successfully or not. Nevertheless, like case 3, when both closing and high prices are formed above the trendline, we can clearly confirm and weight more on the breakout scenario, expecting more bullish rally.
Okay let's get to the point. In recent financial trading market, it's enough to know just these three.
1. Engulfing
2. Doji
3. Long Tailed Candlestick
As mentioned above, there’s nothing hard if you understand the essential concepts and principles of the above patterns and phenomena. The engulfing candlestick is a phenomenon in which the body of the previous candle is consumed by the body of the next candle, that is, a larger body than the previous one comes out. In other words, if a new bullish candle closes higher than the previous open price or if a new bearish candle closes lower than the previous open price, we say ‘the new candlestick engulfed the previous one’. If we look closely, this pattern implies the circumstance where the new candle completely overwhelms the trend of the previous candle and reverses it into a new trend despite closing the price from above or below. However, the appearance of an engulfing candle does not mean that the trend is unconditionally reversed. It is often the case that engulfing candles take place consecutively, with the second candle taking over the body of the first candle, the third’s taking over the second’s, the fourth’s taking over the third’s and so on. As the price fluctuates up and down, it creates a Widening or Broadening pattern also known as expanding sort of shapes, making it difficult for traders to figure out the current trend. In this circumstance, the entry prices, stop loss prices, target prices, or average prices of many participants in the market tend to be located relatively nearby. This price range or region is called a HVP(High Volume Profile or Peak) or an Orderblock and I will cover details about this concept later on another post. Anyway, there are numerous methods to derive Orderblock and one of them is to spot bodies of the consecutive engulfing candlesticks.
The tail(wick) of a candlestick can be interpreted as a sign of the fierce battle between the bulls are bears. Longer tail signifies bigger collision between buying and selling forces. The longer the upper tail, the more the bulls trying to raise the price up but the bears rejecting them eventually sellers ending up being dominant and vice versa for the longer the lower tail. Generally, when the long upper/lower tails are formed at a relative higher/lower part of the wave structure or at a distinctive pullback as a PRZ this can be a possible signal of trend reversal. Due to my personal trading experience, it doesn't matter much in recent TA market whether the long-tailed candlestick is a bullish or bearish. In other words, regardless of the color of Hammer or Shooting star (which are both long-tailed candlestick pattern), it’s better to check if the next following candlesticks are being formed opposite direction of the tail. Personally, I don't think the Inverted Hammer and Hanging Man are not as necessary as it used to be in the old days.
When the length of the candlestick’s body is relatively short meaning if the open and close prices are very close, forming a cross like shape, it’s called a Doji. Since Doji has a short body, the upper and lower tails tend to come out longer and thus can be considered as evidence of a tense confrontation between the bulls and bears that eventually ends up reaching a balance. Similar to the long-tailed candlestick, Doji is also known as a sign of a PRZ depending on the next appearing candlesticks. When Dojis are observed after swing high or low, it can be a possible indicator that the on-going trend is overheated and you might want to anticipate some pullbacks. However, it is too risky to directly assume that the top or bottom is near just because of Doji. Especially in the market these days, Dojis also appear frequently in sideways and sometimes confuses traders searching for a clear trend.
As emphasized above, as with other technical techniques, theories, and indicators, always remember to weight more to the emergence of patterns in higher timeframes and longer-term perspectives. The higher timeframe people globally refer to, the more the reliability the TA will be. Just think about it for a second. Which timeframe do you think that people consider more significantly about the closing price, a 5 minutes chart or a daily chart? I would obviously say that the price signals from the daily cart is relatively more representative and reflect longer-term than those of the 5 minutes chart. Keep in mind is that you also need to understand market trends from a macro perspective before approaching towards short-term perspective. It is always recommended to recognize long-term trends or situations in advance from the candlestick of a higher timeframe, and then look at more detailed and microscopic elements step by step.
All right. I will wrap up now. Thanks for reading my post.
Your subscriptions, likes, and comments are a huge inspiration for me to write more posts!

GBPUSD ShortOANDA:GBPUSD
GBPUSD broke structure and made a retest on resistance along with a bearish engulfing candle

Bearish signs on EUR/USDHello everyone. Here we have the EUR/USD daily chart. The trend here is still bullish, but we have to keep in mind that the trends of higher time frames are bearish, and we also have a few bearish signs on the daily chart. First, as you can see, the price tried to climb higher, but after that we could see the W&R pattern and the downward action started. Also, the whole situation is not in favor of the EUR at all. There are many worrying factors that pose a big risk to the EUR and with that in mind there is no reason to be bullish on the EUR. So, on the daily chart we have a perfectly formed bearish engulfing pattern that suggests a downward continuation. From a technical point of view, strong support is around 1.0900, where we also have Yearly Pivot Support 1. Strong resistance is around 1.1121. However, I don't expect the price to drop to 1.0900 without any correction, so some retracements could happen, as always. My suggestion is to take advantage of the first retracement that will happen and find a good short entry.

UNVR broke the trend lineAfter broke thre trend line with high volume, the price got exhausted and need more demand to continue the new trend after reversal. So thre price will retrace. There are two areas of demand. For this case, I will pay attention to the price action instead of putting limit order.
If the price show reversal pattern (can be pin bar or engulfing candlestick) in the first demand zone (rectangle), I will buy. If the price still continue the pullback, I will set the limit order in the second demand zone (the lower rectangle).


Gap Fill to take us down 36%Showing extreme amounts of bearish divergence on the daily, breaking immediate trendline and bearishly engulfing on the daily a pullback to the $326 area seems likely.

GBPUSD LongOANDA:GBPUSD
GBPUSD broke resistance/neckline yesterday on the reverse head and shoulder pattern.
Price pushed up and later retested at 38.2% with a bullish engulfing candle giving buy setup.

GBPUSD LONGOANDA:GBPUSD
An inverse head and shoulder pattern has formed on GBPUSD as price breaks bearish structure, price should break neckline/resistance to validate a bullish move on GBPUSD

Bearish Engulfing formed on daily charts of Nifty50Bearish engulfing candle which is considered to be bearish pattern formed on daily charts of Nifty.

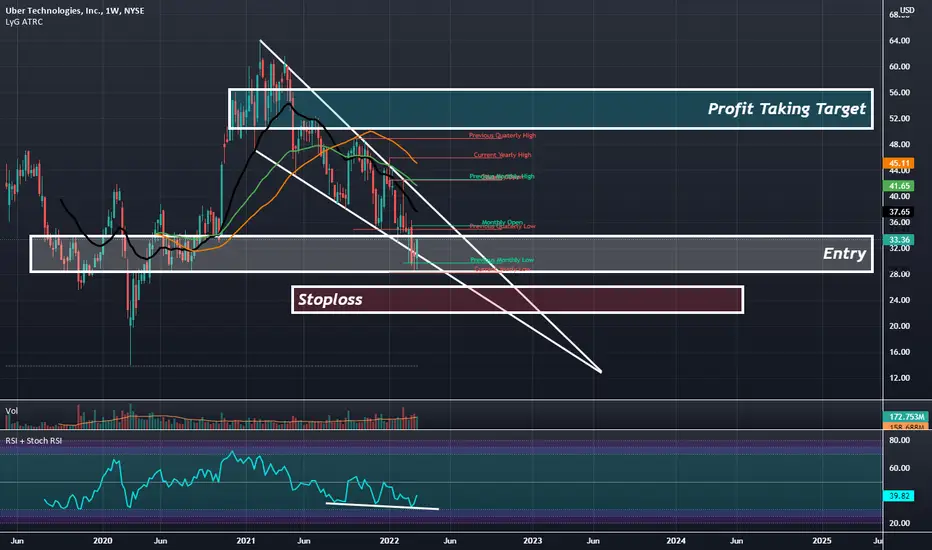
UBER: Weekly Morning Star Doji Within a Falling WedgeUber right now is at the bottom half of a Falling Wedge and has printed a Weekly Bullish Engulfing Candle against a Morning Star Doji at a Horizontal Support and at RSI Support and looks like it's preparing to begin a new major move back up from here.
CRM - Adam & Eve reversalThis recent rebound in CRM could have momentum for a sustainable swing up with a confluence of the following technical factors:
1. mini Adam & Even bullish pattern locking in the near term bottom
2. Tested a longer term support zone (apparent on weekly chart)
3. Formation of a strong bullish engulfing weekly candle
4. Good RSI strength (>50)
Theoretical swing target of between 240-248 (gap fill). Will we get there?
Disclaimer: TA is about improving our odds of a successful trade (not a guarantee). This is just my own analysis and opinion for discussion and is NOT a trade advice. Please your own due diligence and trade according to your own risk tolerance and don't forget that money management is important! Cheers.

Dollar failed to clear previous high, targeting previous supportAbsent a clear escalation in Russian-Ukrainian tensions and a FOMC meeting scheduled for this Wednesday, the outlook remains cautious. The dollar index is stable.
At 99.30 points, we can see the bearish price action forming around the previous high, and the 30 minutes timeframe shows that DXY has broken below the previous low support and formed a new lower low, which makes me believe that DXY is going to move lower during the day to reach its previous low support of 98 points.

AUDUSD SHORTList of confluences:
1: Double Top/ M Pattern at high.
2: Bearish engulfing candle stick pattern
3: Key Level Breakout
Risk reward for this trade is a around: 3.62:1

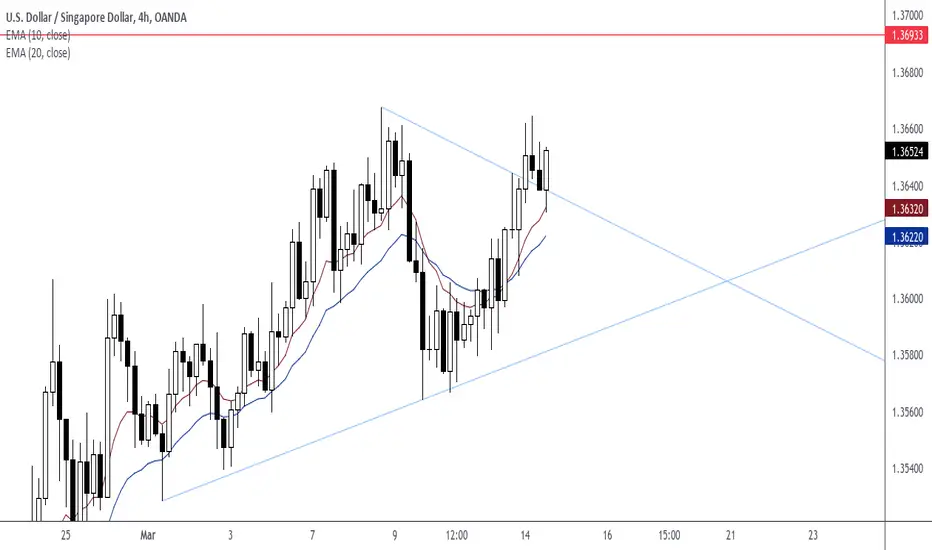
Take Profit: 1.36933 (USDSGD)Price closed above diagonal resistance. Diagonal resistance becomes support after price closed above level.