NZDCHF - 4H BEARISH ENGULFING SETUPNZDCHF has formed a significant bearish engulfing on the 4 hour time frame.
The bearish engulfing candle engulfed 4 previous candles and closed at 8am CST Friday.
SL set at engulfing candle body high. TP set at 3X risk.
Sell limit set at 50% retracement level.
Engulfing Candle

BTCUSD - H4/H1 - MAGICAL CLOUDS !H4 :
Once again the clouds acted perfectly well on both sid e, in rejecting, respectively
a downside breakout attempt around 60'000 and more recently an upside breakout
around 63'600.
In addition, price action on the top of the clouds, triggered a "BEARISH ENGULFING"
pattern.
Ongoing downtrend channel still in place and clouds area should be seen as a barometer
for further development.
Indeed, IMPLICATIONS a clear breakout of :
1) UPSIDE : 63'000/63'500 (former congestion top) would open the door for ---> a retest of ATH
2) DOWNSIDE : 61'500/61'000 (MBB & KS cluster and clouds support zone) would put the focus on ---> former
low @ 59'500 ahead of lower levels; 56'525 is the 38.2% Fib retracement of the 39'590-66'994 rally and 55'147 is
the Kijun-Sen or base line !
H1
Price action switched from an uptrend channel to an ongoing downtrend channe l and this change has been
triggered by a "doji" which has been confirmed straight away by a long black candle (bearish engulfing)
Currently below both MBB and TS and flirting with the KS important support level in this H1 time frame.
A failure to hold above 62'763 would directly put the focus on the 62'000 area, ahead 61'600 and 61'000 (the latter
level being the bottom of the H1 clouds support zone.
In order to neutralise this ongoing downside move price action, the BTCUSD should quickly recover above 63'000 and hold sustainably on a closing basis; this
would temporary neutralise the current ongoing selling pressure.
Do you like my analysis ?
If yes, please do not forget, to like it and to add me on your following list :-)
Many thanks in advance.
Have a nice trading day and all the best-
Take care
Ironman8848

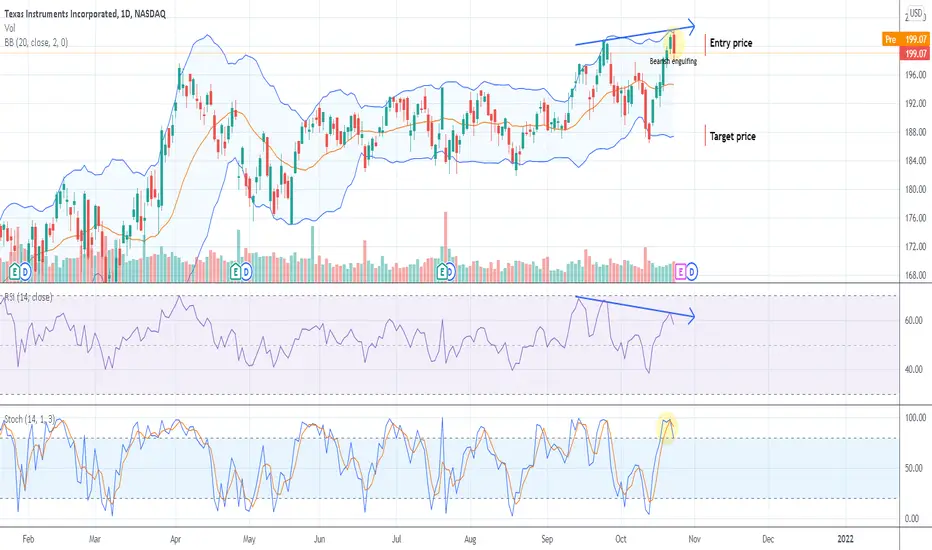
TXN shortEntry price: 199-201$
Target price: 186-189$
Bollinger bands: the price approached the upper boundary
RSI: bearish regular divergence, therefore, the price retracement is likely to occur
Stochastic: the asset is overbought
Candle pattern: bearish engulfing
Conclusions: All indicators suggest trend reversal in the near future. Thus, the short position is recommended.
No financial advice
What are candlesticks in trading and how to use them?🕯
✅The price dynamics of an asset are displayed on the chart in different formats, including bars, lines, or candles. The latter format is most popular among traders and is often used in technical market analysis. What are candles and how to work with them?
🟢Candlesticks (Japanese candlesticks) are a graphical way of displaying price dynamics, in which vertical rectangles and lines are used. This method was invented on the rice exchanges of Japan in the 17th century, from where it got its name.
A price candle consists of two main elements:
1️⃣the body is a vertical rectangle that shows the opening and closing levels of trades;
2️⃣wicks (shadows, tails) - vertical lines from above and below the body of the candle, reflecting fluctuations in value in the interval between opening and closing.
❗️The main advantage of a candle over bars and a linear chart is that it allows you to get 4 important indicators for technical analysis at once:
High - the highest price for the period;
Low - the lowest price for the period;
Open - the opening price of the period;
Close - the closing price of the period.
🔴When using a linear graph to get the same information, 4 indicators would have to be displayed on the screen at once, which is inconvenient and complicates the perception of information.
At the same time, candles display the process of cost formation in a specific time interval, so the position and appearance of candles on the hourly and daily periods will differ significantly
Types of candles
⚠️Two main types of candlesticks correspond to market trends:
Bullish candle - formed when the closing price of the period was higher than the opening price. On the chart, such a candle is displayed in green (on b / w - white) and indicates the victory of buyers in this time.
A bearish candle - is formed if the period is closed at a price lower than it was opened. On the chart, bearish candlesticks have a red color (on b / w - black) and they show that sellers are dominating at the moment.
❤️ Please, support our work with like & comment! ❤️

MAC DailyNYSE:MAC looking good with a bullish engulfing bar today with MACD confirmation and a chart that is making higher lows.

CANDLESTICK PATTERNS BASICS | Engulfing Candle 📚
Hey traders,
In this educational post, I want to discuss with you one of the most accurate REVERSAL candlestick patterns - the engulfing candle.
On EURUSD chart, I spotted for you bullish & bearish examples of this pattern.
The logic behind this pattern is quite simple:
⭐️In a bullish trend, after a strong directional movement, the price reaches some important structure level. Growing steadily and forming a sequence of green bullish candles the price suddenly forms a strong bearish candle.
What is particular about that candle is the fact that its total range (distance from the wick high to wick low) & body range (distance from body open to body close) exceed the ranges of a previous bullish candle.
🔻Such a candle we will call a bearish engulfing candle.
Most of the time it signifies a strong spike in selling volumes and willingness of sellers to push.
With a high probability, such a formation leads to a pullback or even a trend reversal.
⭐️In a bearish trend, after a strong short rally, the price reaches some demand cluster. Instead of breaking that and going lower, the price forms a strong bullish candle.
That candle engulfs the range of the previous bearish candle & its body size exceeds the size of the previous candle.
🟢Such a candle we will call a bullish engulfing candle.
Quite often such a formation leads to a pullback or even a trend reversal.
🔔And there is just one single tip that will dramatically increase your performance trading the engulfing candle:
It is recommended to rely on this pattern ONLY IF it is formed on a key level:
❗️Bullish engulfing candle must strictly form on a strong support.
❗️Bearish engulfing candle must strictly form on a strong resistance.
Forming beyond key levels, the pattern occasionally will give false signals.
⏳Preferable time frames to trade engulfing candles are daily/4h.
Learn to spot this pattern & you will see how efficient it is.
What candlestick patterns do you want to learn in the next posts?
❤️Please, support this post with like and comment!❤️

NZDCHF - (D) IN TREND BEARISH ENGULFING SETUPNZDCHF has formed a significant bearish engulfing on the daily time frame
Entry at the 50% retracement level has been perfectly rejected 3 times.
The bearish engulfing candle engulfed 5 previous candles.
The daily time frame bearish engulfing candle closed Wednesday.
SL set above engulfing candle high. TP set at 3X risk.

EURGBP - 4H Short In Trend Bearish Engulfing SetupEURGBP has formed an in trend engulfing setup on the 4H time frame. The engulfing candle nearly engulfed 6 previous candles but didn't quite clear the previous candle high but the daily and weekly time frames supported this setup. Also, nearly all other EUR pairs are very bearish.
The daily candle closed below a previous strong bullish engulfing. The weekly time frame has been bearish for the past 6 weeks.
The 4am EUR retail sales high impact news event set up this trade.
The engulfing candle closed @8am (CST) on Wednesday.
Entry at 50% retracement level.
SL set above engulfing candle high. TP set at 3X risk.

Cool Entry Strategy - Bullish Engulfing in Key LevelsYou are here to read about one of my best crypto-tested entry strategies, Bullish Engulfing in Key Levels . It’s a price action strategy and I’m going to explain its details but, even if you are not good at price action stuff, you could use it as well as I can. There are no requirements for dealing with this strategy except using two indicators.
The base success rate of this strategy was over 60% for me and by applying some filters and considering some best practices and being experienced in it, I could increase its success rate up to 76%.
This strategy is a combination of a Bullish engulfing candlestick pattern, pivot points, and key levels. By key level, I mean a trend line or a horizontal resistance/support line drawn by you or your added indicator. We can assume the base requirement of the strategy meet if a Bullish Engulfing (BE) pattern takes place near a key level or a pivot point.
We will use the Trend Key Point indicator to draw horizontal key levels and key points. It marks pivot points with a sign above and below the candles. If the pivot point is important, the indicator will draw a horizontal line as a key level. In this strategy the LL pivots are important to us. All necessary details will be applied to your chart by adding the indicator to it. You can also read more about Trend Key Point guide and best practices here .
There is also an indicator for finding and highlighting Bullish Engulfing patterns called Common Candlestick Patterns . By adding the indicator, you will see too many highlighted patterns because there are active by default. Therefore, after adding the indicator to your chart, you need to open its options and uncheck all except the Show Bullish Engulfing one to highlight just Bullish Engulfing patterns.
After adding indicators, you need to wait and capture entry points in a suitable state. But there are some tips and best practices we need to jot down to distinguish between good and bad states and increase the success rate of the strategy. I list below:
Ignore a BE pattern that does not occur at a key level or is far from key levels.
It’s a good sign if the BE pattern occurs on an LL pivot point (a candle that has a star under it) which meets a key level.
BE pattern must have an acceptable and strong body. You can ignore weak candles.
Ignore the BE pattern formed just below a resistance or potential reversal area.
It excites me to see a BE pattern at the lower point of the price but a BE at the end of correction sounds good too.
If the BE pattern occurs on the LL pivot seeing a key level and the volume also confirms that by crossing the VMA20 (volume moving average length 20), you can enter definitively.
If the entry requirements are met, the closing price of the BE pattern will be my entry point.
Do not enter if the green candle of the BE pattern is abnormally big. You can wait for a pullback or you can ignore the pattern.
BE pattern in the bottom of a range box could also be a good chance to enter but you have to be careful where the range is.
As you read before, this article is about finding the entry point and after clarifying that it's time to find out where you need to put your stop loss and your take profit but, these topics not fit in this article. You can refer to the other available resources covering these topics.
Both of the indicators mentioned are developed by myself, so I tried to apply my best practices to them. I hope it was useful for you. Feel free to submit your comment to improve the strategy or the indicators.

HUL - 12/10/2021 Engulfing HUL - 12/10/2021 Engulfing Closing 2675
enter in between 2600- 2680
Plan Your Trade
:)

How To Trade Support Resistance Levels with Price Action Signal Wait for a Price Action Signal to form at the following support resistance levels.
EMA 10 Level
EMA 20 Level
Fibonacci Level
Horizontal Level
Set Target at the next support resistance level. Set Stop Loss Below EMA 20 Price and Low Price of Price Action Signal Candlestick. Enter at close price of Price Action Candlestick.
Engulfing Candlestick at Support Resistance Levels

XAUUSD Good buy area!Hey guys,
Based on the chart there is a good buy opportunity for XAUUSD. So lets check the chart with us and see what is happening:
------------------------------------------------------------------
1. Breaking the bearish trend line ( Bullish )
2. Bullish Engulfing candlestick ( Bullish )
3. Breaking a resistance area strongly and a pullback is happening ( Bullish )
------------------------------------------------------------------
So these 3 reasons and good risk reward ratio lead me to be buyer at this area. We're trying to consider both bullish or bearish signals in each chart and compare them with each other. But at this chart we don't see bearish signals right now.
** Considering risk management rules is a necessity!
Finally it was our idea about the next movement of XAUUSD. So lets see what do you think? bullish or bearish? Your idea is valuable for us so please bring your reasons in comments.
Thanks for being and supporting us!

GBPNZD - 4H Short In Trend Engulfing SetupGBPNZD formed a significant bearish engulfing of 7 candles at 8am (CST) on the 4H time frame.
ECB President Lagarde speech @7am helped form this setup.
SL set above engulfing candle body high. TP set at 2X risk.

EURJPY - 4H Long In Trend Engulfing Setup EURJPY formed a bullish engulfing that engulfed 5 candles on the 4 hour time frame.
This engulfing candle closed at 12pm noon (CST) on Friday.
SL set below engulfing candle low. TP set at 2R for safe entry, 3R for 50% entry.

CADJPY - 4H Long In Trend Engulfing SetupCADJPY formed a bullish engulfing that engulfed 5 candles on the 4 hour time frame.
This engulfing candle closed at 12pm noon (CST) on Friday.
SL set below engulfing candle low. TP set at 2R for safe entry, 3R for 50% entry.


USDJPY Idea 9/30/2021Hello traders, this is an idea for USDJPY. Nice double top on the 4 hour time frame. Two possible scenarios.
1. Price could retest and go long to form a nice head and shoulders and then retest neckline (111.200) and go short from there.
2. Price can breakthrough 111.200 and retest 111.000 and then go short from there.
If you agree, give this chart a like and follow for more
Trade responsibly.

XAUUSD Idea 9/30/2021
Hello traders, this is an idea for XAUUSD. A nice bullish engulfing on the daily. Let see price retest 1749 - 1750 and then we can see some great long opportunities. I want to see price hit 1803
If you agree, give this chart a like and follow for more
Trade responsibly.

audnzd harmonic crab patternaudnzd has a textbook bearish harmonic crab set up on the 1 hour time frame with a bearish engulfing candlestick pattern that follows . short and put stop loss above the bullish candle for confirmation of setup at a 10 pip risk. usually Sl would be above harmonic reversal zone but since we have confirmation candle lets keep our risk even smaller and a instant profit trade

XAUUSD Good sell opportunity!Hey guys,
Based on the chart price is in a good situation for opening sell positions on XAUUSD. But let's go deeper on our reasons and see what's on the chart:
1. Price is in a downtrend ( Bearish )
2. A correction have happened --> price reached to 0.618 Fibonacci and dropped ( Bearish )
3. Bearish Engulfing Candlestick ( Bearish )
4. Currently price is in an uptrend channel ( Bullish )
5. Hidden divergence on RSI(14) ( Bearish )
So based on our analysis the bearish movement is more possible than the bullish one. So it leads us to be seller which have more probability and makes good risk reward ratio.
One good trading scenario for this case is waiting for the price to reach to the top of the channel and opening sell positions regarding to considering risk management rules.
So it is our analysis about XAUUSD. But please let us know what do you think about it? Buy or Sell and why? Any idea would be welcome and valuable for us.
Good luck!

Bullish Shark Double Bottom: Bullish Divergence and EngulfingWe got Bullish Divergence after double bottoming and bullishly engulfing on the second bottom at the PCZ of a potential Bullish Shark. I have a stop below the engulfing candle.

JICPT| Strong holder zone works for BTC, what's next? Hello everyone. The strong holder zone in my previous idea worked well for BTC. What's next for the crypto?
Let's recap why I marked the zone as strong holder. It's whole number of $40000 with long-term MA and flip structure. Now, the formation is even better, a bullish engulfing candle.
So I'm bullish on BTC for the short term. The level needs to be closely watched is $47000. If that level is firmly conquered, next target is $50000.
What do you think? This is a very quick and simple analysis. I didn't mention the big four players as I used to.
Give me a like if you're with me. Thanks for your support.

AMD: Complete Multi Time Frame Analysis (H, D and W charts)!Hello traders and investors! Let’s see how AMD is doing today! It has been a while since I analyzed it, so we have a lot to update. This is going to be a Multi-Time Frame Analysis (MTFA) and we’ll study the 1h, D and W charts.
First, in the 1h chart, we see that the short-term trend is clearly bullish, the only problem is the resistance at $ 106 , which worked as a resistance multiple times in the past.
Now it is the best time for a pullback to the 21 ema, and this wouldn’t ruin the bull trend – in fact, it would be an opportunity to buy at a cheaper price . If we break this resistance, we’ll seek the next resistances in the daily chart:
Considering that AMD did a false breakout from the previous support at $ 106.98, and that we have a congestion in the mid-term, we can assume that AMD will seek the next resistance at $ 114.49. But remember: We must defeat the first resistance in the 1h chart.
This congestion is annoying, but it seems to be just a sideways correction when you analyze the long-term trend:
In the weekly chart, AMD is in a clear bull trend, and the pullback seen in the past weeks might be just the price trying to get closer to the previous support level around the $ 99s (black line) . In addition, we are just above the 21 ema.
Now that AMD reached this support, it is doing a nice Bullish Engulfing , a classic bullish reversal pattern. The only thing I miss is a good volume , but we have more positive signs than bearish.
Let’s follow AMD closely from now on, and remember to follow me to keep in touch with my daily updates, and please, support this idea if you liked it!
Have a good day!
