Weekly Hidden Bullish Divergence at a 0.886 RetraceBullish Engulfing on the Weekly at an 88.6% retrace with Hidden Bullish Divergence on the RSI at the bottom of a potential Ascending Triangle
Engulfing Candle

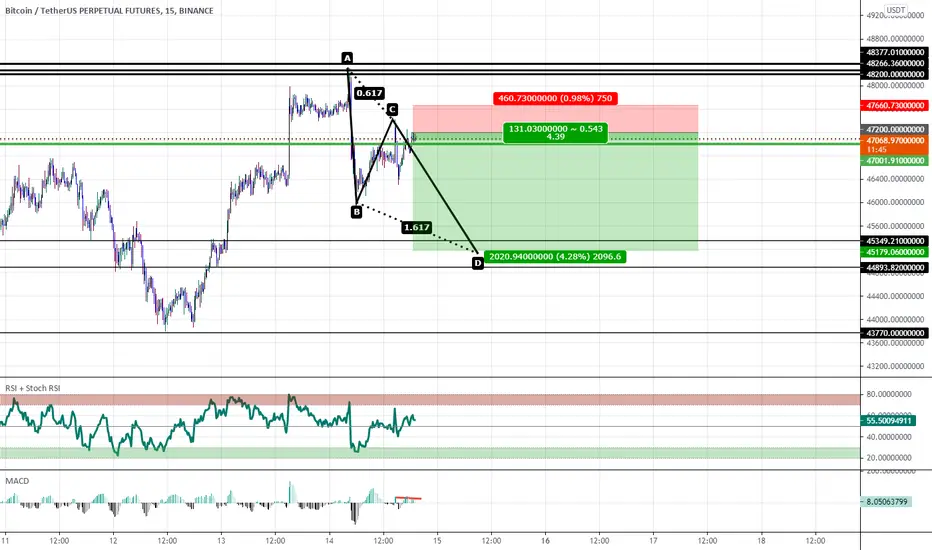
Early C Short Entry to the 1.618 Retrace BelowI think Shiba will bullishly reverse at the PCZ of Bullish ABCD but as of now i will like to try to enter before it potentially completes the rest of the wave. Stoploss above the bearish engulfing candle of this potential double top.

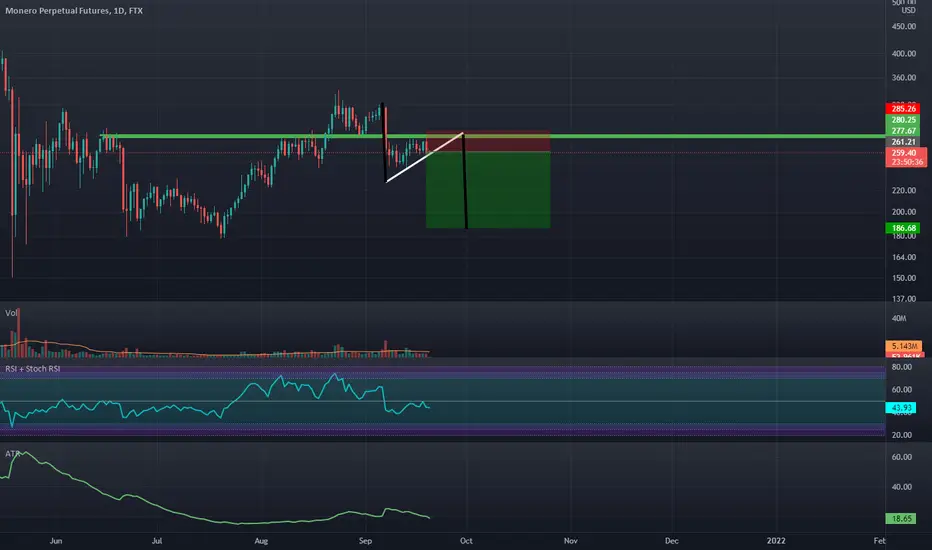
Bearish Engulfing On Daily Under An Important LevelWe are under support and the RSI is under 50 and looks to be ready to go down lower i think we will see $200-$180 again.
Weekly Bearish Engulfing On The Real Estate SectorThis Real estate ETF looks like it's ready to rollover on the weekly timeframe due to it bearishly engulfing, being at a 1.272 fib extension, and the RSI trendline being broken after reaching overbought.
I will either be looking to buy puts in VNQ tomorrow or i will be looking to purchase shares of the 3x Ultra Short Real Estate ETF $DRV

Weekly Bullish Engulfing Getting Follow-Through Price ActionThe RSI is oversold and we just got a volume spike: our next target will be to break the downtrend and reverse to new highs around the 20s and 30s.

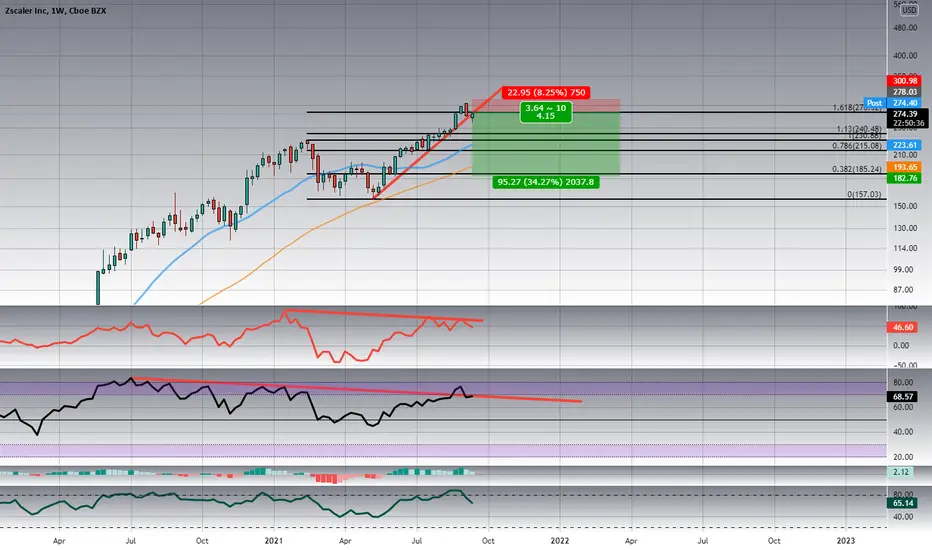
Weekly Bearish Engulfing at 1.618 Fib ExtensionWe have bearish divergence on momentum and rsi at an important fib lvl after breaking the trend and bearishly engulfing on the weekly
BTCUSDTHello everyone
I want to know what are you think about this monthly chart
Please write a sentence

GRTUSDT At a key level!Hey guys,
As you asked about GRTUSDT, We can say that the price is currently on a support area(However it is not a major) and we have different scenarios for it:
1. Breaking the support area:
it would be possible for price to drop till 0.5
2. Rejection happening:
At this situation the next target would be 1.1
-----------------------------------------------------------
But let's see what we have on the chart right now:
1. Price made a new higher high and higher low ( Bullish )
2. RSI hidden divergence ( Bullish )
3. Support area ( Bullish )
4. Double top pattern ( Bearish )
5. Strong bearish engulfing candlesticks ( Bearish )
6. Breaking the trend line and a pull back is done ( Bearish )
------------------------------------------------------------
What's my idea?
Honestly speaking we don't have enough proofs to be seller or buyer at the moment.
But as the Bitcoin market is bearish and here we have strong bearish engulfing, so I have more bearish bias at this situation.
It was my opinion, but please let me know what do you think about this market? Bullish or Bearish and why?
Good Luck!

Weekly Bearish Engulfing Bearish 5-0 May Take Us Down to 12KIt's not completely hopeless for the bulls yet but from the looks of things on the charts it seems way more likely that BTC will see 12.5K again rather than it seeing all time highs anytime soon. The Weekly Bearish Engulfing makes the perfect rejection signal at this Pattern Completion Zone.
I think we just spotted the trend reversal.

There is a high probability of a deeper correction in other currAt the bottom of the weekly channel, the chart tries to shape the engulfing pattern. If this pattern is formed, it is expected that due to the bitcoin conditions and bitcoin dominance conditions, next week we will see an increase in the number of this currency in exchange offices, which is a sign of the beginning of the price correction process in other currencies.

Big short !Whales started dumping their bags, we know what it means. What is yesterdays 10000 dollar candle? Sell signal, of course!
For everything there is an appointed time, and an appropriate time for every activity on earth. A time to be buy, and a time to sell !
I give you three targets, are you ready for ~10k bitcoin again?


EUR-CHF - Uptrend - Potential BuyEUR-CHF - Uptrend - Potential Buy
Look what I see, An up-trending market and an engulfing bullish candle spotted on Fib retracement tool.
It may go down further to 50% level or make a swing up.
This is no a recommendation but I took a buy entry.
Remember to trade with caution and proper risk management.
What do you think guys?

Payment Processors Are Setting Up To Get REKTMany of the payment processors and banks i look at seems to have some sort of indication that it will be going down soon Visa is just one of many. Today will be the closing of the month for VISA and many others and like many others Visa will be bearishly engulfing on the monthly and breaking down a rising wedge.

ZINC Sep LongZINC Sep Long
Bullish engulfing candle stick pattern
Buy at CMP- 245.45
SL- 244.45
Target- 246.55, 247.5
Disclaimer- We are not SEBI registered advisor.
Charts and views are only for educational purpose.

XAGUSD. Wait For A Pin Bar Or Rejection Candle To Form.XAGUSD. Watch For A Price Action Signal At 23.94000. Specifically, wait for a pin bar or rejection candle to form at price 23.94000. Double Bottom Neckline is at 23.94000. Two higher lows formed at trend line. Bullish Breakout candle engulfs previous candles.

$LMND Demark signals and an engulfing candle$LMND printed combo and sequential 13s. Bulls buying the signals are already profitable. Friday candle printed a bullish engulfing for next week. A good looking setup for a swing trade. Overall trend is still down. Tread lightly.

The Best & Most Reliable Candlestick Patterns To UseIn this video I explain my favourite candlestick patterns and how to use them in your own trading.
Here we describe:
Engulfing Candles
Doji Candles
Hammer Candles
And I explain how to use them with confluence & context of where on the chart they occur.

Daily shooting star reversal candle + bearish engulfing (BTC) Hello traders,
Daily timeframe analysis: bearish confluence ✓
1) shooting star reversal candle.
2) bearish engulfing candle on the following candle which confirms the initial reversal candle.
3) top of the rising wedge.
September is probably going to be red, as it aligns with the rising wedge and recent price action with the candle stick patterns.
Stay safe, and feel free to comment if you have any further questions or comments, also please like this post as it means a lot and shows support to my page.
👍

SIMPLE PRICE ACTION STRATEGY! PART 1RULE NO 1:
Use S&R Levels As Well As The SUPPLY & DEMAND ZONES.
RULE NO 2:
Look For BULLISH ENGULFINGS In The UP TREND TREND
2: PIN BAR CANDLE
3: BULLISH HAMMER
AND
Look For BEARISH ENGULFING In The DOWN TREND
2: SHOOTING STAR
3: BEARISH PIN BAR
NOTE: Use These Patterns on S&R , Supply And Demand Zones Break Of Structure Etc.
3RD RULE USE 4H TIMEFRAME IF YOU WANT TO LEARN IT FROM ME ASK ME IN COMMENTS I WILL TELL YOU HOW TO UNDERSTAND MARKET STRUCTURE EASILY !
USING TOO MUCH INDICATORS CAN LEAD YOU TO A HUGE LOSS.
This Is Not An Investment Advice.
HOPE YOU CAN UNDERSTAND!
HAVE A NICE TRADING JOURNEY !


ABCD Correction incoming if support breaks at 47kIf 47k does not hold as support 45k will be the next target.
Bearish Engulfing on 1H TF SpottedIf the (Fridays's) Bearish candle closes below the 1H green structures or below the purple line. I'll be looking for a sell on Monday.
But first, I need to confirm if there's no impact news, currency strength, and a couple of indicators...
What do you think guys?
Again, trade with proper risk management.
