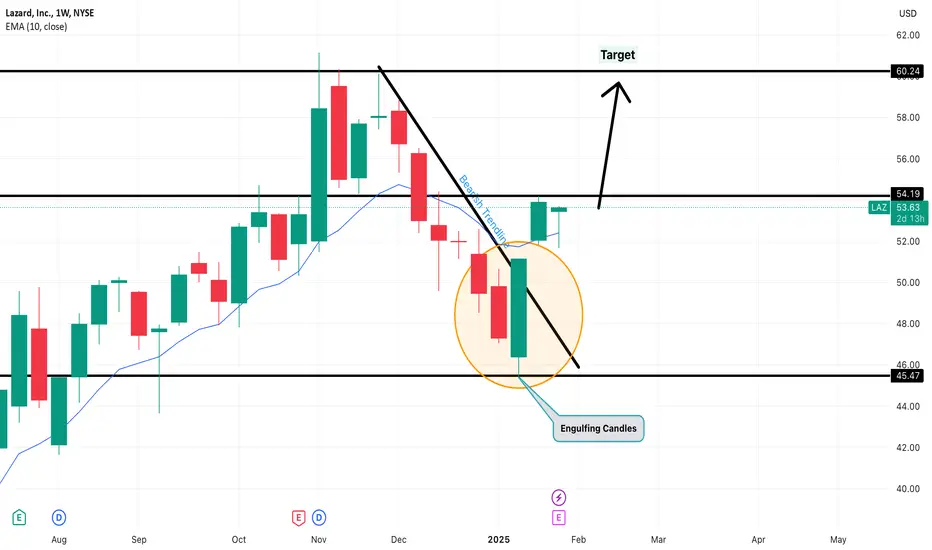
LAZ is bullish to 60The stock has showcased bullish engulfing pattern and ready to reach the target of 60.
It has also breached the bearish trendline and ready to move up with the stop below WEMA 10.
Engulfing Candle
Mastering the Bullish Engulfing PatternHello, Traders! 👋
Finding powerful reversal signals in a downtrend can be challenging, but what if a pattern was so visually striking that it's almost impossible to miss? Enter the bullish engulfing pattern – one of technical analysis's most reliable reversal signals. Today, we'll explore everything you need to know about the bullish, engulfing candlestick pattern and how to trade it effectively.
What Is a Bullish Engulfing Candle? 🔍
The bullish, engulfing candlestick tells a compelling story of market psychology. After a downtrend, a small bearish candle appears, suggesting continued selling pressure. But then something dramatic happens—a powerful bullish candle completely “engulfs” the previous day's trading range, signaling a dramatic shift in market control.
When asking, “what is a bullish engulfing candle?” think of it as a visual representation of bulls overwhelming bears in a single, decisive battle. The engulfing bullish pattern is particularly powerful because it shows not just buyer interest but complete buyer dominance.
Identifying the Perfect Bullish Engulfing Pattern 🎯
On the left side of the chart, we can see the formation of the Bullish Engulfing pattern. This consists of a smaller red candle completely engulfed by a larger green candle that follows it. To spot a valid bullish engulfing candle pattern, look for these essential elements:
A Clear Downtrend: Like any great comeback story, the engulfing bullish formation needs context.
First Candle Characteristics: A relatively small bearish candle, showing the last gasp of selling pressure.
The Engulfing Candle: The second day's bullish candle must completely engulf the previous day's real body, which puts the “engulfing” in bullish engulfing.
Opening and Closing Prices: The engulfing bullish pattern requires the second candle to open below the previous close and close above the last open.
On the right side of the chart, we can observe the Bearish Engulfing pattern. This formation shows the opposite scenario, where a larger red candle completely engulfs the body of the previous green candle. This pattern forms after several bullish candles, suggesting a potential reversal of the upward movement.
Why Does the Bullish Engulfing Pattern Work? 📊
The power of the bullish, engulfing candlestick pattern lies in its psychology. When a downtrend is in place, sellers feel confident, but the appearance of an engulfing bullish candle represents a dramatic shift in market sentiment. This sudden change often triggers a chain reaction:
Stop Losses Trigger (short sellers rush to cover their positions)
New Buyers Enter (fresh capital flows in as traders recognize the reversal signal)
Momentum Builds (the combination creates a self-reinforcing upward cycle)
Trading the Bullish Engulfing Pattern: A Strategic Approach 💡
Successfully trading the bullish engulfing pattern requires more than just pattern recognition.
Volume Confirmation: Look for higher-than-average volume on the engulfing day, confirming strong buyer participation.
Support Levels: The pattern becomes more powerful when it forms near key support areas.
Size Matters: The larger the engulfing bullish candle, the more significant the potential reversal signal.
Overall Market Trend: The pattern carries more weight in line with larger timeframe trends.
Market Conditions: Consider volatility and trading volume when assessing pattern strength.
Bringing It All Together 🎓
The bullish engulfing pattern is one of technical analysis's most powerful reversal signals. By understanding its formation, psychology, and proper trading approach, you can add a valuable tool to your trading arsenal.
Remember: successful trading isn't about finding a perfect pattern—it's about finding and managing high-probability setups. When adequately identified and traded, the bullish, engulfing candlestick pattern offers precisely that kind of opportunity.

GBPUSD SELL IDEAOANDA:GBPUSD Overall bearish bias on GBPUSD. price currently making a retest at the Daily/key area of interest. Currently awaiting a 4H bearish engulfing candlestick on the 4H

How to easily place pending orders in GOLD #XAUUSDThis is an easy way to determine where to place a buy or sell order. Place the buy or sell order in the boxed area created by the signal, as in the example. For SL TP, it can be in a 1:1 ratio or placed at the previous strong Support and Resistance. Always pay attention to the LOT placed. Adjust to the capital and do not place too many positions during the transaction. Be disciplined and stay relaxed when trading. God Bless.
FOREXCOM:XAUUSD

4 TRADE LEVELS XAUUSD - PRECISE PRICE LEVEL THEORY After a successful sell in our community at 2719-2726 , today we are presented with a tough perspective due to the fact that now the current market price is entangled between the Supply and Demand Levels of H4 & Daily indicating a market cool off scenario entering a passive sideways.
So best strategy for today is to let the eruption of the market happen first and attempt on a reversal trade rather than seeking for a continuation trend trade.

SWING IDEA - ANAND RATHI WEALTH LTDAnand Rathi Wealth Ltd , a leading wealth management company in India offering financial advisory services, is presenting a potential swing trading opportunity.
Reasons are listed below:
4300 Zone Breakout : The 4300 level has been tested multiple times, and the stock is now breaking out, suggesting renewed buying interest.
Bullish Engulfing Candle on Daily Timeframe : A bullish engulfing pattern has formed on the daily chart, indicating strong upward momentum.
Breaking Consolidation Zone of 6 Months : The stock is breaking out of a long consolidation phase, which could lead to a new bullish trend.
Trading Above 50 and 200 EMA : The price is trading above both the 50 and 200-day exponential moving averages, reinforcing the bullish outlook.
Volume Spike : An increase in trading volumes supports the strength of the breakout, indicating robust market participation.
Target - 4850
Stoploss - daily close below 3990
DISCLAIMER -
Decisions to buy, sell, hold or trade in securities, commodities and other investments involve risk and are best made based on the advice of qualified financial professionals. Any trading in securities or other investments involves a risk of substantial losses. The practice of "Day Trading" involves particularly high risks and can cause you to lose substantial sums of money. Before undertaking any trading program, you should consult a qualified financial professional. Please consider carefully whether such trading is suitable for you in light of your financial condition and ability to bear financial risks. Under no circumstances shall we be liable for any loss or damage you or anyone else incurs as a result of any trading or investment activity that you or anyone else engages in based on any information or material you receive through TradingView or our services.
@visionary.growth.insights

Understanding Bullish Engulfing Candlestick PatternThe Bullish Engulfing Candlestick Pattern is a popular price action signal used by traders to identify potential trend reversals in the market. If you're keen on mastering price action trading, understanding this pattern is essential. This guide will take you from the basics of the pattern to advanced insights, with easy-to-understand explanations to help you become more confident in your trading decisions.
What is a Bullish Engulfing Candlestick?
A bullish engulfing candlestick is a two-candle pattern that signals a potential reversal in a bearish trend. The pattern consists of a smaller bearish (red) candle followed by a larger bullish (green) candle that completely engulfs the previous one. This indicates that the buying pressure has overwhelmed the sellers, suggesting a shift from a downtrend to an uptrend.
Key Features of the Bullish Engulfing Pattern
Here’s a breakdown of the key characteristics:
Number of Candles: The pattern consists of two candles.
First Candle: A bearish candle, typically red, showing a decline in price.
Second Candle: A bullish candle, typically green, that completely engulfs the previous bearish candle, including its wicks.
Prior Trend: A bearish trend must precede the pattern to validate it as a potential reversal signal.
Prediction: A potential shift from bearish to bullish trend.
The Anatomy of a Bullish Engulfing Pattern
To fully grasp this pattern, let's break down the structure:
The first candle in the pattern is a small bearish candle, indicating the continuation of a downtrend.
The second candle is a large bullish candle that opens lower than the previous close and closes higher than the previous high, completely engulfing it. This suggests a strong buying momentum.
Why Do Bullish Engulfing Patterns Work?
A bullish engulfing pattern is significant because it reflects a shift in market sentiment. Here’s why:
Seller Exhaustion: The first candle shows a bearish trend, indicating seller dominance. When the second candle engulfs it, it suggests that sellers are losing control.
Buyer Strength: The second candle’s larger body signals strong buying interest, indicating a shift in market control from sellers to buyers.
Market Psychology: A bullish engulfing pattern indicates that traders are willing to buy at higher prices, leading to increased bullish momentum.
Why a Pin Bar Can Be an Engulfing Pattern
A common observation among experienced traders is that a pin bar on a higher timeframe can appear as a bullish engulfing pattern on a lower timeframe. This happens because:
A pin bar shows a strong rejection of lower prices, which on a lower timeframe looks like a large bullish candle engulfing smaller bearish candles.
This highlights the importance of multi-timeframe analysis. Understanding how patterns form on different timeframes gives a more holistic view of market dynamics.

BITCOIN → False Breakout & Bearish Engulfment ↓ BINANCE:BTCUSD entered a strong buying zone (68900) within the rally. BUT, the expected growth did not happen, the bulls could not realize the potential. A bearish engulfment of the last three bars is formed and actually - a false breakdown of the descending resistance...
The growth formed from 59K is partly connected with the election race in the USA, economic revival in China, as well as economic news. But apparently, this energy is not yet enough for the price to easily overcome 68-69K with a target of retesting 71-73. The resistance zone of 68.4-69.4 is putting pressure. Buyers are taking profits, while bears, seeing the strong resistance zone, are trying to resist.
The structure will break down if the price breaks 69400
At the moment, we see a bearish engulfment forming relative to the previous three bars, and this is a strong enough signal. Consolidation below resistance is forming, a small correction may be formed, the first target of which may be 65K, then 61-58-57.
Resistance levels: 68400, 69400, 71500
Support levels: 66500, 65000
After the false breakdown, the price consolidation is formed below the resistance, which indicates the pressure from the sellers. This may provoke further downward correction.
Rate, share your opinion and questions, let's discuss what's going on with ★ BINANCE:BTCUSDT ;)
Regards R. Linda!

Selling can continue in INDHOTEL after closing below 678.5 Today selling intensity in INDHOTEL was very high so it can continue tomorrow,
Its already trading at support zone, if we see followup selling tomorrow then next support is far away from the current price and can give good profit if price test next support level.
Note: Its just an analysis, wait for the price to confirm.
Disclaimer: Always follow risk to reward, this is the only key to success in market, no matter how much good a trade is looking we never know the future.

SWING IDEA - GARDEN REACH SHIP & ENGGarden Reach Shipbuilders & Engineers Ltd ., a leading public sector shipyard in India known for building warships and naval vessels, is showing signs of a potential swing trade opportunity.
Reasons are listed below :
1700 Zone as Strong Support : The 1700 level has acted as a crucial support zone, reinforcing a solid base for potential upside movement.
Bullish Engulfing Candle on Daily Timeframe : A bullish engulfing candle has formed, indicating increased buying pressure.
Golden Fib Zone : The price is currently bouncing from the golden Fibonacci zone, suggesting potential for further gains.
100 EMA Support on Daily Timeframe : The stock is well-supported by the 100-day EMA, further solidifying the bullish trend.
Target - 2200 // 2510
Stoploss - daily close below 1640
DISCLAIMER -
Decisions to buy, sell, hold or trade in securities, commodities and other investments involve risk and are best made based on the advice of qualified financial professionals. Any trading in securities or other investments involves a risk of substantial losses. The practice of "Day Trading" involves particularly high risks and can cause you to lose substantial sums of money. Before undertaking any trading program, you should consult a qualified financial professional. Please consider carefully whether such trading is suitable for you in light of your financial condition and ability to bear financial risks. Under no circumstances shall we be liable for any loss or damage you or anyone else incurs as a result of any trading or investment activity that you or anyone else engages in based on any information or material you receive through TradingView or our services.
@visionary.growth.insights

Brent crude: Buying into the stormAny trade you take in oil right now is probably going to make you a quick win or loss .
Oil has easily been the most volatile market this week - it's pretty obvious why
1) Hurricanes in the US disrupting supply
2) War in the Middle East
For us, the trend is higher since breaking through $76 / bbl. And the latest fractal forming a higher low helped confirm this idea.
This uptrend has not been properly established with 2 higher highs, which offers bigger possible upside but also a greater chance of never getting going.
You can see the price is trapped between the 50 SMA and 200 SMA.
We see a chance for a favourable 2:1 risk reward by trading the pullback from yesterday's bullish engulfing candlestick up to this week's high around 81.50.
What do you think? Please share your ideas in a comment

SWING IDEA - JAMMU AND KASHMIR BANKJ&K Bank is currently showing several technical indicators that suggest a potential swing trade opportunity.
Reasons are listed below :
105 Zone as Strong Support : The 105 level has proven to be a significant support zone, providing a strong foundation for potential upward movement.
Bullish Engulfing Candle : A bullish engulfing candle that engulfed 29 daily candles has formed, indicating strong buying pressure and a potential reversal of the recent downtrend.
Sudden Spike in Volume : A noticeable increase in trading volumes confirms the strength of the price move, suggesting strong investor interest and participation.
0.5 Fibonacci Support : The price is bouncing off the 0.5 Fibonacci retracement level, suggesting a healthy pullback and resumption of the uptrend.
Target - 135 // 150
Stoploss - Daily close below 104
DISCLAIMER -
Decisions to buy, sell, hold or trade in securities, commodities and other investments involve risk and are best made based on the advice of qualified financial professionals. Any trading in securities or other investments involves a risk of substantial losses. The practice of "Day Trading" involves particularly high risks and can cause you to lose substantial sums of money. Before undertaking any trading program, you should consult a qualified financial professional. Please consider carefully whether such trading is suitable for you in light of your financial condition and ability to bear financial risks. Under no circumstances shall we be liable for any loss or damage you or anyone else incurs as a result of any trading or investment activity that you or anyone else engages in based on any information or material you receive through TradingView or our services.
@visionary.growth.insights

QQQ Bearish EngulfingEngulfing candle signals more downside room potentially to daily gap fill down to 468, 467 and 465 area. Break below and it'll see 456.50

Gold to retest H4 engulfing failPrice outlook for the rest of the week... Expecting gold to retest H4 EF @ 2,505.99, create new all time high, then break back into newly created H4 engulfing fail @ 2,531.77 at some point in the not too distant future to continue bullish.

SWING IDEA - VIP INDUSTRIESVIP Industries , a leading manufacturer of luggage and travel accessories, is displaying technical indicators that suggest a promising swing trading opportunity.
Reasons are listed below :
450-500 Strong Support Zone : The 450-500 level has been established as a strong support zone, providing a solid base for potential upward movement.
Bullish Engulfing Candle on Weekly Timeframe : The formation of a bullish engulfing candle on the weekly chart indicates strong buying pressure and suggests potential for further upward movement.
Daily Candle Engulfed 7 Daily Candles : The recent daily candle has engulfed the previous 7 daily candles, demonstrating significant buying interest and a potential shift in trend.
Golden Fibonacci Zone : The stock is finding support at the golden Fibonacci retracement level (0.618), a key area where prices often bounce back, indicating potential for an upward move.
Increased Volumes : A noticeable increase in trading volumes confirms the strength of the price move and indicates growing investor interest.
Target - 575 // 660 // 715
Stoploss - weekly close below 445
DISCLAIMER -
Decisions to buy, sell, hold or trade in securities, commodities and other investments involve risk and are best made based on the advice of qualified financial professionals. Any trading in securities or other investments involves a risk of substantial losses. The practice of "Day Trading" involves particularly high risks and can cause you to lose substantial sums of money. Before undertaking any trading program, you should consult a qualified financial professional. Please consider carefully whether such trading is suitable for you in light of your financial condition and ability to bear financial risks. Under no circumstances shall we be liable for any loss or damage you or anyone else incurs as a result of any trading or investment activity that you or anyone else engages in based on any information or material you receive through TradingView or our services.
@visionary.growth.insights

SWING IDEA - SUZLON ENERGYA potential swing trade opportunity in Suzlon Energy - a leading renewable energy solutions provider in India.
Reasons are listed below :
Strong Support at 34-36 : Suzlon Energy has found a robust support level in the 34-36 range, indicating resilience and potential buying interest at these levels.
Bullish Engulfing Candle : A bullish engulfing candlestick pattern, confirming the hammer formed in the previous week, suggests potential upward momentum.
0.382 Fibonacci Support : Finding support at the 0.382 Fibonacci level reinforces the bullish outlook, providing a solid foundation for potential upward movement.
Trading Above 50 and 200 EMA : Suzlon Energy is trading above both the 50 and 200 Exponential Moving Averages (EMA), indicating positive momentum and potential bullish trend continuation.
Constant Higher Highs : The stock has been forming constant higher highs, reflecting a trend of increasing bullish momentum and reinforcing the potential for further gains.
Target - 49 // 60
Stoploss - weekly close below 35
DISCLAIMER -
Decisions to buy, sell, hold or trade in securities, commodities and other investments involve risk and are best made based on the advice of qualified financial professionals. Any trading in securities or other investments involves a risk of substantial losses. The practice of "Day Trading" involves particularly high risks and can cause you to lose substantial sums of money. Before undertaking any trading program, you should consult a qualified financial professional. Please consider carefully whether such trading is suitable for you in light of your financial condition and ability to bear financial risks. Under no circumstances shall we be liable for any loss or damage you or anyone else incurs as a result of any trading or investment activity that you or anyone else engages in based on any information or material you receive through TradingView or our services.
@visionary.growth.insights

SPY: A Dangerous Turning Point (D&W charts).The SPY chart exhibits some key technical aspects worth noting.
On the daily chart, the price action has recently tested the double support area around the 21-day EMA and the 550 level. This confluence of support has provided a temporary floor, allowing the price to bounce back. However, if SPY misses this key support level in the future, it'll officially trigger a bearish reversal to its next support levels, like the 542, or even lower.
On the weekly chart, the bearish engulfing pattern stands out. This pattern, occurring after reaching an all-time high, indicates a potential reversal or a strong corrective phase - if triggered. SPY's price would need to lose last week's low to trigger this pattern, which is very close to the 550 support seen on the daily chart. Therefore, this is a critical support area on multiplie time frames.
The price action following this pattern suggests a weakening of the bullish momentum that previously drove the SPY to new highs. The 21-week EMA will be crucial as it has historically served as a dynamic support level throughout the upward trend, and it'll be a technical target if SPY reverses the bullish sentiment.
The interplay between these support levels and the reaction to the bearish engulfing pattern will be critical in determining the next phase for the SPY. The trend is still bullish, but we are trading around a dangerous area, which could act as a major turning point for SPY.
For now, let's closely monitor the price action around these levels, especially the behavior near the 550 support and the 529.08 EMA, for further clues on the ETF's direction.
For more detailed technical analyses and insights like this, be sure to follow my account. Your support helps me continue providing valuable content to help you make informed trading decisions.
Remember, real trading is reactive, not predictive, so let's stay focused on the key points described above and only trade when there is confirmation.
“To anticipate the market is to gamble. To be patient and react only when the market gives the signal is to speculate.” — Jesse Lauriston Livermore
All the best,
Nathan.

SWING IDEA - IOB (INDIAN OVERSEAS BANK)With its strong foothold in the Indian banking sector and commitment to providing financial services to customers, Indian Overseas Bank presents an intriguing opportunity for swing traders.
Reasons are listed below :
Strong Support at 55-60 Zone : IOB has established a robust support base in the 55-60 zone, from which the price is rebounding, reflecting market confidence in the bank's stability and resilience.
Bullish Engulfing Candle : A bullish engulfing candlestick pattern on the daily timeframe, engulfing eight previous daily candles, indicates a strong reversal and potential upward momentum in IOB's stock price.
'W' Pattern Formation : The formation of a 'W' pattern suggests a potential reversal and bullish continuation, highlighting the underlying strength and positive sentiment surrounding IOB.
0.618 Fibonacci Support : Finding support at the 0.618 Fibonacci level reinforces the bullish outlook, providing a solid foundation for potential upward movement.
Increase in Volume : Notable increase in trading volumes reflects growing market interest and potential accumulation by investors, adding confirmation to the bullish thesis for IOB.
Higher Highs Formation : IOB has been forming higher highs, indicating a trend of increasing bullish momentum and reinforcing the potential for further gains.
Target - 70 // 82 // 90
Stoploss - daily close below 54
DISCLAIMER -
Decisions to buy, sell, hold or trade in securities, commodities and other investments involve risk and are best made based on the advice of qualified financial professionals. Any trading in securities or other investments involves a risk of substantial losses. The practice of "Day Trading" involves particularly high risks and can cause you to lose substantial sums of money. Before undertaking any trading program, you should consult a qualified financial professional. Please consider carefully whether such trading is suitable for you in light of your financial condition and ability to bear financial risks. Under no circumstances shall we be liable for any loss or damage you or anyone else incurs as a result of any trading or investment activity that you or anyone else engages in based on any information or material you receive through TradingView or our services.
@visionary.growth.insights

NVDA: Pullback Ahead?Hourly Chart: Key Support and Previous Top
The hourly chart for NVDA emphasizes the significance of the support level at 125.59. This level was a previous top, and now it is acting as a support, following the Principle of Polarity in Technical Analysis. The chart shows that the previous top, which is now support, has been tested a few times, reinforcing its critical role.
Daily Chart: Bearish Engulfing Pattern
On the daily chart, a bearish engulfing pattern is evident, signaling a potential correction of the uptrend. This pattern forms when a smaller white candlestick is completely engulfed by a larger black candlestick, indicating a shift in market sentiment from bullish to bearish. This pattern is often a precursor to further downside movement. The red line marks the 38.2% Fibonacci retracement level at 115.82, which was a previous resistance seen on the 1H chart as well, serves as an additional support level.
Conclusion
The NVDA charts provide a mixed outlook. The double support at 115.89 on the hourly/daily charts is critical, while the bearish engulfing pattern on the daily chart suggests a potential pullback ahead. For now, we should keep a close eye on the 125.59 support level. A hold above this level could indicate a buying opportunity, while a break below could signal further downside to the 115 area.
Keep in mind that the trend is still bullish and pullbacks would be buying opportunities as the price approaches its support levels, when the R/R ratio is optimized.
For more detailed technical analyses and insights like this, be sure to follow my account. Your support helps me continue providing valuable content to help you make informed trading decisions.
Remember, real trading is reactive, not predictive, so let's stay focused on the key points described above and only trade when there is confirmation.
“To anticipate the market is to gamble. To be patient and react only when the market gives the signal is to speculate.” — Jesse Lauriston Livermore
All the best,
Nathan.

Long Idea on EURUSDEURUSD on Daily Timeframe had a huge correction, completing its double top formation.
If you refer to 30-minutes time frame, the RSI is making higher low, while the price is making lower low.
In addition to that, the MACD crossed over to upwards.
Lower Bollinger Bands is closing and a bullish engulfing candlestick formed on 1-hour timeframe, suggest that buying momentum is in control.
My Entry level: 1.07542
Profit Target: 1.09400
Stop Loss: 1.07060
Risk: Reward = 1: 3.40
Beware, that EURUSD will need to fill its gap first at 1.0800 level.

CRVUSDT | Small Move Higher on the Horizon?Market Context
We’ve got an intriguing setup on CRVUSDT! A bullish engulfing candle on the 1H chart, coupled with a trendline break, could be signaling a move higher today.
Strategy
While the market might be quiet today, this calm could allow smaller tokens like CRVUSDT to make some interesting moves. This setup suggests we could see a nice pop!
Let’s keep an eye on this—small tokens often bring big surprises!

XRP Price Action Looks to be Setting up for a Rise to 2 DollarsWe have a 3 Rising Valleys Pattern that has recently formed on the weekly timeframe, and we recently had a confirmed weekly Bullish Engulfing; if XRP manages to get back above 51 cents from here then it will likely begin to move fast towards it's last swing high of $1.96 but at the same time this is XRP we're talking about so it could go much higher because it is trading within in a massive macro consolidation wave structure on much higher timeframes and I have projected could take XRP up to as high as $120.94 whenever XRP truly decides to get going which can be seen here:

SWING IDEA - RAMKRISHNA FORGINSConsider a compelling swing trade opportunity in Ramkrishna Forgings Limited , a leading manufacturer of automotive components in India, catering to both domestic and international markets.
Testing Strong Resistance Zone : The price range of 750-770 has been tested multiple times and is currently attempting to breach it, indicating potential bullish momentum.
Bullish Engulfing Patterns : Bullish engulfing candlestick patterns observed on both the weekly and daily timeframes signal strong buying momentum and potential upward movement.
Trading at All-Time High : Ramkrishna Forgings is currently trading at its all-time high, indicating strong bullish sentiment and potential for further gains.
Trading Above 50 and 200 EMA : The stock is trading above both the 50 and 200 Exponential Moving Averages (EMA) on the daily timeframe, confirming its bullish bias and potential for trend continuation.
Volume Spike : A significant spike in trading volumes reflects increased market interest and potential accumulation by investors, adding confirmation to the bullish thesis for Ramkrishna Forgings.
Target - 860 // 945
Stoploss - daily close below 700
DISCLAIMER -
Decisions to buy, sell, hold or trade in securities, commodities and other investments involve risk and are best made based on the advice of qualified financial professionals. Any trading in securities or other investments involves a risk of substantial losses. The practice of "Day Trading" involves particularly high risks and can cause you to lose substantial sums of money. Before undertaking any trading program, you should consult a qualified financial professional. Please consider carefully whether such trading is suitable for you in light of your financial condition and ability to bear financial risks. Under no circumstances shall we be liable for any loss or damage you or anyone else incurs as a result of any trading or investment activity that you or anyone else engages in based on any information or material you receive through TradingView or our services.
@visionary.growth.insights
