Fine Organics - Swing trade opportunity!!Bullish engulfing candlestick pattern at resistance turned support level.
Short term target can be previous swing high.
Engulfing Candle

Bull or bear beat holding +249.2% over a year, in profit in MayAs traders we look to capitalise on all sort of markets, not just parabolic runs. Today we are exploring how to run a long strategy even when the bulls are not in control.
WILL POST LAST 50 POSITIONS BELOW
We are looking for an strategy that:
1. has been beating buy and hold all year
2. Has a drawdown of max 15% in may 2021
3. Is simple to execute and automate
Not all candlestick patterns are created equal, and they do not work on all markets. However they do work in crypto, at least based on experience as they are not tough to identify and speculators tend to react to them.
This is why we focused on candles that are not that difficult to identify and are very clear in meaning.
The strategy (FULL INSTRUCTIONS):
On the 30 min timeframe:
We are going to open a position when the candle is a bullish Engulfing
We are going to close the position when the candle is bearish Marubozu
No stop loss or take profit, these are the only rules we follow, but we follow them a 100% of the time.
The results:
The strategy brought in 249.17%, beating holding. If you started trading this a year ago with 1 Bitcoin, you would be 2.4917 BTC in profit at the moment. What's even better the max drawdown throughout the year was 22.7% and it was actually in February.
During May we were only 11% down at a certain point.
This provides a Sortino Ratio of 5.44 which is a stellar mark for these volatile markets.
The positions:
31/05/2021 04:30
31/05/2021 14:00
10 hours
OP 0.06681
CP 0.068884
+3.1%
29/05/2021 21:30
30/05/2021 19:30
22 hours
OP 0.065407
CP 0.067746
+3.58%
29/05/2021 00:30
29/05/2021 18:00
18 hours
OP 0.068427
CP 0.066952
-2.16%
28/05/2021 07:30
28/05/2021 14:30
7 hours
OP 0.069574
CP 0.069572
-0.00287%
25/05/2021 18:00
27/05/2021 19:30
2 days
OP 0.068144
CP 0.071024
+4.23%
24/05/2021 00:30
25/05/2021 03:30
1 day
OP 0.061435
CP 0.067043
+9.13%
22/05/2021 22:30
23/05/2021 12:30
14 hours
OP 0.062197
CP 0.0581
-6.59%
22/05/2021 11:00
22/05/2021 17:30
7 hours
OP 0.064251
CP 0.06059
-5.7%
19/05/2021 22:00
20/05/2021 21:00
23 hours
OP 0.066705
CP 0.068997
+3.44%
17/05/2021 23:00
19/05/2021 07:00
1 day
OP 0.075193
CP 0.074787
-0.54%
17/05/2021 06:30
17/05/2021 09:30
3 hours
OP 0.076593
CP 0.077412
+1.07%
14/05/2021 13:00
15/05/2021 14:30
1 day
OP 0.079504
CP 0.078525
-1.23%
13/05/2021 16:30
13/05/2021 23:30
7 hours
OP 0.076788
CP 0.074242
-3.32%
12/05/2021 10:30
13/05/2021 15:30
1 day
OP 0.075732
CP 0.075619
-0.149%
11/05/2021 06:30
12/05/2021 10:00
1 day
OP 0.071125
CP 0.075353
+5.94%
09/05/2021 16:00
10/05/2021 11:00
19 hours
OP 0.06759
CP 0.069748
+3.19%
07/05/2021 13:30
09/05/2021 00:30
1 day
OP 0.061147
CP 0.065733
+7.5%
05/05/2021 01:30
06/05/2021 23:30
2 days
OP 0.061121
CP 0.061832
+1.16%
03/05/2021 00:30
04/05/2021 22:00
2 days
OP 0.05225
CP 0.061328
+17.4%
01/05/2021 22:30
02/05/2021 05:30
7 hours
OP 0.051064
CP 0.051111
+0.092%
30/04/2021 19:00
01/05/2021 15:00
20 hours
OP 0.048829
CP 0.049703
+1.79%
30/04/2021 09:30
30/04/2021 16:00
7 hours
OP 0.051113
CP 0.047849
-6.39%
29/04/2021 08:30
30/04/2021 02:30
18 hours
OP 0.050351
CP 0.051114
+1.52%
28/04/2021 10:00
29/04/2021 00:30
15 hours
OP 0.04799
CP 0.049829
+3.83%
27/04/2021 00:00
27/04/2021 19:30
20 hours
OP 0.046896
CP 0.047795
+1.92%
26/04/2021 10:00
26/04/2021 13:00
3 hours
OP 0.046466
CP 0.046378
-0.189%
24/04/2021 21:00
25/04/2021 13:30
17 hours
OP 0.045035
CP 0.046231
+2.66%
22/04/2021 20:00
24/04/2021 17:00
2 days
OP 0.04791
CP 0.044796
-6.5%
19/04/2021 12:00
22/04/2021 18:00
3 days
OP 0.039343
CP 0.04728
+20.2%
16/04/2021 10:30
17/04/2021 19:00
1 day
OP 0.03943
CP 0.039117
-0.794%
15/04/2021 18:00
16/04/2021 05:00
11 hours
OP 0.039286
CP 0.039291
+0.0127%
13/04/2021 17:30
15/04/2021 17:00
2 days
OP 0.0363
CP 0.039141
+7.83%
13/04/2021 14:30
13/04/2021 17:00
3 hours
OP 0.03575
CP 0.035968
+0.61%
12/04/2021 11:00
12/04/2021 12:30
2 hours
OP 0.035761
CP 0.035598
-0.456%
11/04/2021 03:30
12/04/2021 09:30
1 day
OP 0.035639
CP 0.035866
+0.637%
10/04/2021 21:00
10/04/2021 23:30
3 hours
OP 0.035761
CP 0.035688
-0.204%
08/04/2021 22:30
09/04/2021 13:30
15 hours
OP 0.035729
CP 0.035448
-0.786%
08/04/2021 02:00
08/04/2021 18:30
17 hours
OP 0.035231
CP 0.035636
NA
+1.15%
05/04/2021 05:30
06/04/2021 19:30
2 days
OP 0.035409
CP 0.036274
+2.44%
02/04/2021 13:00
04/04/2021 03:00
2 days
OP 0.033704
CP 0.035098
+4.14%
01/04/2021 13:30
02/04/2021 04:00
15 hours
OP 0.032793
CP 0.033349
+1.7%
30/03/2021 06:30
31/03/2021 22:00
2 days
OP 0.03138
CP 0.032743
+4.34%
27/03/2021 09:00
30/03/2021 02:30
3 days
OP 0.030822
CP 0.031326
+1.64%
26/03/2021 02:00
27/03/2021 04:00
1 day
OP 0.03114
CP 0.030919
-0.71%
25/03/2021 16:00
25/03/2021 20:00
4 hours
OP 0.031273
CP 0.030754
-1.66%
23/03/2021 17:30
23/03/2021 20:30
3 hours
OP 0.030826
CP 0.03091
+0.272%
20/03/2021 15:30
23/03/2021 00:30
2 days
OP 0.031261
CP 0.030839
-1.35%
20/03/2021 00:00
20/03/2021 05:30
6 hours
OP 0.031174
CP 0.031295
+0.388%
18/03/2021 18:00
19/03/2021 03:30
10 hours
OP 0.030665
CP 0.03087
+0.669%
17/03/2021 07:30
17/03/2021 18:00
11 hours
OP 0.031816
CP 0.032216
+1.26%

GME Bearish MoveI’ve been monitoring GME the last few days. I noticed a bearish engulfing pattern appear on the daily chart this Friday indicating a possible move downward. Was lucky to catch it on the way up last week for gains of >500% so I’m working w/ profits on my current position. Clearly a volatile situation, good luck to all.

NZDCHF - IN TREND ENGULFING LONG SETUP (D)Confluences:
Bullish engulfing
Lower bollinger band outbreak
Rejected strong support/demand zone
Long term uptrend
Close above 20 EMA
TP set at the candle body high of the previous highs.
SL set below engulfing candle low (safe) or below 4H engulfing candle low (riskier).
A close above the resistance trend line will confirm further increase in price.
Will be looking to re-enter this setup if price pulls back strongly then forms a strong bullish engulfing on the 15m, 30m or 1H time frames.


TSLA: Two scenarios for us to work with!Hello traders and investors! Let’s see how Tesla is doing today!
First, in the 1h chart, we see that it is trading inside a short-term congestion , between the red lines. Today, Tesla just retested the upper line, and it seems it won’t break it right now. In fact, it is doing a bearish engulfing.
The 21 ema is useless during congestions, so it is not a reliable support/resistance level. On the bright side, Tesla is not in a bear trend anymore , as it is not doing lower highs/lows. Now, this congestion will determine the direction of the next movement.
We might see a breakout from the $ 560 or the $ 592, and we can set targets for both scenarios. Let’s see the daily chart:
We have a congestion in the daily chart as well, and we are in the bottom area. If Tesla loses the $ 560, the next target is the $ 538, and below that, we have the $ 400 area.
But if Tesla breaks upwards, it has the $ 690 as the next technical target, but maybe the 21 ema will hold the price briefly. Anyway, we must take care now, and be prepared for different scenarios.
If you like this analysis, remember to follow me to keep in touch with my daily studies, and remember to s upport this idea if it helped you !
Thank you very much!

BTC Bitcoin The weekly, engulfing the previous two green candlesThe weekly, engulfing the previous two green candles. Bearish. Attention to the volume

SRMUSDT hidden bullish divergenceSRMUSDT on the daily timeframe shows a rejection with a bullish engulfing candle pattern. The previous resistance area which is now a support area and is close to the long trend line from the month of December 2020. To further ensure the direction of the next price movement, it is seen that the price has formed a hidden bullish divergence using stochastic. Hopefully this analysis is useful for you.
Risk disclaimer on!

Route identificationIn the monthly time, a powerful ascending candle covers its previous candle
I see all these falls as a correction for the upward movement
Let me know what you think in comment...

japanese candlestick patterns (engulfingbar bar)the engulfing bar:
an engulfing pattern signals a reversal, and can be bullish or bearish. It comprises two candles. the body of the second one must engulf the body of the first one. There are two type of engulfing bars
The bullish engulfing bar that cosists of two candles. the bosy of the second candle is greater in size than the previous candle. This pattern is considered to be reversal, because when it appears in a downtrend, it signals a revesal.
The bearish engulfing candle consists also two candles, but it is the opposite version of the bullish engulfing bar . Be cause when it occurs in the end of an uptrend, it signals a future price reverse.

CADCHF - IN TREND ENGULFING LONG SETUP (D)Confluences:
Recent higher high
Large bullish engulfing candle
Slight lower bollinger band outbreak
SL set below engulfing candle low.
TP set a previous high's candle body high. Trail SL for max profit.
Similar to CADJPY setup, but not quite as strong.

USDJPYPrice came down and formed a higher low and pumped. Bullish engulfing on daily chart, any pull back on smaller time frame will likely be setting up for continued bullish wave up towards 111.00!

A Trend to the Upside for this FinTech?This is building from my original idea published for ABXXF, listed here in the US on the OTC; However, you can't really glean too much from it's chart. You can see the original ideas linked under 'Related Ideas".
I'm expecting the cup and handle formation to continue with it reaching resistance around CAD$4.40-$4.45 (US$4.20).
> The 4-Hour Charts for ABXX & ABXXF, both, currently on a green '2' candle. I'm expecting a full 9 candle trend to the upside to continue.
A green number '2' candle sitting on top of a green number '1' candle is very bullish.
If all goes to plan, the green '1' candles on the daily-charts for both ABXX & ABXXF could give us the same trend I just mentioned above.
Regardless of these technicals, I really like this company and believe in what they are trying to achieve.
The Company:
Abaxx is a blockchain and ESG company focused on commodities like LNG (Liquified Natural Gas ) and Gold! Abaxx Tech came to the market through a RTO (Reverse Take-Over) of New Millennium Iron (NML & NWLNF). The serially successful mining and media billionaire mogul, Robert Friedland, was one of Abaxx's first angel investors. Abaxx Technologies has multiple subsidiaries. One of the subsidiaries is the Abaxx Exchange where Abaxx Tech receives a royalty for the commodities listed on the exchange.
See more info about the company on its websites:
Abaxx.Tech & Abaxx.Exchange
**Keep in mind I'm an amateur investor nothing I say should be seen as financial advise. I am a small shareholder in this company because I believe in their mission and what they are trying to achieve. I've been a shareholder since the company was called New Millennium Iron when I learned that Robert Friedland was an angel investor in a young entrepreneur and ex-Goldman Sachs exec named Josh Crumb, founder of GoldMoney.
I listen to 'Smarter Markerts', an Abaxx-sponsored podcast to learn more about the titans behind the Abaxx in the world of Mining, Blockchain, Finance and ESG.
At least listen to the first episode where Robert Friedland lays out his vision behind a greener future. He discusses the importance of ESG, blockchain, batteries, copper, and more. You'll understand more as to why I'm so interested in what Abaxx is doing. I am long ABXX.

BTC USD Daily. Bullish engulfing. Ascending Channel. BTC closed on the 5th of May with an engulfing candle. Bitcoin won that day, but only just. Also price action currently remains within a larger ascending channel, two touches to the top so far and two touches to the bottom. A third touch of either may well be the break this time. Price action is still trying to move to the upside, for me, the bulls have it at the moment. I think it could test ATH on this run.
But...You will see my ascending line in red which is current price action support. If it breaks this convincingly then we may well look at a visit to the 50K region.
My immediate area of interest on this chart is the red ascending line, I am keen to see what develops there if we get another touch on it.
I'm not in a trade. I'm watching and HODL. But, I am bullish and will commit to being long.

Bullish Engulfing on the Daily... AND the Weekly 😳XRPUSD has now printed bullish engulfing patterns on the daily (today) AND the weekly (Sunday). Could be an outrageous two weeks if it confirms by EOD tomorrow!

Bullish Reversal - New ATH within the next 10 daysBITSTAMP:BTCUSD
After the massive selling pressure yesterday, Bitcoin bounced at the 52900 level. Today, we saw a huge correction to the upside.
As we can see, the last two daily candles form an engulfing pattern .
We also saw a higher wick of the daily candle than the yesterdays candle opening.
If the daily candle remains or closes above the yesterdays candle, we might see a bullish reversal which will confirm the higher low of last night.
Therefore, within the next 2-3 days we will see a retest of the 60K levels.

Engulfing Candle Each candle has its meaning. One of the most common
ones is the Engulfing candle that consists of a candle that
completely covers the previous one. In the graph, you can
notice how a last bearish candle has been completely covered
from an engulfing one. Momentum is changing!


AUDNZD - IN TREND BULLISH ENGULFING LONG SETUPAUDNZD has set up a perfect in trend bullish engulfing setup.
If price pulls back to the 50% area i'll be looking to enter there for a sniper entry.
Buy stop trade currently activated.
Confluences:
Higher high
Higher low
Real bullish engulfing
Lower bollinger band outbreak
TP set at previous highs close.
SL set 5 pips below bullish engulfing low.

Prince Pipes | FLAG PATTERN | Breakout with inverted hammer
Bullish engulfing
MACD crossover just started - Volume confirmation pending
Flag pattern
Flag pole length = 67 points
Lower flag cost = 487 points
Price target = 554/-
CMP= 528/-
Time target = 5 days
3rd May '21
Upper flag cloth resistance broken with Inverted hammer pattern. Watch out for tomorrow's move.
NSE:PRINCEPIPE

BTC - W1 - LAST WEEK PRICE ACTION TRIGGERED A BULLISH ENGULFING W1 : As shown on this chart, last week price action triggered a long white candle (bullish engulfing)
which neutralized the former downside risk.
In addition BTC closed above the Tenkan-Sen (Conversion line) which is also a positive sign.
The pivot level on this W1 time frame is @ 52'700.
Indeed, as seen in the past, this area coincided at the middle of long candle and therefore should also
be seen as an equilibrium level.
Therefore, BTC is caught now in a 52'700-60'000 trading range (59'979 being the high weekly closing seeing so far !)
GLOBAL PICTURE ON A WEEKLY PERSPECTIVE - IMPLICATIONS OF A BREAKOUT OF THIS TRADING RANGE :
Upside : Door open for 61'075 ahead of a retest of historical high @ 64'895
Downside : Mid Bollinger Band @ 47'525
Watch D1 for clues
Have a nice week and have fun.
All the best
Take care
Ironman8848


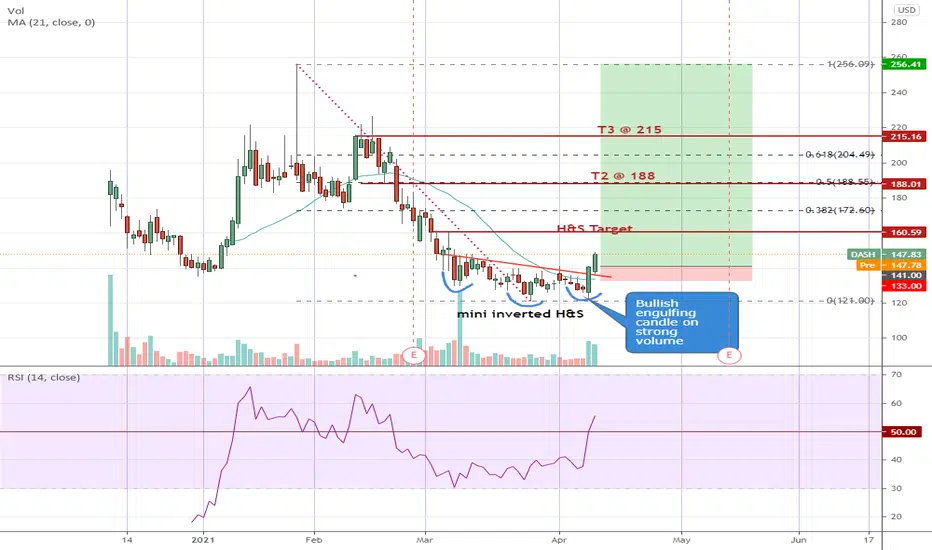
DASH - powerful price actionDASH bottomed out with a mini inverted Head & Shoulders before breaking above the neckline @ 136 with a strong bullish engulfing candle last Friday. More upside potential especially now with RSI clearing above 50.
Ideally one should have entered yesterday at the open @ 138 or as soon as it started to go above Fri's high @ 141. Otherwise, accumulate on any near term weakness with a tight initial stop loss below yesterday's candle ~ 133. Target shown are suggested only. Or ride the trade with trailing stops.
Disclaimer: This is just my own analysis and opinion for discussion and is not a trade advice. Kindly do your own due diligence and trade according to your own risk tolerance. Thank you. Feel free to give me your thoughts ! :)