Uptrend in USDJPYBullish engulfing formed in H4 and it gives more pressure to upside and also trend-line is breached.
Engulfing Candle

USD/CZK: LONG SIGNALSHello traders!
USD/CZK seems having reached a good support after a long downtrend!
- BULLISH ENGULFING PATTERN appeared on the 11st of June
- BEARISH MOMENTUM looks always weaker
- MACD LINE is really closed to cross the SIGNAL LINE
Remember to put a stop loss in order to secure your capital!
Not a financial advice.
Enjoy your trade!

Potetial Engulfing of GBPCADThere is a sign of engulf pattern. Its potentially go down to hit SnD area.
TP : 1,6718
SL : 1,7204

GBPCAD - SHORTBearish engulfing candle on the daily timeframe validates a move towards the downside for GBPCAD

Bearish engulfing SPY /weeklyThe $SPX is testing its 200sma on a daily chart, on a weekly chart, we are seeing a bearish engulfing candle (2 hours to go for close).
Next short-term support is $2950.
$VIX back above 40

EURCHF daily 0.618 and 4hr bullish engulfing combination longThe EURUSD short yesterday went so well.
Meanwhile, USDCHF was still very weak as the stock market slumped yesterday, making EURCHF had a significant pullback to 0.618.
It rallied a lot after consolidating in weekly 0.618 spot, and now it pulled back to the 0.618 of the current rally.
I'll be interested in this 4hr engulfing long.
Let's see how it goes yo!

EUR/GBP- 4 Hour overviewHello everybody!
-On a 4-hour chart, we can see that the price reached a resistance area, and then the price formed a very nice double top pattern.
-We can see that the price is forming bearish engulfing right now and that is a strong reversal signal.
-On a Stochastic indicator, we can see that the price is in an overbought condition so we may expect some bearish power to take control over this pair.
-On a 4-hour base, EUR is the weakest currency at this moment and GBP is in a pretty solid condition while on a 8-hour base, GBP is a little bit weaker than USD.
-If EUR remains weaker than GBP then we can expect that the price is going to continue moving in a bearish direction.
-WHAT DO YOU THINK ABOUT THIS SETUP?
Please let me know in the comment section!
THANKS FOR READING!
-If you have some different opinions please let me know and if you like this please hit that like button and give me support, I will appreciate every support.
-Remember this analysis is not 100% accurate. No single analysis is. To make a decision follow your own thoughts. The information given is not a Financial
advice.

Short BEL : Bearish Engulfing Supported by Double TopShort @73.5-74
Stoploss @77.4
Target 1 @68.9
Target 2 67.5
For educational purpose only.
You might see info lines on the chart, was tinkering with them :P

Short Reliance : Bearish Engulfing Short @ 1595-
Stoploss @1620
Target 1 @1535
Target 2 @1510
For educational purpose only.

Bearish Engulfing Pattern | AUDUSDThe Bearish Engulfing pattern consists of two candles. First one is a small upward candle followed by large bearish candle. The bearish candle must absorbs completely the previous one formed during the uptrend. The bearish candle is not required to cover the shadows of bullish candle.
Requirements for validity:
1. Market in uptrend;
2. Small bullish candle;
3. Second one is large and bearish that compleately cover the bullishcandle.
Tips:
These are standard trading rules. There are many more specifics about order placement that I will reveal in the next posts!
1. Do not trade by candlestick analysis only!
2. Always do combine at least two or more analysis!
3. For example:
- trend analysis (always works);
- support & resistance analysis;
- Fibonacci.
4. Follow us for more tips and analysis!
Recommendations:
Confirmation in the form of a downward candle with a closing price lower than the previous one or a downward gap is recommended, to be sure that the trend is reversing!

Waiting for the FED | AUDUSDAUDUSD reached its highest levels since the beginning of the year, recovering the entire decline!
Yesterday we saw a Bear Engulfing, which signals the current exhaustion of the rise.
It's caused by the accumulation of profits and the possibility of adjustment.
Today at 18:00 (GMT) we expect Fed Interest Rate Decision.
The news will be a catalyst for movement.
As no matter where we see a breakthrough, we expect the price to continue.
It is possible to place pending orders.
Support levels:
0,6681
0,6538
0,6458
Resistance levels:
0,7177
0,7273
0,7357
If you find this useful - give us a like!
If you have the same or different vision for the future movement - comment!

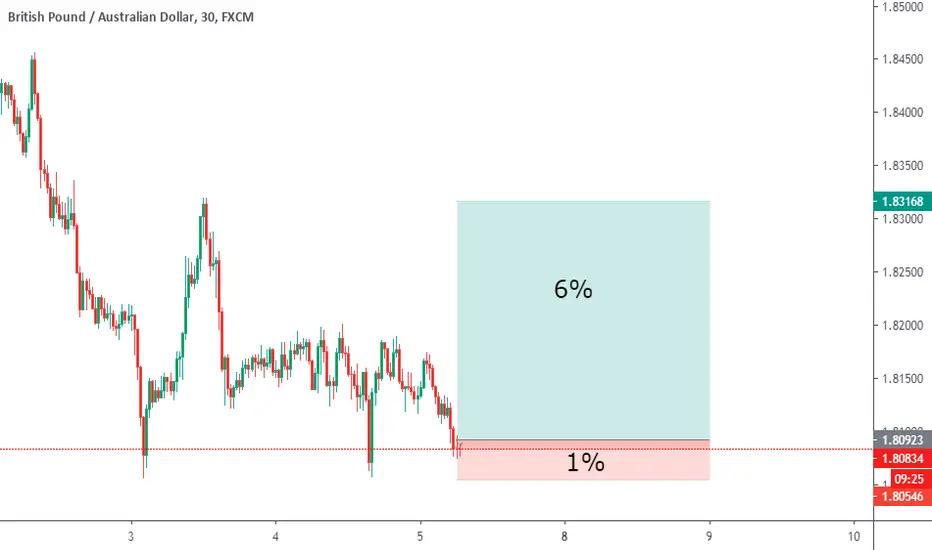
(GBP/AUD) Potential Long OpportunityGood Morning all. I hope this message finds you well.
Yesterday i got faked out by this pair, nothing major.
Today I placed a buy position as price is greatly oversold. Lets see how this one plays out - looking to hold this trade if the momentum is strong.
Advice for today:
Trading without a stop-loss is financial suicide. Always protect your capital no matter how confident you are!
Wishing you all the best
Forex Prodigy.
Short Relaxo : Bearish Engulfing Short @760-765
Stoploss @786
Target 1 @724
Target 2 @700
For educational purpose only.

EUR/GBP High Probability Short Trade with Risk and Reward 1:4.6Market Structure: Bearish (Failed to make higher high)
Momentum: Strong Bearish momentum
Chart pattern: Perfect Head and Shoulders
Candlesticks confirmations: Bearish engulfing and doji on H1 timeframe
RR: 1:4.65

OPORTUNIDAD DE COMPRA - CADCHFCONFLUENCIAS:
1. Envolvente y retest
2. Emas alcistas.
3. Confirmado en temporalidades mayores.

OPORTUNIDAD DE VENTA - EURCADCONFLUENCIAS:
-Emas bajistas
-Retest y envolvente bajista
-Confirmación de bajada, en temporalidades mayores.

EURUSD - Continuation of a strong trend?EURUSD is in a clear uptrend, with the pair that doesn't seem to show any sign of counter-trend or strong retracement.
Recent action shows a slight retracement, with buyers immediately reacting with a bullish engulfing pattern and a new higher high.
Stop loss below last important swing low and trying to have it also below the uptrend line.
I don't really have a take profit in this situation, I just want to join the trend and see when we have some signs of sellers on the market.
For now, I place it in order to have 1:2 as risk to reward ratio, but I might increase it if I see that the trend still has good momentum.

USDCHF Engulfing Candle & Break of High May Signal Bull MarketSuspected change in sentiment from bearish to bullish following consolidation, break of prior high and engulfing candle. Take profit sitting just above 100% Fibonacci extension achieves potential 1:3 RRR.

Bearish Engulfing Bearish engulfing pattern on 1D candle
short @97.50-98
stoploss @99.65
target 1- 94.6
target 2 - 93.5
RRR1 - 1.34%
RRR2 - 1.85%
For educational purpose only

Engulfing vs Convergence and golden crossWell no one knows the future but lets guess it :) this is our job to guess the future by these signs ...
As you can see we had big move ! it shocked every one including me :)
If you check this idea you will find it out what Im talking about.
We touched a strong resistance and we couldn't break it ! that was the resistance punch :)
But if you see the daily chart now, you can see a engulfing candle stick is forming, but there is still a hope for breaking 10k, rsi ...
If you see the support line of rsi here, and also macd ! you can see that there is still hope to break 10k area.
So Im saying again ...
Lets see what will happen and do not enter your trades before confirmation.
If you liked it, please hit the like button, share and write your comments, thanks for reading.
Take care, trade safe


BYND Engulfing Candle, Reached Resistance Area, Gap Down BellowBYND Engulfing Candle, Reached Resistance Area, May want to close Gap Down Bellow

USD/CHF- 1 Hour overviewHello everybody!
-On a 1-hour chart, we can see that the price reached the support area and we can see that the price is forming bullish engulfing so we may have very nice bullish setup.
-On a stochastic indicator, we can see that the price is in an oversold condition and that is an additional confirmation to take a long position.
-On a 4-hour base, USD and CHF are at a similar level but on a 1-hour, USD is stronger than CHF.
-If USD remains stronger than CHF then we can expect bullish movement.
-WHAT DO YOU THINK ABOUT THIS SETUP?
Please let me know in the comment section!
THANKS FOR READING!
-If you have some different opinions please let me know and if you like this please hit that like button and give me support, I will appreciate every support.
-Remember this analysis is not 100% accurate. No single analysis is. To make a decision follow your own thoughts. The information given is not a Financial
advice.
