CLX - rare green among the sea of red todayCLX tested the 50% fibonacci retracement and quickly proceed to form a bullish engulf candle. With bullish divergence on the stochastic, time to long @ 198 with initial stop at 193 and looking scale out between 210 (recent hi) and 210 (127% fib extension).
Disclaimer: This is just my own analysis and opinion for discussion and is not a trade advice. Kindly do your own due diligence and trade according to your own risk tolerance. Thank you.
Engulfing Candle

NZDUSD: SELL SETUPNZDusd as been in a clear uptrend since the past week but looking at price reaction and rejection towards the 0.616 level, I think buys sentiment is getting exhausted as H4 timeframe shows weakness with a bearish engulfing candle.
I expect price to move from where it is currently towards 0.606 level and maybe into 0.600 level. Looking at the Daily Timeframe, NZDUSD has been in a range, so it is much easier to predict price direction of where buyers and sellers would be . Every information to take this trade is quite explanatory in the chart .
Risk Warning : The risk of loss in trading Foreign Exchange (FOREX) can be substantial.
You should therefore carefully consider whether trading is suitable for you in the light of your financial condition.
Goodluck !

Short opportunity on AUDJPY with bearish engulfing barA bearish engulfing bar has formed at the resistance of the AUDJPY on 4Hr. The bearish engulfing pattern has momentum behind it as it is reversing a sharp uptrend that shows signs of exhaustion. Good trade. Have to watch it though because there might be some traffic along the way down.
Place pending order according to entry strategy. Use due risk and money management.

USDCAD Short term BuysFollowing USDCAD, we can see this major consolidation zone which has been around since Covid-19's Lock-down began. So, lets break this down further, this pair is in a range between my descending Trendline and this major support at 1.38701. As price rallied downwards last week, we came to our support zone and we did not break this support zone. Therefore, we initially look for buys at this support. Price casually bounced off of this support zone and created a nice bullish engulfing candlestick pattern (the yellow box). A classic pattern to come across. So, we will now place our entry at the top of the large bullish candle and our Stop Loss will go at the bottom of the same candle. We only use a 1:3 Risk to Reward Ratio for this trade, roughly a 1:2.5 which is still a healthy trade.
Entry: 1.29347
SL: 1.38445
TP: 1.41500

EURJPY Ascending Channel Look for sell and long BuyAscending Channel forming look for sell followed by retest of the trendline break back to the engulfing candle near the 60 percent retracement zone.

EURNZD Sell SignalEURO has rejected to break the key resistance level against Kiwi. Besides, it has created a Bearish Engulfing Bar which is a sure sell signal that can be supported by any technical indicator to pull the trigger. I would recommend the H1 timeframe to pull the trigger.

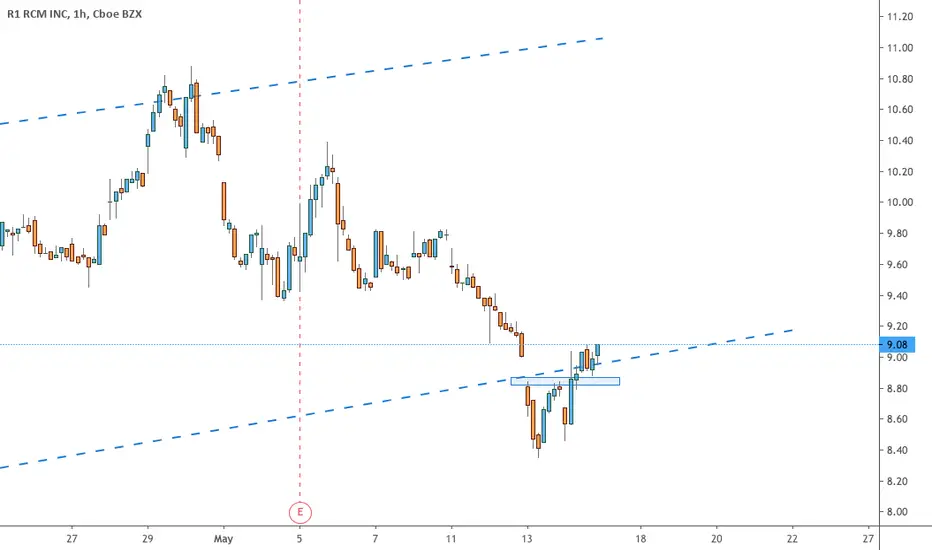
RCM forms Bullish Engulfing at Lower BoundaryAn Intraday setup to go long
RCM has been in an upward rising channel and price has tried to break down the lower boundary. However, the last session showed there are still buyers at this level and the session ended with a bullish engulfing pattern.
I am expecting some bullishness in the short term in the new session. This bullishness could be for short term or medium term.
The whole rising channel is part of a big correction and the opportunities only arise within this channel.


NASDAQ Short Term ForecastD1- Price has created a triple wave to the upside.
The price which was moving higher respected the key resistance zone formed by the 9500 psychological level, the 161.8% (9565.6) fibonacci expansion level of the first wave, and the 61.8% (9336.5) fibonacci expansion level of the second wave and is currently moving lower.
We had a bearish divergence and an engulfing candle pattern.
H4 - Price has broken below the uptrend line. Until this uptrend line breakout holds we may expect short term bearish moves towards the key support zone formed by the 38.2% (8327.2) - 50% (8004.2) fibonacci retracement zone of the daily triple wave.

POSSIBLE SHORT OPPORTUNITY Hello traders! We are looking at a possible short opportunity here as we see a bearish move that broke below a zone which is not illustrated on the chart. My apologies, however, the trendline was retested and we see a bearish candle that violated a zone. We could see a continuation following this retest. Look for confirmations for trading opportunities. There are 2 targets suggested if this idea is valid. This is an idea not a signal, sharper for educational purposes. React from the market not predictions. Trade smart don’t gamble.
-Rum

Old School Bearish Engulfing!Education: A bearish engulfing pattern is a technical chart pattern that signals lower prices to come. The pattern consists of an up (white or green) candlestick followed by a large down (black or red) candlestick that eclipses or "engulfs" the smaller up candle.
Do not ignore the BEAR in the market!

Can we fill the gap?Welcome to my daily market update (13/05/20):
So after the halving celebration (CONGRATULATION!) what is next? no one really knows, but my speculation is that the celebration is over, we can sell our begs and walk home...
I'm joking, well partially, why? because there is no more real Fomo to stay, the narrative is over. what another reason for whales to hold this price? we might see a lot of pressure to close at-least this gap (or just fake outs until we see big oversold candles and panic again).
For now, the smart thing to do for the mid-term is to stay bullish
- Daily bullish engulfing:
- Ascending triangle at end of fall - bullish.
- Should we close above 4h e21 it should bring strong momentum to close above the triangle, which means we should at-least test the cloud.
* failing to break up this triangle might actually show continuation of the trend downwards, going below 8585 again from my perspective will go much much deeper towards 7725.
As usual, my bigger picture is shorts, did good profits with that. lets see how it goes, but for you plebs? the smarter thing to do is longing this out.

HSI | bearish 1-2-3 reversal pattern
the strong red bar that broken the wedge a few days ago signaled the start of 1-2-3 pattern
at point 3 today, it will be an strong engulfing pattern
it is also a false breakout of 1) horizontal resistance, 2) a long-term downward trendline and 3) 50 SMA
I have three indices in mind: NASDAQ > SP500 > HSI, and HSI is always the weakest candidate for short
China's failure to obey trade deal could be the fundamental catalyst for this selloff

EURJPY - Swing Trading sell ideaEURJPY had a very strong short-term up-movement, especially due to a very weak Japanese Yen in the past 2 days.
In the long term, I still believe that the market is bearish:
We have the chance to trade the rejection on a very good level of resistance.
Although the first reaction is promising, we have a bearish engulfing pattern, the market is coming from a very strong up-movement, so I want to wait for a second confirmation.
There's a candlestick (the one where the red horizontal line starts) that shows a first attempt by sellers to push the price down, but buyers proved to be strong enough and we had a so-called pin bar.
This is a second attempt and we want to see sellers closing the session below the low formed by last attempt, so I place a stop entry order below it, below the red horizontal line.
Stop loss above the resistance and take profit slightly above last important long-term swing low, where I will evaluate if it is better to take the profits or keep the trade for a breakout and a new lower low.

Bitcoin will plunge to 7700$Bitcoin will dive to 7700 because we're witnessing a engulfing candlestick and the moving crossover are tight to each other and are to cross over.
Take profit around 7700$
Don't think it can go easily up, this resistance above is strong, it need one leg more to go down.
Have a nice trading week and risk reward

Coming week, Aussie expected to go stronger against dollarA day before NFP, on Thursday, the aussie continued to strengthen against the dollar. On the daily, it showed upside volatility and broke through the 0.6459 resistance. A bullish engulfing bar was noticed which indicated that prices would rise further.
With the US unemployment rate now at 14.7% and negative GDP growth of 31.22% expected for the second quarter, the aussie would continue to strengthen against the dollar in the coming days. I am looking for long opportunities here.


BE + SSR [SIGNIFICANT SUPPORT & RESISTANCE] AS ENTRY POINTThis is my point of Entry based on my previous analysis : USDCHF

What's WRONG with XTZ?Hello everyone! The bulls are here, yes, but you guys know that I’m out of XTZ and I’ll not buy it any time soon. Some people asked me why I'm not attracted by XTZ the same way as to some other cryptos right now, and the answer is simple. I only wish XTZ hit the trendline and went closer to that red line, or better saying, I wished for a little stronger pullback. Just it, there's nothing wrong with XTZ. :)
But that’s good news for those who are already long here, because the bulls are so strong that they didn't even give a chance to someone who’s out to jump in the trade. On the other hand, other cryptos just made a bullish engulf near their supports, and that’s why I’m looking at them right now. XTZ did a harami near the 21 ema yesterday, which is also good, but bullish engulf are stronger, and since I’m out I’m choosing other cryptos right now. But I wish all the luck to those who are in XTZ!
Also, it's important for you guys to note the hourly chart:
The price is above that black line, which is a real war zone, and the only thing XTZ should do now is to close above that green line, which is the 61.8% fib retracement in the weekly chart! Look here:
So, that will be the final challenge for XTZ right now. After that you can find a “resistance zone” in the daily chart, and lastly, the U $ 3,944, the previous top. My best regards to you guys and stay safe!
Remember to follow me, I'm a trader who uses the classic technical analysis (barely any indicator, just the candles and the volume). Like this idea if it helped.
Thank you very much.
* LIKE this idea and FOLLOW me, because:
- Here, you will see clean charts;
- Trades with clear risk management;
- The best of Dow Theory, Price Action and Candlestick psychology;
- Chart patterns with statistics. *
* My name is Nathan, I'm a trader and portfolio manager and I'm here to LEARN. Leave your COMMENT and FOLLOW me to keep in touch. *

XRP - Bulls on Parade?Ok, XRP is behaving properly, it did a bullish engulf above the “triple support” , which is amazing, and now everything is going according to the plans. That bullish engulf was triggered today, but to help with our decisions, I think it is important to keep the hourly chart in mind:
Similarly to LTC, there’s a important price zone (in this case, the blue line) to be surpassed, and if the bulls manage to keep the price above this zone, we can start a long position with more conviction. Also, you could’ve bought half of your original position after the breakout of the bullish engulf in the daily chart and wait for a close above that blue line in the hourly chart to complete your position. Your call, we traders must do what makes us psychologically comfortable with the situation.
Now, let’s look at the weekly chart:
The bulls are strong here too, as they are keeping the price above the 21 ema and the fib retracement. If everything goes right we can see XRP at the 61.8% fib retracement in the future.
Remember to follow me, I’m a trader who uses the classic technical analysis (barely any indicator, just the candles and the volume). Like this idea if it helped.
Thank you very much.
* LIKE this idea and FOLLOW me, because:
- Here, you will see clean charts;
- Trades with clear risk management;
- The best of Dow Theory, Price Action and Candlestick psychology;
- Chart patterns with statistics. *
* My name is Nathan, I'm a trader and portfolio manager and I'm here to LEARN. Leave your COMMENT and FOLLOW me to keep in touch. *

LTC - I'm about to BUY MORE!As you guys already know, I’m seriously thinking in buying more LTC and I’m still holding a long position since Apr 22, when we bought it for the first time. If you missed this trade, I’ll put the links about it bellow, and follow me to keep updated, here you’ll find daily analyses about cryptos and other assets I’m trading.
Technically I could’ve already bought more LTC today, but as I said in my previous analysis (also, link bellow) I’m waiting for an important sign in the hourly chart. Let’s look it again:
I’m waiting for a close above that black line. It’s an important price zone to surpass, and if the bulls manage to keep the price up will be an amazing sign. Although in the daily chart we see a bullish engulf, which was triggered today, I’m just waiting this sign here. Now, the weekly chart:
I’ll maintain what I said in my last analysis here. Yes, there’re two resistances here, the 21 ema and the fib retracement, but if the bulls keep going giving us good signs in the daily/hourly basis, it’s easy to imagine LTC near the 61.8 fib retracement.
Remember to follow me, I’m a trader who uses the classic technical analysis (barely any indicator, just the candles and the volume). Like this idea if it helped.
Thank you very much.
* LIKE this idea and FOLLOW me, because:
- Here, you will see clean charts;
- Trades with clear risk management;
- The best of Dow Theory, Price Action and Candlestick psychology;
- Chart patterns with statistics. *
* My name is Nathan, I'm a trader and portfolio manager and I'm here to LEARN. Leave your COMMENT and FOLLOW me to keep in touch. *

ETH - May the BULLS be with us!Okay, so ETH did a classical bullish sign to us, a bullish engulf near a strong support area, made of 1 - the 21 ema; 2 - the purple trendline; and 3 - near the black line (previous top). Our last trade here was a very good one, we long at that “Harami cross” in the chart all the way to the 61.8% fib retracement, the links about this trade are all bellow. Also, I invite you to follow me to keep in touch with our trades and analyzes.
Now let’s see the hourly chart:
Here we find a reading similar to the daily chart, and I’ll stress how important will be for the bulls if they manage to keep the price above that blue line, which is the fib retracement. There’re some supports here, like the green line, the pink line, the black line, and finally, the purple trendline. Now, the weekly chart:
As I’ve been saying, yes it bugs me a little that the price is near a fib retracement, but we can’t discard a “V” pattern here. The bulls seems to be very strong, and the trend will continue until a clear reversal sign occur (as Charles Dow used to say). Meanwhile, we are long here.
Remember to follow me, I'm a trader who uses the classic technical analysis (barely any indicator, just the candles and the volume). Like this idea if it helped.
Thank you very much.
* LIKE this idea and FOLLOW me, because:
- Here, you will see clean charts;
- Trades with clear risk management;
- The best of Dow Theory, Price Action and Candlestick psychology;
- Chart patterns with statistics. *
* My name is Nathan, I'm a trader and portfolio manager and I'm here to LEARN. Leave your COMMENT and FOLLOW me to keep in touch. *
