#REN : Upto 75% Profits Opportunity In The Mid Term.#Accumulation_Recommendation
Pair : #REN / #BTC
Technical Analysis
Pattern Creation : On the daily time frame of REN and BTC pair on Binance we have seen that a creation of a bullish engulfing candle stick with a good shape of a falling wedge. It is still trying to break out from the falling wedge and can't be considered as a confirmed call unless we see a close above the resistance line of the triangle.
Indications :
Volume showed a very good amount of increase on the yesterday candle but is currently showing a slow and decreasing volume level on today's scenario. This might be taken as an indication for a false pump if the trading volume continues to decline further by the following days.
- RSI looking good and on favor of the bulls but we still need a cross over by the MACD lines and seems to be on the way though. EMA is still above the current price at around 877 sats and need to go further downward below the price for a confirmed call.
Note : For a confirmed and confident trading move we need to break the price level represented by the red circle on the chart. And Volume needs to continue to be flood in for a more bullish trend too.
Even though its looks a risky trade at the moment, using a strict stop loss and risk management we can have a good profit for the mid term.
Accumulation Price Area : 790 sats - 820 sats
Distribution Targets
Target 1 : 872 sats
Target 2 : 920 sats
Target 3 : 973 sats
Target 4 : 1055 sats
Mid Term Targets
Target 5 : 1137 sats
Target 6 : 1202 sats
Target 7 : 1254 sats
Target 8 : 1402 sats+
Stop Loss : 681 sats
Capital Accumulation : 3%
Risk : High
@Togetherweaccumulate
Engulfing Candle

forexTrdr GBPUSD BEARISH ENGULFING + HEAD SHOULDERS + DIVERGENCEMorning traders
Looking at a great setup on British Pound versus US dollar with Bearish Engulfing candle pattern forming on the daily charts between Friday and Monday and drill down to the 4 hourly charts and we see a head and shoulders pattern forming. Both suggesting British pound is about to head lower versus US dollar.
Additionally we have bearish divergence on RSI charts with higher high in cash price which formed the head of the head and shoulders pattern but only forming a lower low on RSI as volume supporting the price action declines.
Stops set just above the head level and targeting a move back down to sub 1.21 sets up a 3 to 1 risk to reward.
If you are interested in more of our trades get in touch, offering a 30 day free trial currently
good luck trading this week!

XAUUSD hourly engulfing after hitting 1528 demand zone.XAUUSD pullbacks to hourly demand zone in Euro market,
which is the trade that I've been waiting for since last Friday's rally.
I'll be very interested in this 0.618 pullback of the engulfing,
Let's see how it goes yo!!

DAX Price Alert / Bearish Engulfing Candlestick PatternDeutsche Boerse AG German Stock Index DAX.
The German Stock Index is a total return index of 30 selected German blue chip stocks traded on the Frankfurt Stock Exchange.
The DAX has a base value of 1,000 as of December 31, 1987.
Candlestick Pattern: Bearish Engulfing
The ideas and price alerts published here are not financial advices.

Possible short opp on its way Possible short opp on its way
Wait for the break and the close and then only start to think about your entry technique

EURUSD Potential Double BottomEURUSD bounced off resistance level at 1.1066 twice with 2 bullish engulfing candles, creating a potential double bottom and a great opportunity to buy.

USDCHF Short Opportunity at Psychological ResistanceLooking at the USDCHF daily chart, a bearish engulfing candle has formed around 0.98, a psychological resistance level.


NZDUSD #Forex #ForexTrader #ForexTrading #ForexChartNice shorting opportunity.. pull back to structure.

EURUSD - Bearish Movement #cwsignalsBearish movement on the EURUSD, tracked from monthly timeframe down to 4H based on engulfing candles.
Blue = Monthly;
Purple = Weekly;
Black = Daily;
Red = 4 Hours;

EURJPY - Bearish MovementBearish Movement on the EURJPY pair, tracked from monthly timeframe down to 4H based on engulfing candles. Opportunities for day trades as well as swing trades

GBPJPY - Bearish MovementBearish Movement on the GBPJPY pair, tracked from monthly timeframe down to 4H based on engulfing candles. Opportunities for day trades as well as swing trades

GBPUSD - Bearish MovementBearish Movement on the GBPUSD pair, tracked from monthly timeframe down to 4H based on engulfing candles. Opportunities for day trades as well as swing trades

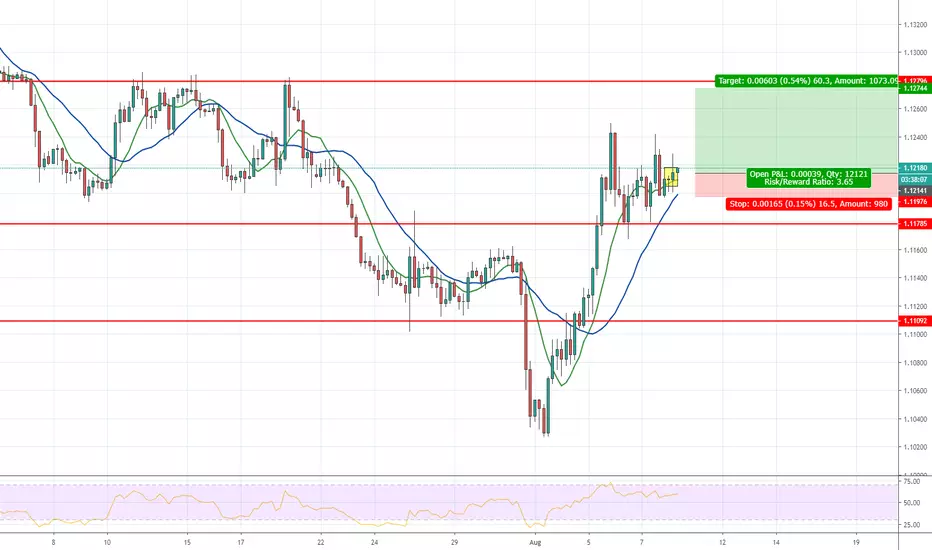
Buying in up trendBullish engulfing completed pinning the moving average
Entering at market price 1.12157 with
# SL below the engulfing at 1.12141 and
# TP targeting next resistance at 1.12744
You can learn price action trading at no cost. Join my mailing list to receive more information zc.vg
Join me in Forex Bootcamp for live updates using the link below.
Happy trading :)
NASDAQ - Engulfing on 4H chart, more downsidside expected.Trade Idea
Broken out of the channel formation to the downside.
A mild correction has been posted from yesterday’s low, this is seen as a retest of the breakout level.
The bearish engulfing candle on the 4 hour chart is negative for sentiment.
Negative overnight flows lead to an expectation of a weaker open this morning.
Further downside is expected although we prefer to set shorts at our bespoke resistance levels at 7500, resulting in improved risk/reward.
Stop: 7570
Target 1: 7160
Target 2: 7000

EURUSD short after a bearish engulfing candleBulls are losing their buying power and there is a bearish engulfing candle, most likely it will bounce to the downside to get back up again.

btc closes weekly candle as a bullish engulfing candle!time to buckle up and enjoy the ride! We have currently retested the double bottom neckline and should confirm a daily higher high on the next 1 day candle...that along with the 3 day golden cross and the weekly closing as a bullish engulfing candle means there are bull signs everywhere! There still a slight possibility on this first attempt to trigger the double bottom that bearwhales could still dump us back down even all the way to 8.5k or even 7.2k on a fakeout...but as long as we achieve the higher high on the daily which I strongly believe we will....we could do a fakeout and dump here and still very easily rebound around that zone and still trigger the double bottom. I'm not relying on or waiting for a dump like that to occur but will have a little bit of fiat ready to buy a dip like that should the opportunity arise.

BTCUSD: weekly bullish engulfing candleBTCUSD getting ready for another weekly bullish engulfing candle.. The chart does not need much more words...

AUD/JPY short setupAUD/JPY short setup- I saw the retracement one the resistance zone and nice candlesticks such as pin bar and engulfing and I decided to open a short trade on this pair.

CRUDE OIL – Multiple Inside Bar Pattern + Bearish Fakey SetupWelcome to MSCapitalTrading, We provide any kind of Technical and Fundamental Analysis for Forex and Indices, Commodities, CFD and Stocks Markets every day.
DAILY
Multiple Inside Bars + Small Pin Bar have been present since last week, A Breakout of mother candle would impact to more downside.
NOTE
Always take 1% risk on each trade for capital preservation.
Regards:
Carlos Smith.
Leave us a comment or like to keep our content for free and alive.
Have a great Day for everyone!


AUDUSD Long (FInally) - 4hr engulfing - this is going to flyHello all - DuncanForex here with another trade idea
Following USDCAD gaining traction to go short yesterday, AUD finally gained strength overnight and printed a great engulfing candle on the 4hour
I have entered on the break of the high and also have buy limits set at the 50% retracement in case there is some price chopping later - it should enter me in at those better prices too
thanks for looking
I expect USD to be weak through the whole of august.
DuncanForex.com is now live
thanks for looking at my trade idea
Duncan

BTC/USD WEEKLY SHORT, LONG-TERM.BTC/USD WEEKLY SHORT, LONG-TERM.
The bearish engulfing is one of the most important candlesticks
patterns.
This candlestick pattern consists of two bodies:
The first body is smaller than the second one, in other words, the
the second body engulfs the previous one.
This is how a bearish engulfing bar pattern looks like on your charts,
this candlestick pattern gives us valuable information about bulls and
bears in the market.
In case of a bearish engulfing bar, this pattern tells us that sellers are
in control of the market.
