TSLA - ShortShort on TSLA today. Breaking support levels!
"Tesla’s earnings were a ‘debacle,’ says longtime bull in scorching commentary" -MarketWatch
MarketWatchApril 25, 2019
Engulfing Candle

Double top and bearish engulfing pattern and price in overboughtA good shorting opportunity
bearish engulfing pattern formed after wipro announced it's result
i have also checked the delivery percentage which was less.
if price is decreasing and delivery percentage is less then it indicates very less interest of people to accumulate
also price is in overbought region as per RSI indicator.
and lastly it looks like a double top has been formed after a uptrend in price which could mean that trend is about to reverse

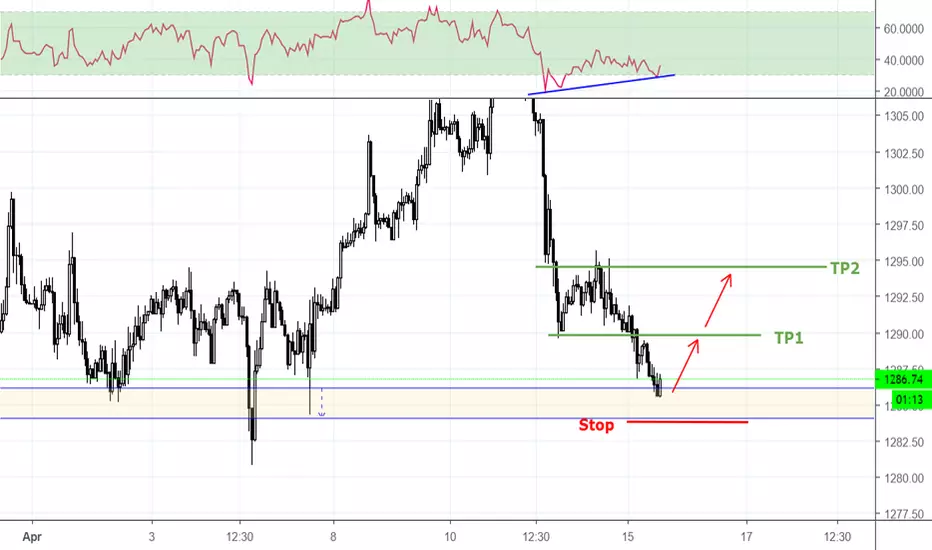
Buy XAUUSD (1H)in 1H chart :
Support Zone at 1285
Oversold in RSI indicator
Divergence in RSI indicator
Engulfing candle stick pattern
> Buy
Entry : 1286.5
-Stop : 1283.8 (27 pips)
-TP1- : 1289.5 (30 pips)
-TP2- : 1295.0 (85 pips)
Buy EURUSD (Daily Candle)in Daily chart :
Bullish Engulfing candle stick pattern
> Buy
Entry : 1.1244 (50% of Monday candle)
Stop : 1.1200 (44 pips)
TP1 : 1.1350 (106 pips)
TP2 : 1.1444 (200 pips)

Sell USDCAD (Daily Candle)in Daily chart :
Bearish Engulfing candle stick pattern
> Sell
Entry : 1.3345 (50% of Monday candle)
Stop : 1.3400 (55 pips)
TP1 : 1.3200 (145 pips)
TP2 : 1.3080 (265 pips)


RIGL-SHORTTwo big red candles, double top = selling pressure to the upside, is everyone out yet that wants to be out? that is the question. Short here with 1 ATR stop and a 20% target to the down side.

USDCHF Trade IdeaThe trend is currently bullish so I am looking for buying opportunities
Using the 21 MA I spotted a bullish engulfing candle pattern just completed
Buying @ market price 1.00008 with
Sl below the candle pattern @ 0.99737 and
Tp higher up around resistance @ 1.00568
Always exercise good risk management
For trade management details please join Forex Bootcamp using the Telegram link below

Short AUDUSDWe are short AUDUSD and see a bearish engulfing pattern identified by the candlesticks with black arrows, however there could be a potential counter attack if the resistance level of 0.713 is breached. However we expect the downtrend to continue despite better than forecast Australian retail sales (0.8% actual vs 0.3% expected). This is because the RBA don't appear to be inclined to raise rates in the near term having held having held the cash rate to 1.5% on the 02.04.19. Strong US data starting with today's non farm payrolls and unemployment rate could lead to further downside for AUDUSD.


MYGN - SHORTIn at $33.29. 1 ATR stop in place. Target = 20% Bearish engulfing. Biotech sector bearish.


cadnzd bullish move.on the cadnzd pair, I see bullish potential from support zone + falling wedge pattern. Price reacted very well from support with an engulfing bar and has retested newly formed support zone. Looks like potential inverse H&S but can't be too sure on that.
Price has also reacted very well off newly support zone.
