ENGUSD Falling Wedge!Resistance turned support can be seen on this major trendline
A trendline can also be drawn creating a falling wedge
This will likely break out to the upside incredibly,
I'll be watching this one
Enigmabitcoin

ENG.BTC (Y20.P3.E1).Under the radar.Go long
Hi All,
ENIGMA (ENG) has the potential for big gains ever since its broke past the weekly 21 EMA and a long term trend line\resistance.
For now, its one asset that has my attention and a small position on it. I will be buying pullbacks on it and this one is a longer term play.
I have the 1st target as per the chart.
Please give me a like or tick for this post.
Cheers,
S.Sari
Daily chart: All the indicators show bullish signs, in the pairing
The USD calculated 1st target


ENGBTCThe correction of Enigma seems to be over (Wave B) and we can expect wave C for more than 600% gain in the long term.
In the chart, you can see short, medium, and long term targets!!


A Dying Coin? Or a Falling Wedge Opportunity ENGUnder MA cap
Many alt coins look 'healthy' and are sitting above this level
Is this the key to a coin purge?
Personally i am long this due to its partnership with Intel
Or is it simply dipping underneath?
Feel free to leave comments below

Enigma Hourly - Bet on BreakEnigma has formed a large ascending scallop relative to the hourly time frame.
The upper resistance of this is looking to break.
I've included some chart patterns the major one is the bump and run
Where price "bumps" above the major trend, and then "runs" back to the trend.
I really like this coin.


ENG/BTC Enigma >> $$Enigma, ready to go up in price
1TP1: 0.00007550 profit 100%
TP2: 0.00015 profit 330%

ENG/BTC Long term holdENG is showing an under-over pattern. Below support the most volumes were transacted meaning this was likely a reaccumulation range. Right now it has reclaimed the previous support and has shown a retest on the weekly and twice on the daily. With the possibility of a 66% and 130% move to the upside this level has low risk to take a position. A stop below the VPOC of the re-accu range should suffice since it's likely the investors will protect their positions.

ENIGMA -> Moon ?ENG looks ready to break the downtrendline which started in Januari 2018, right before the burst of the Crypto Bubble.
If ENG breaks this trendline, it's off to the races. I'd wait for a close above 3100.

Enigma the wind of change!Without too much bla bla bla :D everything on the chart.
Trade in profit! Push up Like button if you like my reviews and help you understand the current market situation! Subscribe to the channel and stay tuned for trading ideas that are not trading recommendations.
And remember! You must have your head on your shoulders! Do not trust anyone - not even me :)
Thanks to your likes, I understand how many people rated my review positively. I spend my personal time monitoring the market situation and share my opinion openly with you. Please take this moment into account and treat it with understanding.


ENGBTC forming bullish Butterfly | Upto 43% bullish move aheadPrice action of Enigma / Bitcoin is forming a bullish Butterfly and soon it will be entered in potential reversal zone.
This PRZ area should be used as stop loss in case of complete candle stick closed below this area.
I have used Fibonacci sequence to set the targets:
Buy between: 0.00005540 to 0.00004948
Sell between: 0.00006000 to 0.00007108
Regards,
Atif Akbar (moon333)

EMGBTC - similar setup NULSBreakdown of the downtrend will be after the white line crosses the resistance line.
At least I expect growth to the level of testing EMA 200 at a price of 0,00006682
wonderful oscillator shows bullish mood
MACD in bullish divergence

Enigma/Bitcoin (June 30) #ENG $ENG #BTC $BTCAccumulate : 4200-4500
Sellzone : 5300-6300-7200
Holdzone : 13800-21500-36500-58000
Stoploss : Under 4000

Daily Bullish Signal $ENG #ENG (28 Feb 2019)RED ARROW indicates the EXPECTED Time and Targets
Level Stoploss point up to maximize profit and reduce risk
I'm working all the time, even in Bearish Market

Daily Bullish Signal $ENG #ENG (23 Jan 2019)BLUE ARROW indicates the EXPECTED Time and Targets
Level Stoploss point up to maximize profit and reduce risk
I'm working all the time, even in Bearish Market

ENGBTCENG/BTC
The falling wedge pattern has formed
A reduction to the support line is allowed
From the support line I consider it logical to make a purchase
Fibbo immediate target 78.6
The main goal is at Fibbo 61.8

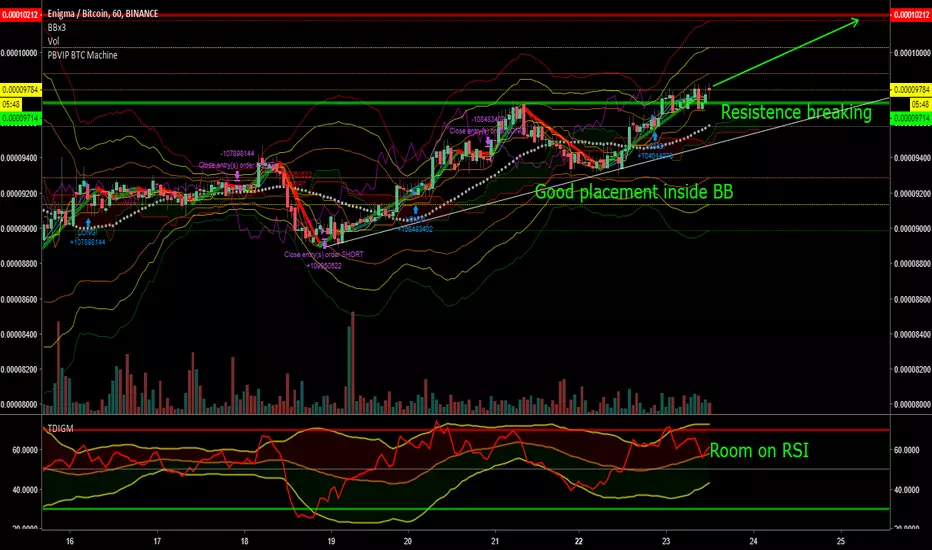
#ENG Channel Spectation.
Entry: 9951
Target: 10990 (10.5% profit)
Stop-loss: 9514 (4.25% loss)
Risk:Reward = 1 : 2.5

Enigma is preparing for departure.. Hope no delay!!T1: 0.000130
T2: 0.000150
Departure target: 0.000230-0.000250

$ENG #ENGBTC Extensive Technical Analysis -Day Trader ExplainsHello Lads and Ladies,
Welcome back to TJs Daily TA session, this time requested by the Elite Trading Group, we will be looking at ENGBTC on the daily timeframe. As you see with the last TAs we are on a GEM-HUNT and getting all coins that are pretty bottomed out together and posting them here with nice targets so some lazy readers can simply follow it now and learn how to do it themselves.
The first thing that comes immediately in my eyes is that we have here very string trend angles which have been respected multiple times. As you can see the uptrend support lines have all a strong angle that is being respected. This angle indicates that Bulls of ENG are string and not really jumping on and off. As soon as they are there, everything goes up in the same angle and momentum. Pretty easy to follow, right?
As in most coins before we can see here very clearly almost the same structure of an exponential increase, a retracement, a bear flag and then even stringer downtrend which has ended at a strong level of support and is now flat with and increasing buy volume and momentum. We are in an accumulation zone where traders like us see the obvious opportunity and simply start accumulating more and more as the time proceeds since once again the longer we take to "pop" the higher and bigger will our "pop" be.
This time we will be taking the Fibonacci Tool and looking for potential targets instead of using only horizontal supports and resistances. It is applied at the top of the bear flag with 100% and at the bottom of the strong downtrend 0%. Once again here, we need to break the 61.8% retracement line to confirm an uptrend. Anything before that is "simply" a retracement. YET, as you see, even inside this retracement you have a 200%+ opportunity.
Now taking a look at the art, that we have created here on the chart.
If you want a perfect example of a falling wedge and its breakout look at the very first one on the chart. Could not be better.
Back to where we are right now - support. We can see the purple curved line which indicates a support as well. This MIGHT be the path ENGBTC will take in the next months. While having the horizontal supports as "backup".
We also see two small orange lines pretty much at the bottom. These lines have different meanings and can be used as follows.
The first case would be - Stagger down to support and take profits at the two small orange lines (for a short-term trade).
The second case would be - A close above the first orange line indicates that you can start buying and staggering down. The close above the second orange line is the last and full indication of a breakout and will most likely continue to the indicated targets.
Now, lets take a look at our indicators.
FOMO - is a clear buy signal, which might continue for quite a bit more.
Trendline - is green, confirming the direction and indicating an uptrend.
RSI - with 66 points is pretty high, yet up trending as well and has not seen a really straight move upwards.
StochRSI - Is with 100;99 very high, yet after such a big downtrend it is quite normal.
What I would like to see?
I think, a re-test of the curved uptrend line with a small wick below would be perfect. Simply to re-set some indicators and fill up my orders.
Speaking of orders, he is how I will do my trade:
ENG/BTC Binance
BUY 10000 - 9500 - 9120 - 8750 - 8250
TARGETS 13140 - 14816 - 18913 - 22224 - 25535 - 36255
Stop Loss CLOSE below 7777
Like and Follow me and you will find this page interesting because I am a TA expert and professional day trader in crypto since 2012 that does daily updates and new posts about the hottest and most discussed coins.
This is as always a delayed post, if you are interested in first hand news, feel free to join our group,
Cheers, TJ