ENJ/USDT BUY SIGNALThe BTC has been able to produce a new higher high, implying that the crypto market remains healthy. ENJ looks good technically and can provide a strong RR opportunity.
ENJ

ENJIN - Gaming Crypto landscape has changedEnjin had gone SO well for us and thank God we have the good habit of taking profit and re-investing.
AXIE INFINITY, Sandbox, ALICE, have all taken a piece of that pie (NFT/Gaming) and Enjin seems to be struggling for direction.
A lot needs to happen to see new all time highs but we still love our ENJIN and we carry some.
I did not buy Enjin because of the NFT craze. I bought it because of the research showing only good things about them but for the time being Cardano is a better option for my money, my opinion.
A nice one about Enjn here : Enjin Coin: All About Fake Swords, Fake Real Estate, And NFTs Near Future

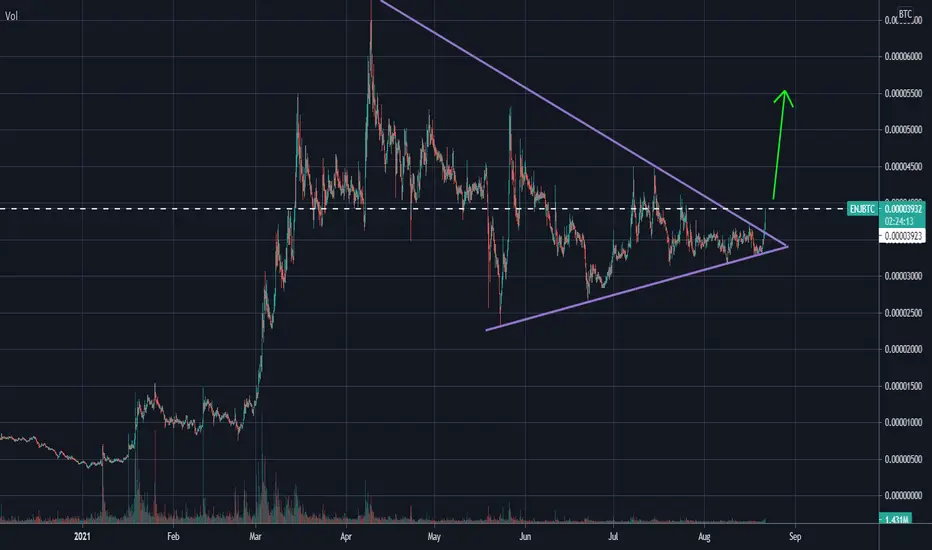
ENJ - Breaking out of a Massive PennantI've been waiting for this breakout. The price could move quickly once we get past that white dashed resistance area.
ENJUSDTHello to you all. Mars Signals team wishes you high profits at all times.
We are in a 4-hour time frame. As you can see, the price has been able to break its resistance and stabilize above the line. We have drawn a support line for you dear ones that can support the price. And we intend to be able to reach our goal over time.
Warning: This is just a suggestion to you and we do not guarantee profits.
Wish you luck!

ENJ/USDTOne onother BIG opportenity of +30% GAIN in ENJ/USDT;
You are ready for that?
Not yet!!
You will miss a lot, then.

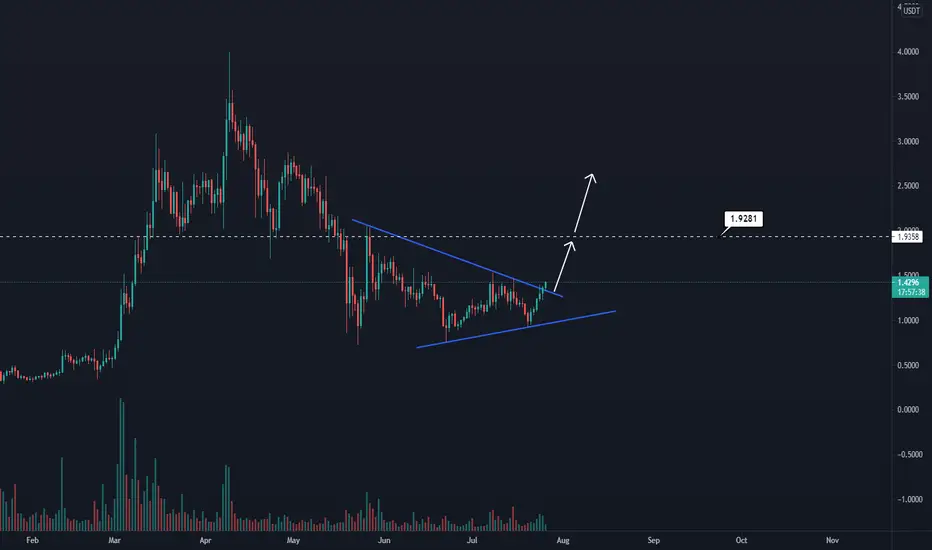
ENJ to test $1.80?We've been in a strong sell-off & now testing the upper resistance, what makes me think we will see a Uptrend unfold is the RSI, we have created a Triple Bottom which usually leads to a bullish trend.
If we were to fall to the $1.50 resistance then we would see a Consolidation or Bearish trend unravel Tuesday into Wednesday.

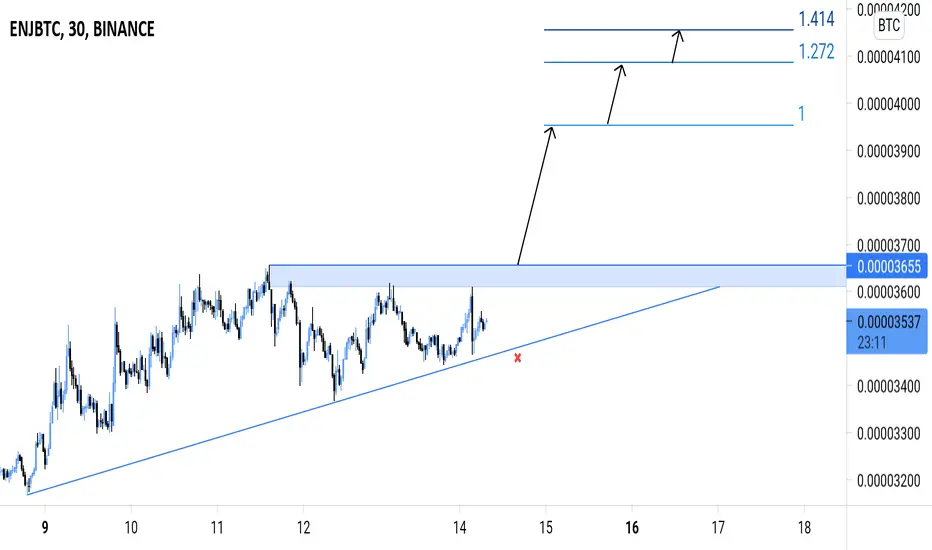
ENJ/BTC { ENJIN COIN } - BULLISH SETUPANALYSIS 🔎
- ENJ/BTC is printing an ascending triangle pattern.
- This is a bullish build up pattern.
- There's a breakout potential.
BUY ENTRY ⬆️
- Market entry: current market price.
- Stop limit entry: breakout above the ascending triangle's horizontal resistance (@0.00003655)
- Limit entry: test of the ascending triangle's inclined support.
TARGETS 🎯
- Fibonacci extension levels.
SETUP INVALIDATION ❌
- Breakdown below the ascending triangle's inclined support.
ENJUSDTHello to you all. Mars Signals team wishes you high profits at all times.
We are in a 4-hour time frame. As you can see, the price has started to move higher after approaching the support line again and we intend to be able to touch the target. We expect the support line we have drawn for you to support the price again in the event of a fall.But in case of falling below the support line and stabilization, we can consider more fall.
Warning: This is just a suggestion to you and we do not guarantee profits.
Wish you luck!

Why Log charts can be helpful in the crypto marketAs you can see, previous peaks almost disappear and become irrelevant as each new bull move occurs
Log charts provide a more detailed perspective of price action
Its crazy to think ENJIN could be $140, if that $140 price was hit, would tower over the current peak which is already massive

ENJ 4 Phase UptrendHere I have created what I call a 4 phase Uptrend, it's us creating Higher Highs & Higher Lows. But I got a little fancy with it, but it's why I do believe we will see some type of pullback maybe even another Inverted Head & Shoulders.
Our next resistance is at $2 so we have a possibility to see that this weekend if this Bullish Market sticks around.

ENJUSDTENJSUDT Breaking out on daily TF it was in consolidation zone from long time .soon 2$..ENJ ENJUSDT

ENJ/USDT BUY SIGNALmedium to long term buying opportunity is presented by enjin coin. Certainly looks like price bottomed out

ENJ/USDT BUY SIGNALA short term buying opportunity for the Enjin Coin, looking for around 6% growth during the next 48h or less.

ENJ TO 5 USDHELLO COMMUNITY
AS WE CAN SEE ON THE CHART ENT IS NEAR A MAJOR SUPPORT SO WE NEED TO CONFIRM THE BUY ALERT AFTRER THE BREAKOUT AS INDICATED
TRADING IS PATIENCE
THANK YOU AND GOOD LUCK

ENJUSDTHello to you all. Mars Signals team wishes you high profits at all times.
We are in a 4-hour time frame. As you can see, the price has hit the support range and we intend that the price can start moving towards our target if we do not see weakness in the trend. But if the price can not be supported, we consider the fall to the next support.
Warning: This is just a suggestion to you and we do not guarantee profits.
Wish you luck!

ENJ|USDT🚀Hey hey my friends👋
ENJ pump is going to be nice, the bitcoin pullback gave us a perfect re-test of the breakout


ENJUSDT breakout confirmed!ENJ breakout Confirmed, High potential of rise up to mentioned zones.
Please press like button and write your opinion about this analysis.
Be profitable
All depends on BTC! ENJ will move soon!Here's a Quick look at ENJ 6 hr chart. As we can see, the price has printed a bigger symmetrical triangle and we could see a bigger break to the upside soon. The best entry would be, when the price breaks above the triangle with good amount of volume . This is a sleeping beast! Keep an eye on this setup.
-------------------------------------------
The idea is: Buy the breakout from the triangle and take profits at the levels shown in the chart.
Targets:
1. 1.58$
2. 1.65$
3. 1.73$
4. 1.84$
- Profits can also be taken in the resistance zone .
-------------------------------------------
If you like the content, then make sure to comment and like the post :D
Follow me for daily profitable trading setups
BTC dictates the market. If BTC falls, then Alts will fall as well. Trade safe!


ENJ/USDT 1DAfter a clear SHS, Enju goes for a descending triangle with a breakout by the top. Expecting a take profit at the level 0 of Fibonacci ( extension not on the graph ), if it breaks out the triangle.

ENJUSDBINANCE:ENJUSD broke down out of a triangle formation and is currently bearish.
What to watch for:
Buy if ENJ touches the Buy Zone at the $.84 or $.72 support zones OR multiple buy signals
As we move bullish again; Sell if multiple sell signals OR begin laddering sells at $2.00 resistance zone

ENJ showing signs of a UptrendYou see we have broken through the top of the bearish trend now in a retest, also if you take a look at the RSI it indicated we are showing bullish momentum.
We very well may see a large pullback into the bearish trend.
