$ENJ 4H ChartReclaim the 200EMA and break the key level marked on the 4H chart and I will be a buyer. Rumours of a big $ENJ partnership going around currently.
ENJ

ENJ/USDT 4h simple analysis in 15th/JunHi, crypto traders.
ENJ is in a sideways market.
The price continued to go up and already broke all MA lines to the upper side. However, it didn't break the last highest price: 1.58USD yet.
Since MA lines are very close, it's difficult to predict the next move. But if the price breaks 1.58USD, the trend will be an uptrend. Conversely, if the price breaks all MA lines to the lower side, the trend will be a downtrend again.
We can wait and see the next trading timing today.
==TODAY’s Check Points==
- The candle continues to go up and breaks 1.58USD?
- The candle goes down and reaches 1.15USD again?
==TODAY’s Target Price==
ENJ goes up:
1st target: 1.58USD (the last highest price)
2nd target: 1.75USD (the highest price in 30th/May)
3rd target: 2.06USD (the highest price in 27th/May)
ENJ goes down:
1st target: Cross-point with 80h line and 240h line
2nd target: 1.15USD (the last lowest price)
3rd target: 1.00USD (A nice round number)
Enjoy your trading.
=================================
#Efinity Token Sale
coinlist.co
Registration Opens: 2nd/Jun/2021
Registration Deadline : 18th/Jun/2021 00:00, UTC
Sale Period Begins: 24th/Jun/2021, 17:00 UTC
#Event schedule
xxx/2021: NFT.io launch (nft.io)
xxx: Efinity launch
#Latest Enjin blog/news (in 9th/Jun)
Enjin Partners with Health Hero to Launch NFT-powered Wellness Program
enjin.io


ENJ/USDT 4h simple analysis in 12th/JunHi, crypto traders.
ENJ is in a sideways market.
Once the price suddenly jumped up and broke all MA lines to the upper side. But after that, the candle changed negatively and broke all MA lines to the lower side, then reached close to my 1st target: 1.15USD.
After that, the candle went up, then already broke 20h (red) line to the upper side again, but if the candle changes negatively and breaks 20h (red) line to the lower side, the trend will be a downtrend. And this is a short entry point.
= =TODAY’s Check Points==
- The candle continues to go up and breaks 80h (blue) line to the upper side?
- The candle goes down and reaches 1.15USD again?
==TODAY’s Target Price==
ENJ goes up:
1st target: Cross-point with 80h (blue) line
2nd target: Cross-point with 240h (green) line
3rd target: 1.75USD (the last highest price)
ENJ goes down:
1st target: 1.15USD (the last lowest price)
2nd target: 1.00USD (A nice round number)
3rd target: 0.735USD (the lowest price in 23rd/May)
Enjoy your trading.
=================================
#Efinity Token Sale
coinlist.co
Registration Opens: 2nd/Jun/2021
Registration Deadline : 18th/Jun/2021 00:00, UTC
Sale Period Begins: 24th/Jun/2021, 17:00 UTC
#Event schedule
xxx/2021: NFT.io launch (nft.io)
xxx: Efinity launch
#Latest Enjin blog/news (in 9th/Jun)
Enjin Partners with Health Hero to Launch NFT-powered Wellness Program
enjin.io

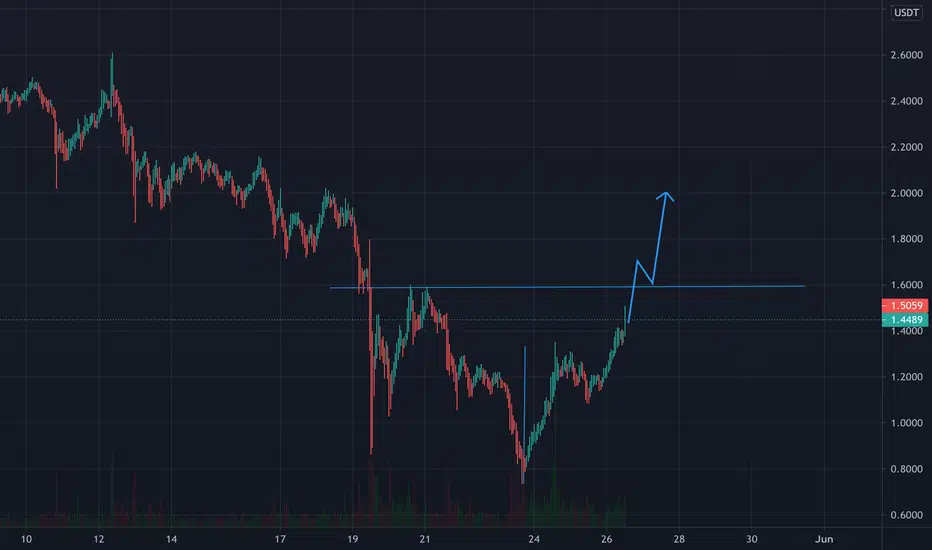
a possible move in the short term A possible move in the short term for ENJ what do you think guys
* this is not a financial advice it is for discussion purposes

ENJIN- Breakout in the makingOur updated ENJIN chart with key technical analysis points.
Price has just exploded upwards, outside the wedge, so if you get on it mind the support level and do your math right.
PS. We had been posting about ENJIN in early stages, took profits perfectly and now it's time to start monitoring it daily again.
the FXPROFESSOR

ENJ/USDT : Minority Venture Capital (MVC)Shown in white line is our entry price for this crypto asset. Please add to this TA and keep discussing about take profit and and buy targets

ENJ/USDT 4h simple analysis in 10th/JunHi, crypto traders.
ENJ is in a downtrend now.
After reaching 1.15USD, the candle changed positively and started to go up. However, it bounced from 80h (blue) line and started to go down again.
Because the sequential order is 240h (green) line > 80h (blue) line > 20h (red) line > the candle, the trend is a downtrend. But MA lines and the candle are close, the trend can change easily.
If the price keeps under 20h (red) line, a downtrend continues. Conversely, if the price goes up and broke 240h (green) line to the upper side, the trend changes to an uptrend.
We should wait and see the next trading timing today.
==TODAY’s Check Points==
- The candle changes positively and breaks 240h (green) line to the upper side?
- The candle continues to go down and reaches 1.15USD again?
==TODAY’s Target Price==
ENJ goes up:
1st target: Cross-point with 240h (green) line
2nd target: 1.75USD (the last highest price)
3rd target: 2.06USD (the highest price in 27th/May)
ENJ goes down:
1st target: 1.15USD (the last lowest price)
2nd target: 1.00USD (A nice round number)
3rd target: 0.735USD (the lowest price in 23rd/May)
Enjoy your trading.
=================================
#Event schedule
xxx/2021: NFT.io launch (nft.io)
xxx: Efinity launch
#Latest Enjin blog/news (in 9th/Jun)
Enjin Partners with Health Hero to Launch NFT-powered Wellness Program
enjin.io


ENJ/USDT 4h simple analysis in 8th/JunHi, crypto traders.
ENJ is in a Strong Downtrend now.
As I predicted yesterday, the price started to move with a big impact. The price went down and broke 20h (red) line to the lower side. Because the sequential order is 240h (green) line > 80h (blue) line > 20h (red) line > the candle, the trend is a Strong Downtrend.
The candle already reached my 1st target: 1.23USD and broke it. If the price keeps under 20h (red) line, this downtrend continues.
We shouldn't buy ENJ in this market.
==TODAY’s Check Points==
- The candle changes positively and breaks 20h (red) line to the upper side?
- The candle continues to go down and reaches 1.00USD?
==TODAY’s Target Price==
ENJ goes up:
1st target: Cross-point with 20h (red) line
2nd target: Cross-point with 80h (blue) line
3rd target: Cross-point with 240h (green) line
ENJ goes down:
1st target: 1.00USD (A nice round number)
2nd target: 0.735USD (the lowest price in 23rd/May)
3rd target: 0.475USD (the lowest price in 28th/Feb)
Enjoy your trading.
=================================
#Event schedule
xxx/2021: NFT.io launch (nft.io)
xxx: Efinity launch
#Latest Enjin blog/news (in 7th/Jun)
Utilify: Connecting the NFT Multiverse
enjin.io

ENJ/USDT 4h simple analysis in 7th/JunHi, crypto traders.
ENJ is in a sideways market.
The price is stable and MA lines are very close now. Normally, if MA lines are close, the next move has a big impact. But it's difficult to predict the price goes up or down.
We should wait and see the next trading timing today.
==TODAY’s Check Points==
- The candle goes up and reaches 1.75USD?
- The candle goes down and reaches 1.23USD?
==TODAY’s Target Price==
ENJ goes up:
1st target: 1.75USD (the last highest price)
2nd target: 2.06USD (the highest price in 27th/May)
3rd target: 2.61USD (the highest price in 12th/May)
ENJ goes down:
1st target: 1.23USD (the last lowest price)
2nd target: 1.00USD (A nice round number)
3rd target: 0.735USD (the lowest price in 23rd/May)
Enjoy your trading.
=================================
#Event schedule
xxx/2021: NFT.io launch (nft.io)
xxx: Efinity launch
#Latest Enjin blog/news (in 7th/Jun)
Utilify: Connecting the NFT Multiverse
enjin.io

ENJUSDTHello to you all. Mars Signals team wishes you high profits at all times.
Prices are fluctuating inside the triangle. We have to wait and wait for it to come out from every side. Then we enter into a deal
Warning: This is just a suggestion to you and we do not guarantee profits.
Wish you luck!

ENJIN - what does it tell us 📊This is just a chart for my friend who asked what i see when i look at ENJ
So this is NOT a buy/sell - but more where do i see the course and where do i think it will go to
So remember to do your own reseach befor entering a trade 🙏

ENJ/BTC Penant pattern enj making a Penant pattern and btc.d is low also Total2 is up and btc is bullish in the moment so I'm very bullish on this right now .


ENJ 1H BUYAlso set some Buy orders near the Trendline
Remember no more than 5% of the deposit in one trade
SL: next sell signal

Enjin? No upward movement!ENJ is within wave B of wave Y.
Due to current correction pattern, I think it's a kind of triangle patterns.
If it is as I said, it would be a timing correction.
Therefore there is no specific upward movement because of the correction pattern completion.

Short - ENJ/USDTPShort
Reasoning,
Retest at resistance level confluence with supply zone (Gray box) and trendline,
Stoch RSI indicates overbought,
Take a risk 1% max...
Targets / invalidation point in the chart

ENJ BUY/LONG INCOMING! 1.20 to POTENTIALLY 7.00! Company Name: Enjin
Industry: CrytoCurrency | Blockchain
Technical Analysis
1. Large Flag / Pennant (Forming)
2. Fibonacci Retracement at 0.785 (Silver Zone)
3. Fibonacci Expansion Safe Take Profit Level 1 (Grey Zone) Also the length of Flagpole
Entry: NOT READY
Entry Price: 1.20-1.25
1st SAFE Partial Take Profit: 4.7500
2nd Partial Take Profit: 7.0000
EXPECTED Take Profit in June-August 2021

ENJ Bull Flag Formed, Time for another leg up?Based on the depth of the chart and the forming patterns, a move up for ENJ could be possible today. Trade at your own risk and this is not financial advice.

I wanna buy more ENJ! ENJBTCENJ has blown up but does it have more? YES.
It looks incredible on the BTC chart with a head and shoulders formation completed, up is next
Decided to draw a house because that's my goal from investing in crypto.
