Enjbtclong

ENJ BTC - Ready for the inversion of the trend?ENJ BTC - Ready for the inversion of the trend?
ADX - Going in +20 and +D1 near to cross the line.
MACD - near to crossed
STOCH RSI - over 80.00.
Last red candle don't breaking the lower bollinger band.
Maybe that the inversion in this 45minutes frame.

ENJ bottomed out, low risk buy zone entry over hereShorts are trapped, price is finding support at previous swing low level of 1811 sats.
- Classic bottoming out pattern
- Entry zone: 1811 sats
- Stop loss: 1751 sats
- Target 1: 2044 sats
- Target 2: 2178 sats
- Target 3: 2442 sats
Good luck traders!!


ENJ/BTC Short,Mid,Long term StrategyBuy : 2106 - 1924
Sell for Short term :
2329, 2465
Stop Loss : -5%
Sell for Mid term :
2511, 2734
Stop Loss : -10%
Sell for Long term :
3698, 4529, 5089
Stop Loss : -15%
Disclaimer: This is not an investment/financial advice, Trade at your own risk. Always do your own research.


ENJ LONG- Entry : none
- Target : 4595
- Stop loss : 492
- Risk/reward ratio : 1.9 (if entry @ 1909)

ENJ super AltcoinIf you're looking for what's hot in crypto, this coin is the one...
Price action is suggesting that resistances are being broken (yellow zone), and supports are being respected (green zone)
Now all we gotta do is enter on retest of resistance as support and target all the way to range high
- Partial profit taking at mid range level

ENJ bounced from supportLook for a rally to unfold, ENJ bounced from green support region, targeting 4000 and 5100 region for this long
Buy on retrace to old daily high marked in the chart


Enjin Repeating Fractal - another 100% ? After a month of ENJ going nearly 10x from its bottom in late February, it has had the chance to consolidate to the 50% fib retracement zone. Which in doing so, it has created drastic similarities to the consolidation wave after its first leg up.
Therefore it seems it could be repeating the same pattern once again, only this time on a larger scale.
Looking at the chart, we are currently in the center of a key support zone. This support zone was created using replicated fib levels from the prior wave. Meaning that if this level holds, there is a very solid chance ENJ will bounce to the Target 1 resistance zone, consolidate and then make its way to the second target.
I wish you all the best of luck this alt season!
Cheers!
Notes:
The current support zone MUST hold for the fractal to hold true
Generally alts follow Bitcoin, and BTC is currently riding thin support.


Enjin - Big Things to ComeEnjin has had a phenomenal run over the past few days due to some major events for the project. Fundamentally speaking, ENJ still has a lot to deliver in the near future and could leave room for another pump. First of all, what started the initial take off, we have the Samsung partnership with the new S10 hardware wallet utilizing ENJ's network. This can be huge when the phone comes out, especially with ENJ's focus on mobile application development. This can hit the mobile market in the near future with Samsung's newest phone. The phone has the ability to operate with unity games, which brings up another event. Additionally on March 14, in 10 days, which is the release of the Blockchain SDK on Unity's store (twitter.com). Hundreds, if not thousands, of game developers have been awaiting this release in order to easily integrate ENJ into their games. This can bring a very easy adoption of cryptocurrency to your average smart phone user. Aside from the events coming up, there is a clear bull pennant on ENJ/BTC (as well as the other pairings). Based on this formation, I will be setting the following:
Entry 1: 2,100 sats
Entry 2: 2,040 sats
Stop Loss: 1,970 sats
I'm not setting specific targets, I will take profit when I see some decent gains.


PUMP Probability!!!Hi Dears,
Very ready for the PUMP!!!
But remember that nothing in this world is 100%
Good Luck


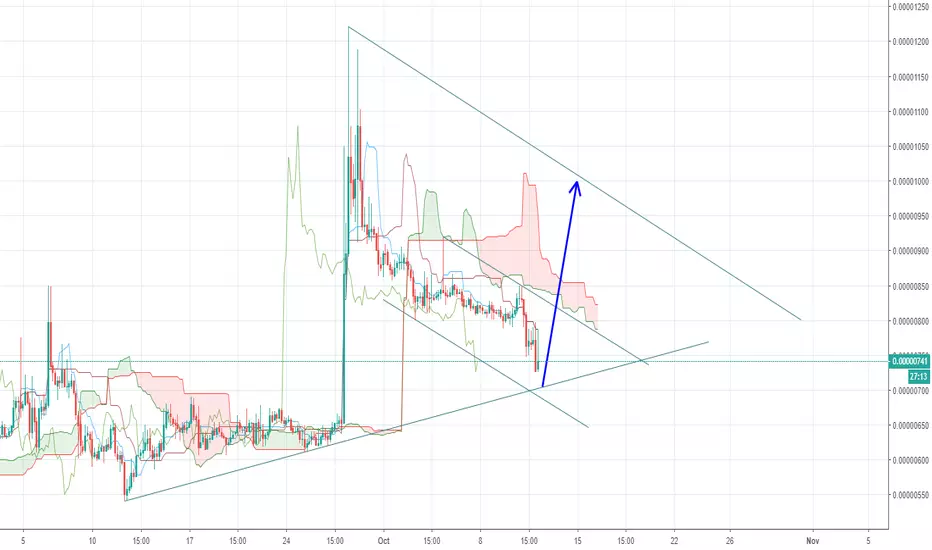
Daily Bullish Signal #ENJ #ENJBTC (12-10)#ENJ (ENJ/BTC)
Buy : 700-740
Flash Sell : 780
Short Sell : 820
Long Sell : 850-900-950-1000
Stop : 650
Follow me for more signals daily
Daily Bullish Signal #ENJ #ENJBTC (14-09)#ENJ (ENJ/BTC)
Buy : 590-600
Flash Sell : 640
Short Sell : 690
Long Sell : 745-800
Stop : 580
Follow me for more signals daily
PM me if you need help or learn how to trade like a pro

Calm before the StormHello all!
We could see a 50-75% gainer here with Enjiin Coin. As a precursor and observation, this coin has showed continual resilience while Bitcoin has been downtrending of recent showcasing its current strength/support. There are a number of positive TA indicators here especially on the high time frames. For example:
* Walking through 3/1 Gann with steady and upward movement
* Long term support from long term fib line at 1555 Sat
* RSI is on continual long term uptrend
* Target the Squeeze!!!
If we want to predict the future even more, we could see a cup and handle develop after this initial 50% run to create a potential second top. Keep your eyes peeled because we could have a great trade opp on our hands.
Happy Trading and as always this is just an idea so please trade at your own risk.
Follow for updates!!!

ENJ 4h right now short move, after that long again.The fib resistance fan go respected really well on ENJ. So right now we are hitting resistance and will most likely see a small retracement. Either to the formed channel (support yellow) or actually to the 0.61 fibs. From there we should see movement up, here again the classic resistance lines are the ones to watch out for and the fibs too. Looking at RSI we can overlay the projected movement and see a higher chance of it moving that way as well.
Short term - short.
Mid term - long.

ENJ/BTC Trade Opportunity!We have some criterias to meet in ENJ/BTC chart! If it breaks through resistance trendline then wait pullback to retouch this and go then, this is for to get a better entry!
Good luck!
Trade cautiously!

ENJ/BTC Wavecount/PredictionsHere's my take on Enjin. Short on the short-term, long on the long-term on this one. Let me know if you think somethings wrong.

Enjin ENJ Forecast - Undervalued and Discounted!ENJ chart is pretty well explained.
Expect immediate growth.
Don't miss the train!
This is not an investment advise, always do your own research.
