Enjbtc breakout The price is testing the daily resistance after a breakout from descending channel . Now if the price passes the resistance level it will be a nice long order from there
Enjincoin

ARE YOU READY FOR 55K+ ?ARE YOU READY FOR 55K+?
@ down trend are the best tool for whales to pump the trend, every good increase made from down trend.

Enjin Coin (ENJ) - April 29Hello?
Dear traders, nice to meet you.
By "following" you can always get new information quickly.
Please also click "Like".
Have a good day.
-------------------------------------
(ENJUSD 1D chart)
We need to see if we can get support at 2.67570597 and get off the downtrend line.
If it goes down, you need to make sure you get support at 2.45973917.
If it falls in the 1.79815147-2.01754009 section, a Stop Loss is required to preserve profit and loss.
-------------------------------------
(ENJBTC 1W chart)
(1D chart)
We have to see if we can get support and ascend at the 4811 Satoshi branch.
If it falls, it remains to be seen if it gains support at the 4484 Satoshi spot.
3344 Satoshi-3711 If you fall in the Satoshi section, you need Stop Loss to preserve profit and loss.
--------------------------------------
It is advisable to trade at your average unit price.
This is because if the price flows below your average unit price, which was on an uptrend or downtrend, there is a high possibility that you will not be able to earn a large profit due to the psychological burden.
The center of every trade starts with the average unit price you start trading.
If you ignore this, you may be trading in the wrong direction.
Therefore, it is important to find a way to lower the average unit price and adjust the proportion of the investment, so that the money that ultimately corresponds to the profit can regenerate the profit.
-------------------------------------------------- -------------------------------------------
** All indicators are lagging indicators.
So, it's important to be aware that the indicator moves accordingly with the movement of price and volume.
Just for the sake of convenience, we are talking upside down for interpretation of the indicators.
** The wRSI_SR indicator is an indicator created by adding settings and options from the existing Stochastic RSI indicator.
Therefore, the interpretation is the same as the conventional stochastic RSI indicator. (K, D line -> R, S line)
** The OBV indicator was re-created by applying a formula to the DepthHouse Trading indicator, an indicator that oh92 disclosed. (Thank you for this.)
** Check support, resistance, and abbreviation points.
** Support or resistance is based on the closing price of the 1D chart.
** All explanations are for reference only and do not guarantee profit or loss on investment.
Explanation of abbreviations displayed on the chart
R: A point or section of resistance that requires a response to preserve profits
S-L: Stop Loss point or section
S: A point or segment that can be bought for profit generation as a support point or segment
(Short-term Stop Loss can be said to be a point where profits and losses can be preserved or additionally entered through installment transactions. It is a short-term investment perspective.)
GAP refers to the difference in prices that occurred when the stock market, CME, and BAKKT exchanges were closed because they do not trade 24 hours a day.
G1: Closing price when closed
G2: Cigar at the time of opening
(Example) Gap (G1-G2)

ENJ Bullish BREAKOUTNFT dominance broke out, now its time for enj to rally up. Do you agree? Will you be investing

ENJUSDT Breakout Confirmed!ENJUSDT (4H CHART) Technical Analysis Update
Trendline Breakout
ENJ/USDT currently trading at $2.50
Buy-level: $2.40 - $2.50
Stop loss: Below $2.15
Target 1: $2.75
Target 2: $3.00
Target 3: $3.25
Target 4: $3.50
Max Leverage: 2X
ALWAYS KEEP STOP LOSS...
Follow Our Tradingview Account for More Technical Analysis Updates, | Like, Share and Comment Your thoughts.

Constructive Price ActionPrice action has improved in the past 24h. My outlook is still neutral in the short term as long as it remains between 2 support and 2.5 the next immediate resistance. This could be seen as an area of accumulation. At the moment the dips below 2 look like bear traps. Watch BTC for guidance. BTC down to 42/40 is the max expected into pullbacks. At the moment it does not look like it will happen, which is positive for ENJ. I am staying long and will try to add to long in the low 2s if that ever happen or on a break above 2.50. Good luck all.

ENJUSDT 4H - WatchlistHey There, I wish you have a good mood and profitable trades!
At a price of less than 1.9840 Tether I expect a bearish movement to the price 1.7140 Tether (lower prices may also occur).
Notice it's just a prediction and It's up to you to have a good risk management as well as good strategy!

ENJIN- Time to push Higher?Our favorite and most succesfull trade on the First quarter of the year and soon we hope to see in the TOP-10
Technically this looks like a great time to buy in again today

Great project with great potentialBeen in since November 25th, 2020. It is holding quite well.
For self-learning purposes only, DYOR.

Waiting for Stronger SignalHi traders,
Quick update. 3 and 2.7/2.8 support levels didn’t hold during Sunday’s crash in the crypto space. Next supports are 2.5 and 2.35ish, which used to be previous resistance levels. Ideally we’d want to see a break above the 2.50 again or even 2.8 on the daily chart to become bullish. I am not bearish and i think this is just part of the consolidation before we run towards new highs. Correlation with the stock market has increased so keep that in mind too. if you have no position on, 2.35 seems to be a good initial entry level with a first target 2.5, then 2.75/2.8 before 3.
I am rating the current price action as neutral until we see ENJ above 2.5 again.
I hope this analysis help.

ENJIN COIN BACK TO the TOPEnjin coin after 61.8% fib retracement from ATH , made a major pivot an retest the support line. I am waiting for a bullish candle for TRUE breaking the resistance line.
targets are clear in the chart.

ENJIN - Our Rocket is going for TOP-10Since our very first post on ENJIN (idea is posted below) we have watched this Rocket break the 50cents, 75 cents, 1 $, 1.50$, 2$, 3$ and 4$ mark. A huge success, indeed.
Well, maybe it is time for 5$ and for ENJIN to make it to the Top-10 cryptos sometime this year.
Fundamentals are great, we are buying some more today.
ps. Thanks to Evangelos Cryptomachos for introducing us to this baby.

ENJIN, ENJUST - ready for another leg up ?Hello,
ENJIN is more than 2500% up since January 1 and as we can see on the daily chart, the general uptrend is intact as the price keep climbing in a well defined channel.
IF the general crypto market bull run is to continue and is extended in the coming weeks to months then we can see points 1 to 4 on our chart below repeat again thus causing another good run in ENJIN's price. Very good coin for long-term investment in my opinion
I think we can expect a further decline in price down to the demand zone (around $2.8) during the current pullback, most probably somewhere closer to the 21-day EMA on daily.
On the lower timeframes, 4-hour chart to be more precise, it is clear we are in a bull flag formation. This means we can expect the coin to bottom pretty soon given the fact is is already halfway through the pole. The target zone is based on the pole length


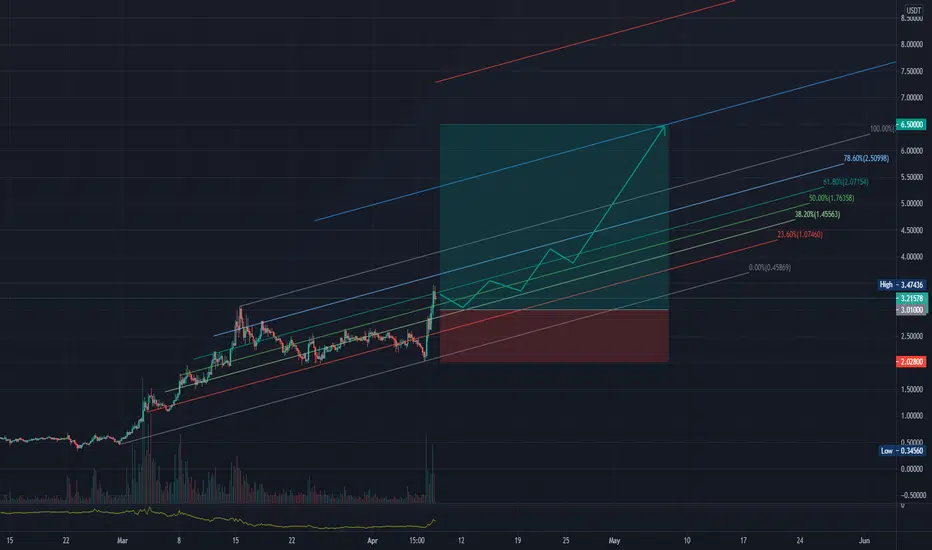
ENJUSDT LongENJUSDT Long; Based on the bull flag and Fibonacci extension levels. Depending on if the penetration happens, I showed the target levels.

Ascending Bullish triangle Enjin community on the launch of Jump Net! that means you could throw your favorite streamer a powerful @Enjin sword right when they need it in battle, then throw them $ENJ when they win.
With high volume breaking 3.03$ reversing from 3.68 61% Expansion and it will target 6.45$ but 2.85 should hold within the daily candle.

🎯Buying opportunity in ENJUSDT🚀Entry: 3.11 to 3.22
Stop Loss: 2.79
Target #1: 3.54
Target #2: 3.75
Target #3: 3.99
❗️Conduct your own due diligence.
❗️I am not a licensed qualified investment advisor. I am an amateur investor. All the ideas, & opinions are for informational, and educational purposes only.
❗️While the information provided is believed to be accurate, it may include errors or inaccuracies.


$ENJ LISTED ON COINBASE TODAY!! dont miss opportunity!$ENJ has been listed on COINBASE today about 30 mins. ago.
Don't miss this opportunity.

ENJIN - 30 Times Higher since post 1ENJIN has reached yet another target at 3,4$
This has been by FAR the best investment we did this year and allow us to be happy.. very happy
This is an Engine that makes money. Read the fundamentals and news on our previous posts.

ENJ on the move upENJIN separated it movements from BTC and is moving up setting up a nice growth channel upwards now.
