Will #ENJ Soar Further or a Trap is Set Ahead? Watch Closely Yello, Paradisers! Is this breakout on #ENJUSDT the start of a strong bullish reversal, or just another trap before a brutal flush to shake out late buyers? Let’s break it down:
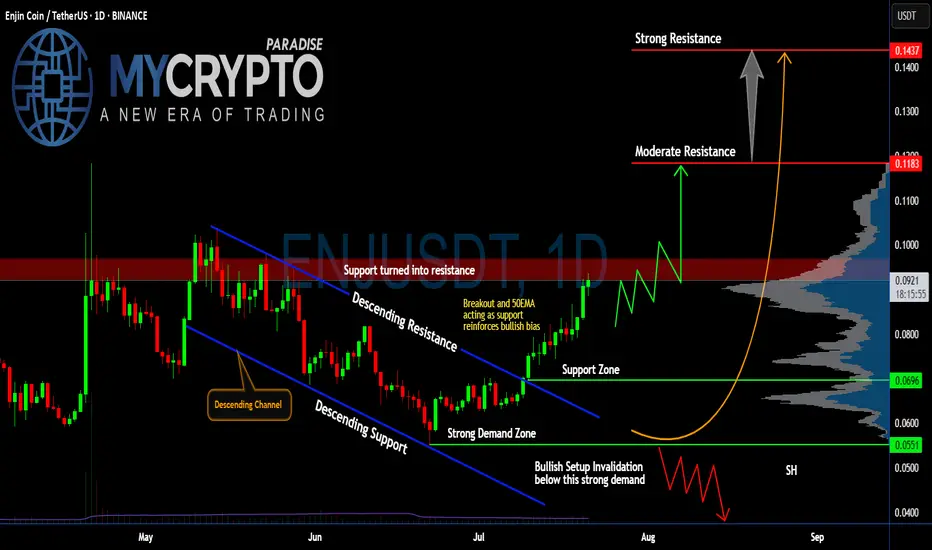
💎After weeks of bleeding inside a clear descending channel, #EnjinCoin has finally broken out of the descending resistance, showing the first real bullish momentum in a while. Price is currently trading around $0.0917, with the 50EMA now acting as fresh support—this adds weight to the bullish bias for #ENJ.
💎If bulls can break above the resistance zone (previously support) between $0.091 and $0.096, we could see a push toward the moderate resistance at $0.1183. That’s the first major hurdle where sellers are expected to step in. A clean breakout above this level would open the door for a larger move toward the strong resistance at $0.1437, where a heavy supply zone sits, and profit-taking will likely accelerate.
💎The strong demand zone between $0.0551 and $0.0696 has been respected multiple times in the past, with aggressive buying every time price dipped into it. This is classic accumulation behavior, which often precedes stronger impulsive legs up—if volume keeps supporting this move.
💎But don’t get trapped, Paradisers. If the price breaks back below $0.0696 and especially loses the strong demand at $0.0551, the bullish setup for #ENJUSD will be invalidated. That would likely trigger a deeper correction, pushing us back toward $0.04. We’ll wait patiently for the next high-probability setup before taking any new positions.
Stay patient, Paradisers. Let the breakout confirm, and only then do we strike with conviction.
MyCryptoParadise
iFeel the success🌴
ENJUSDT
Enjin Coin Ready for a Truly Major Advance · PP: 941%Technical analysis is truly an exact perfect science, when mastered. If you master this tool you can use it successfully to make very strong and accurate predictions.
If you can make one prediction right, then the tool works.
If you can make several correct predictions, then the tool being valid is confirmed.
If some predictions fail, we have to assume our interpretation is wrong rather than the tool. If the tool is the one at fault, then all predictions would be either wrong or random. And since we can make thousands of highly accurate predictions, it means the tool works.
Back in late 2024 ENJUSDT was rejected twice at EMA89 resistance. As soon as it broke above this level it produced a strong advance. This wasn't enough and the market moved lower. As it reached a major low point in April and June 2025, the same conditions showed up.
ENJUSDT was rejected twice below EMA89 as resistance, notice the red arrows on the chart. Currently, Enjin Coin managed to conquer EMA89 and this is bullish. Looking at past history and knowing what we know about EMAs, this means that the doors are open for a strong bullish wave.
Enjin is set to produce a major advance and this is already confirmed. Just like late 2024 but much stronger, prices will go much higher because we are in the year of the bull market, post Bitcoin halving, every four years. Marketwide growth is happening and will only increase. This pattern has never been broken, it is already happening, it is confirmed and guaranteed.
Namaste.

ENJUSDT 1W AnalysisENJ ~ 1W Analysis
#ENJ Buy back gradually from this support block with a short-term target of at least 20%++.
0.0020!I believe ENJ will exit the market after a significant fall, so it's not a good time for long positions.

ENJUSDT 1D AnalysisENJ ~ 1D Analysis
#ENJ Buy after successfully breaking through this resistance line with a short-term target of at least 10%+.

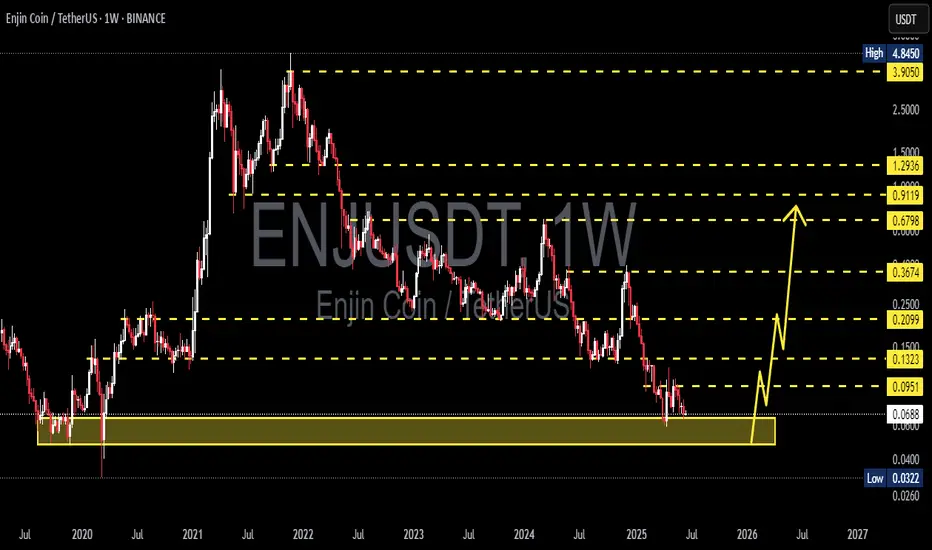
Enjin Coin Grew 14,946% (150X) Between March 2020 & Nov. 2021Here it is important to start with the linear chart to be able to appreciate the fact that Enjin Coin is trading at bottom prices. You know the log. scale distorts it a little bit but this one can really show that ENJUSDT has been trading at the bottom for a long, long time. And you know what I love to say; once we hit bottom, there is no other place left to go but up.
ENJUSDT Long-Term Weekly Linear Chart:
Knowing that the action is happening at bottom levels immediately reveals what will happen next. And knowing what this is, we can prepare.
Now let's focus on the log. chart to be able to spot the highs and lows and do the analysis. That's the main chart above.
There was already one break of strong support which is the November/December 2020 low.
The five years strong low last month (April 2025) activated levels from late 2019 and March 2020 but still a long-term higher low.
The action is happening now within a very strong long-term accumulation and buy zone; buying here, you can't go wrong.
This is the place where the whales and very smart money buy their Altcoins. This is the best possible time and entry price to load up on Enjin Coin if you were someone that is looking at these charts to make money from the upcoming bull market rise.
If you've been waiting, the wait is over.
Oh, and by the way, Enjin Coin grew an astonishing 14,946% between March 2020 and November 2021, that's more than 150X.
Who said the Cryptocurrency market isn't wild?
Prepare for massive growth.
Namaste.

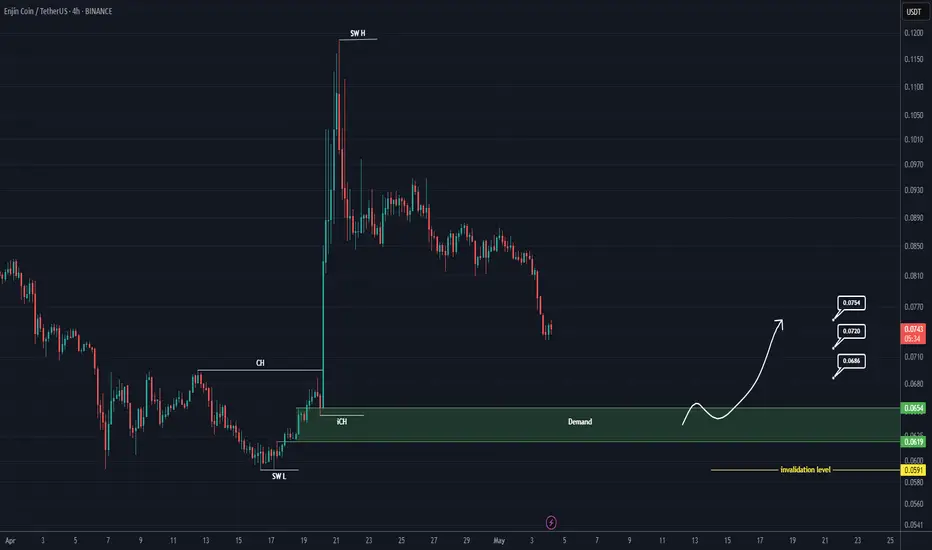
ENJ Buy/Long Setup (8H)After a bullish move and the formation of a strong change of character (CH), followed by a FOMO-driven ENJ rally, the price is now approaching support zones. In areas where strong buyers were previously active, we can look for a buy/long position.
The origin of this move is expected to hold, and price is likely to move toward higher zones.
We are looking for a buy/long position around the demand zone.
Targets are marked on the chart.
A daily candle close below the invalidation level will invalidate this analysis.
For risk management, please don't forget stop loss and capital management
When we reach the first target, save some profit and then change the stop to entry
Comment if you have any questions
Thank You
ENJ Spike 63% Gearing For 300% Surge Amidst Bullish Flag PatternThe price of Enjin coin ( NYSE:ENJ ) broke out of a bullish flag pattern surging 63% for the past 24 hours. With growing momentum, the asset is gearing for a 300% breakout.
One key factor contributing to the surge is the launch of the Enjin NFT SDK, which enables seamless integration of non-fungible tokens (NFTs) into various platforms, paving way for NFT's on the ENJ ecosystem.
As of the time of writing, NYSE:ENJ is up 19% setting the course for a 300% breakout. The asset has formed a perfect bullish flag pattern with the ceiling of the pattern already broken, NYSE:ENJ will be aiming for the $0.32 resistant and beyond.
With growing momentum as hinted by the RSI at 71.89, NYSE:ENJ might just be the asset to look out for this week.
What is Enjin ( NYSE:ENJ )
Enjin is a blockchain platform that makes it easy for developers to integrate NFTs and digital assets into their games and apps.
The platform provides tools for creating wallets, minting tokens, and managing transactions without requiring users to understand complex blockchain technology.

ENJUSDT | One of Today’s Top Volume Gainers – +197.5% in 24hENJUSDT has attracted serious attention today, with trading volume jumping nearly twofold over the last 24 hours. That kind of activity usually signals big players are involved, so it’s worth watching closely—even though the price itself isn’t showing strength right now.
🔴 Price Still Weak Against Key Levels
The red boxes on the chart mark important resistance zones where ENJ has repeatedly stalled.
Each test of these areas has been met by sellers, and until price can close convincingly above them, bulls remain on the back foot.
📊 How to Trade This Setup
Short Entries
Wait for ENJ to rally into a red box, then look for lower‑time‑frame downturns with CDV confirmation.
A clear breakdown inside those zones gives a high‑probability short signal.
Long Entries
If ENJ breaks above a red box with strong volume, watch for a retest of that level as support.
Only after a successful retest and confirming bounce on lower time frames will I consider longs.
🤝 Why This Matters
I focus on the coins that lead the market in volume, because that’s where the real opportunities lie. These resistance zones aren’t random—they reflect genuine supply and demand dynamics. If you’ve been following my updates, you know my win rate is among the highest around. That’s because I never chase trades; I wait for clear, confirmed setups.
I will not insist on my short idea. If these levels suddenly break upwards and do not give a downward break on the low time frame, I will not evaluate it. If they break upwards with volume and give a retest, I will look long.
Stay patient, trade with confirmation, and let the market show you the way.
📌I keep my charts clean and simple because I believe clarity leads to better decisions.
📌My approach is built on years of experience and a solid track record. I don’t claim to know it all but I’m confident in my ability to spot high-probability setups.
📌If you would like to learn how to use the heatmap, cumulative volume delta and volume footprint techniques that I use below to determine very accurate demand regions, you can send me a private message. I help anyone who wants it completely free of charge.
🔑I have a long list of my proven technique below:
🎯 ZENUSDT.P: Patience & Profitability | %230 Reaction from the Sniper Entry
🐶 DOGEUSDT.P: Next Move
🎨 RENDERUSDT.P: Opportunity of the Month
💎 ETHUSDT.P: Where to Retrace
🟢 BNBUSDT.P: Potential Surge
📊 BTC Dominance: Reaction Zone
🌊 WAVESUSDT.P: Demand Zone Potential
🟣 UNIUSDT.P: Long-Term Trade
🔵 XRPUSDT.P: Entry Zones
🔗 LINKUSDT.P: Follow The River
📈 BTCUSDT.P: Two Key Demand Zones
🟩 POLUSDT: Bullish Momentum
🌟 PENDLEUSDT.P: Where Opportunity Meets Precision
🔥 BTCUSDT.P: Liquidation of Highly Leveraged Longs
🌊 SOLUSDT.P: SOL's Dip - Your Opportunity
🐸 1000PEPEUSDT.P: Prime Bounce Zone Unlocked
🚀 ETHUSDT.P: Set to Explode - Don't Miss This Game Changer
🤖 IQUSDT: Smart Plan
⚡️ PONDUSDT: A Trade Not Taken Is Better Than a Losing One
💼 STMXUSDT: 2 Buying Areas
🐢 TURBOUSDT: Buy Zones and Buyer Presence
🌍 ICPUSDT.P: Massive Upside Potential | Check the Trade Update For Seeing Results
🟠 IDEXUSDT: Spot Buy Area | %26 Profit if You Trade with MSB
📌 USUALUSDT: Buyers Are Active + %70 Profit in Total
🌟 FORTHUSDT: Sniper Entry +%26 Reaction
🐳 QKCUSDT: Sniper Entry +%57 Reaction
📊 BTC.D: Retest of Key Area Highly Likely
📊 XNOUSDT %80 Reaction with a Simple Blue Box!
📊 BELUSDT Amazing %120 Reaction!
I stopped adding to the list because it's kinda tiring to add 5-10 charts in every move but you can check my profile and see that it goes on..

ENJUSDT 1WENJ ~ 1W Analysis
#ENJ Buy gradually from here if you still have a Conviction on this coin with a short -term target of at least 20%+.

ENJUSDT 1WENJ ~ 1W Analysis
#ENJ If you still have a Conviction on this coin. Maybe this support you can consider to start buying back with a short -term target of at least 20%+.

ENJ USDTENJ is currently trading within a Falling Wedge pattern, a bullish reversal setup. It’s holding at the yellow support zone between $0.1258 - $0.1258, a critical level for buyers.
If the price bounces from this zone could ignite a strong bullish wave pushing price to the falling wedge upper boundary and the resistance zone Blue at $0.2063 - $0.2365.

My game Plan for ENJUSDTCurrently we are bouncing of from fib 0.618-0.66 zone and upheld by Avwap March 2024 highs.
If we come down to take the lows “Monthly and VAL” Checking on reaction its would give us a good entry level for a swing trade up at least to POC than even to VAH zone.
I would prefer to entry this trade as a intraday trade with tight Stop loss turning in to Swing trade.
Lets see 😊

Enjin Coin (ENJ) Analysis & Long-Term Investment Outlook!Current Market Overview
Current Price: ~$0.15
24H Range: $0.1389 - $0.1515
Volume: 16.37M
All-Time High (ATH): $4.5 (achieved in 2021)
Recent Trend: Bearish correction but approaching a key accumulation zone
Technical Analysis
1. Discount Zone & Accumulation Opportunity
The chart shows that ENJ is trading near its discount zone, an area where institutional and long-term investors look to accumulate before a potential reversal. This zone is typically considered undervalued, offering a strategic entry point.
2. Price Structure & Smart Money Concepts
Break of Structure (BOS): Multiple BOS signals indicate a strong bearish trend, but price is nearing a potential support level.
Change of Character (ChOCH): Some ChOCH signals suggest that the downtrend may be weakening, hinting at possible accumulation.
Equilibrium & Premium Zones: The price is far below the equilibrium and premium zones, reinforcing that it is at a historical discount for accumulation.
3. Moving Averages & Watson Envelope
The Watson Envelope (blue and red bands) suggests that price is near the lower bound, indicating a mean reversion could soon occur, leading to a potential bounce.
Fundamental Analysis & Catalysts
1. Enjin’s Utility & Real-World Adoption
Enjin Coin powers a blockchain gaming and NFT ecosystem, allowing developers to integrate digital assets into games, metaverse platforms, and virtual economies. Its real-world use case makes it attractive for long-term adoption.
2. Binance Supporting Network Upgrade (Positive News)
Binance has backed an Enjin Coin network upgrade (September 2024), signaling continuous development and network improvements.
This upgrade improves Enjin’s scalability, security, and NFT ecosystem, strengthening its long-term utility.
Binance’s support ensures liquidity and investor confidence.
3. Coinbase Delisting (Negative Impact in 2024)
In June 2024, Coinbase delisted ENJ, causing a short-term decline in liquidity and investor sentiment.
However, delisting from a single exchange does not impact the coin’s fundamental value.
Investment Potential & Price Prediction
Short-Term: Possible consolidation in the $0.12 - $0.18 range before a breakout.
Medium-Term (6-12 months): If accumulation holds, ENJ could target $0.30 - $0.50, testing previous resistance levels.
Long-Term (2+ years): If Enjin’s adoption continues and the crypto market recovers, a return to $1 - $2 is feasible, with ATH of $4.5 as a long-term target.
Investor Takeaway
✅ Bullish Factors
✔️ Trading at a discount near historical accumulation zones
✔️ Binance supporting network upgrade (strong ecosystem development)
✔️ Real-world use case in gaming & NFT sector
✔️ Market sentiment could shift as crypto recovers
❌ Bearish Risks
⚠️ Still in a downtrend, needs confirmation of trend reversal
⚠️ Coinbase delisting may impact liquidity & exposure
Final Thoughts
Enjin Coin is currently at a key accumulation level that offers an attractive opportunity for long-term investors. With strong fundamentals, upcoming network improvements, and historical price performance, ENJ has the potential to reclaim higher levels, possibly targeting $1+ in the next cycle.
If you’re looking for a high-risk, high-reward opportunity, this could be a great entry point. However, investors should watch for trend confirmation before going all in. 🚀

ENJ Breakdown! Will It Crash to New Lows? The price of ENJ has been in a consistent downtrend, as indicated by the descending trendline, with lower highs and lower lows forming. Several key support and resistance zones are marked on the chart. Currently, the price is retesting the purple resistance zone at $0.1584–$0.1512 after a breakdown from this level. If the price continues to decline, it could test the yellow support zone at $0.1372–$0.1294. A successful reclaim of the descending trendline and a move above the purple zone could signal a potential reversal.

ENJUSDT 1WENJ ~ 1W Analysis
#ENJ re-testing this support, If you still have Conviction on this coin, buy from here with a target of at least 20%++

#ENJ (SPOT) entry ( 0.1500- 0.2150)T.(1.2000) SL(0.1476)BINANCE:ENJUSDT
#ENJ / USDT
Entry ( 0.1500- 0.2150)
SL 1D close below 0.1476
T1 0.4300
T2 0.6600
T3 1.0000
T4 1.2000
______________________________________________________________
Golden Advices.
********************
* collect the coin slowly in the entry range.
* Please calculate your losses before the entry.
* Do not enter any trade you find it not suitable for you.
* No FOMO - No Rush , it is a long journey.
Useful Tags.
****************
My total posts
www.tradingview.com
1Million Journey
www.tradingview.com
www.tradingview.com
**********************************************************************************************
#Manta #OMNI #DYM #AI #IO #XAI #ACE #NFP #RAD #WLD #ORDI #BLUR #SUI #VOXEL #AEVO #VITE #APE #RDNT #FLUX #NMR #VANRY #TRB #HBAR #DGB #XEC #ERN #ALT #IO #ACA #HIVE #ASTR #ARDR #PIXEL #LTO #AERGO #SCRT #ATA #HOOK #FLOW #KSM #HFT #MINA #DATA #SC #JOE #RDNT #IQ #CFX #BICO #CTSI #KMD #FXS #DEGO #FORTH #AST #PORTAL #CYBER #RIF #ENJ #ZIL #APT #GALA #STEEM #ONE #LINK #NTRN #COTI #RENDER #ICX #IMX #ALICE #PYR #PORTAL #GRT #GMT #IDEX #NEAR #ICP #ETH #QTUM #VET #QNT #API3 #BURGER #MOVR #SKL #BAND #ETHFI #SAND #IOTX #T #GTC #PDA #GMX #REZ #DUSK #BNX #SPELL #POWR #JOE #TIA #TFUEL #HOT #AVAX #WAXP #OGN #AXS #ENJ

ENJ planThis is my ENJ plan. I exptect us to stay in the orange box. If we go down it will be a deviation.

TradeCityPro | ENJUSDT Analysis Christmas Holiday👋 Welcome to TradeCityPro Channel!
Let’s analyze ENJ during the holiday season and identify triggers across different timeframes to make the most of market opportunities. Don't forget to check the Signature section at the end for updates! 😊
🌐 Overview Bitcoin
Before diving into ENJ analysis, let’s look at Bitcoin. It broke the 95445 short-term support and is expected to move toward the 92722 support, where it might form a new structure. Key support levels for Bitcoin are 91K, 86K, and 81K, which hold significant importance.
Additionally, Bitcoin dominance is also dropping, forming red candles during this decline. This means the market as a whole is correcting:
Coins bullish against BTC are correcting less, Coins bearish against BTC are showing more red candles than Bitcoin itself.
📊 Weekly Timeframe
ENJ hasn’t shown significant movement. After breaking its smaller box resistance, it entered the larger timeframe box, only to get rejected from the upper boundary and return to the entry point of its box.
The 0.3743 resistance has become increasingly important. Once broken, it could signal a buy opportunity, preparing for a potential break of 0.6920. However, ensure the breakout is accompanied by increasing green candle volume and confirmation through RSI surpassing 83.90.
If you are holding ENJ and looking to activate your stop loss to exit, it’s logical to sell after breaking 0.1256 and closing a weekly candle below it. Always take stop losses seriously and look for re-entry triggers later.
📈 Daily Timeframe
After hitting the 0.3838 daily resistance, ENJ has formed lower highs and lows, returning to the 0.2116 support zone, which is crucial.
This 0.2116 support holds significance due to Fibonacci alignment,Its position on the 50% level, indicating potential for a rebound if the trend weakens.
Alternatively, breaking this support could lead to lower lows, bringing ENJ back into its weekly box. In this case, it might retest the 0.1854 and 0.1520 support levels.
⏱ 4-Hour Timeframe
Market volume has significantly dropped, suggesting reduced trading activity during the holidays. This low 24-hour trading volume has led to irrational and unnecessary market fluctuations.
📈 Long Position Trigger
After breaking 0.2483, a long position can be opened, but given the low market volume, trades should be executed with reduced risk.
📉 Short Position Trigger
After breaking 0.2105, a short position can be considered. However, logical trading during these conditions involves small stop losses and focusing on risk-to-reward ratios while quickly taking profits.
💡 BTC Pair Insight
Currently, ENJ isn’t performing well against Bitcoin. After showing some signs of life by testing the 0.000000374 resistance, it got rejected and returned to its support level.
Keep in mind that breaking this resistance could finally bring ENJ some gains against Bitcoin, which would likely translate into USDT price increases during a bullish market.
📝 Final Thoughts
Stay calm, trade wisely, and let's capture the market's best opportunities!
This analysis reflects our opinions and is not financial advice.
Share your thoughts in the comments, and don’t forget to share this analysis with your friends! ❤️

ENJUSDT LONG TERM ACCUMULATIONENJUSDT ACCUMULATION
have been using ENJ services for years now as a wallet user, have been very satified with the services provided, hence its one of its working proiduct , i would bet on them for a bright future.
Previous Idea:

ENJ/USDT | Long-Term Technical Analysis on the Weekly TimeframeOverview:
ENJ is currently trading within a well-defined descending channel (yellow trendlines), reflecting a long-term downtrend since its all-time high. This channel offers key insights into historical price action and potential future movements. After touching the bottom boundary multiple times, ENJ is showing signs of momentum for a potential breakout.
Key Levels and Observations:
1. Descending Channel:
• Price remains within the channel, bouncing between resistance (top) and support (bottom).
• A breakout above the upper boundary would confirm a potential trend reversal.
2. Support and Resistance:
• Support Levels: $0.22 (bottom of the channel) and $0.12 (critical historical low).
• Resistance Levels: $0.34 (channel resistance) and $3.42 (major breakout target).
3. Volume Profile Analysis:
• Significant volume buildup within the $0.22–$0.34 range suggests strong liquidity in this area, acting as a base for the next move.
• A breakout could target higher-volume nodes at $1.30, $3.42, and beyond.
4. RSI Analysis:
• RSI is recovering from oversold territory, currently sitting at 38.69, signaling growing bullish momentum but still with room for upside.
5. Projection:
• A confirmed breakout above $0.34 targets $3.42, which aligns with historical resistance and key volume levels.
• If momentum continues, higher targets could be achieved in the long term.
Trade Setup (Potential Long Idea):
• Entry: Consider entering after a confirmed breakout above $0.34 with strong volume.
• Stop-Loss: Set below the recent swing low at $0.22 to limit downside risk.
• Take-Profit Levels:
• TP1: $1.30 (interim resistance).
• TP2: $3.42 (major breakout target).
• TP3: $4.79 (longer-term resistance).
Risk Factors:
• A failure to break the $0.34 resistance could lead to further consolidation within the channel.
• Watch for rejection at key levels and decreasing volume during attempted breakouts.
Conclusion:
ENJ presents an exciting long-term opportunity with its structured channel and volume profile suggesting accumulation. A breakout above the key $0.34 resistance could trigger a significant trend reversal, offering targets up to $3.42 and beyond. Keep an eye on volume and RSI for confirmation of bullish momentum.
What are your thoughts on this setup? Let’s discuss in the comments!

ENJUSDT 1WENJ Update ~ 1W
#ENJ At Time Frame 1W,. Once again it was rejected from this resistance line. If you still have Conviction on this coin,. You can start buying gradually at the current price. or if you want to play more safely,. You can buy on this support block..
these two scenarios with a minimum target of 20%+

Enjin Coin +1400% ProfitInflation Analysis:
Since nearly all tokens are already in circulation, the project has very low inflation, minimizing the risk of devaluation due to additional supply.
Price Prediction for the 2025 Bull Run:
Enjin Coin, as one of the leading projects in NFTs and blockchain gaming, has strong potential. With the growth of the metaverse and gaming-related projects, Enjin could secure a significant market share. In an optimistic scenario, ENJ's price could reach $3–$5.5 during the 2025 bull run.
🔗 Note: ENJ is a compelling option for investors interested in the NFT and metaverse ecosystems. 💎
