ENJUSDT

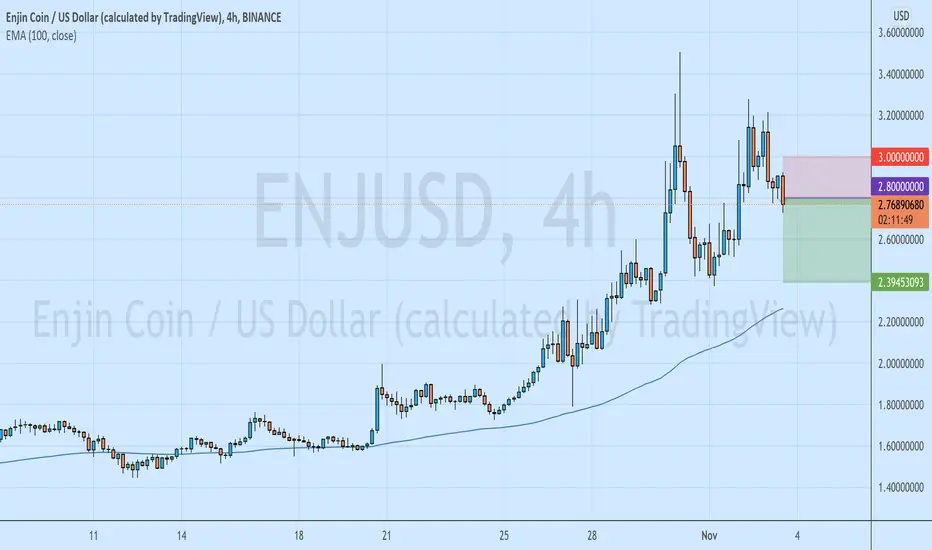
Enjin Coin ENJUSDT The Bearish Bat PatternENJUSDT has made the bearish bat pattern. we can expect the price to drop further support area is 2.3-----2.4. if it failed to hold that next major support is 1.17

Enjin(ENJ) sitting in a bullish triangle pattern Hello. According to my technical analysis, Enjin(ENJ) is ready to break its All Time High. We may see price go to 4$ , or maybe even 5$ in the next 2 weeks if we have a breakout.
In the 4 hour chart we can see a price triangle pattern, drawn with red and green dashed lines. Price is currently resting on this pattern. This is part of a healthy pullback, with falling volume and high volume on up candles.
Looking at the RSI, it also formed its own triangle pattern, in which it had a breakout already, unlike price where it is still consolidating. This is a bullish sign.
The 20, 50 and 100 MA still acts as support. If we want the breakout of the triangle to be a success, we will want these Moving Averages to hold.
Let's see how the price of ENJ goes. I will keep this post updated. Thank you for reading!

ENJ/USDTBuying ENJ here .
Targeting :
- $3.65
- $3.9
- $4.22
SL 4h close below $2.65
NOT FINANCIAL ADVICE.

Is ENJ about to pullback?I was checking different support/resistance levels and watching closely in low scales which says that now ENJ is under a threshold for a bump or dump!
Please dont follow this ideas, usually im sure but now we need a confirmation.

ENJ Trade Idea BTC just made a big move above 65000 and altcoins may follow soon. The price has been testing a channel on low timeframes and now it's in the bottom part of it. Probability of the price going up is about 65%. Trade carefully.

Potential Cup with handle ENJWe might have a potential CwH on Enj, zooming to 2h makes it bit more obvious and clear.
Fibs do the rest. Let's see how this one plays out in the next few days!
No financial adivce
First Target @ 4 Dollar (ATH) and rest at Fibs 1.618!
Good luck :)


ENJ LIMIT ORDERS! MASSIVE PROFITS POTENTIAL IF ORDERS HIT$ENJ is one of my favorite meta coin and I would look into buying opportunities. One opportunity is right in front of me, if it hits my limit orders I'll be as much as I can.
However, there's no guarantee that the limits will be filled so DYOR!
Will only set limit orders and will alert you big time before a huge pump.
Limit Entry: $2.3 - $2
Current ENJ Price: $2.973


ENJUSDTEnj shows inveted head and shoulders.
In the chart the resistance level and support appears.
So if enj succeed in break the neckline resistance, we may show profit until the next resistance.
This is just an idea.
Not financial advice.

ENJUSDTEnj in profit since breakout. From my previous chart.
This is just an idea.
Not financial advice.

ENJUSD sell ideaquick scalp on the short side, i see a double top on the technical chart so taking a stab at it 🤪
ENJIN NFT coin will grow after bouncing from 61% fib levelENJIN NFT coin is in the potential state to grow high up. It will grow after bouncing from 61% fib level and initially hit 161% fib level as 3X growth target. we will update further about trade with time to time.
Don't forget to show your love by subs and commenting if you like this idea. I love to see your comments and thoughts.

ENJUSD D2: +300% gains BULLS THE BEST level TO BUY/HOLD(SL/TP)(NWhy get subbed to me on Tradingview?
-TOP author on TradingView
-2000+ ideas published
-15+ years experience in markets
-Professional chart break downs
-Supply/Demand Zones
-TD9 counts / combo review
-Key S/R levels
-No junk on my charts
-Frequent updates
-Covering FX/crypto/US stocks
-before/after analysis
-24/7 uptime so constant updates
🎁Please hit the like button and
🎁Leave a comment to support our team!
ENJUSD D2: +300% gains BULLS THE BEST level TO BUY/HOLD(SL/TP)(NEW)
IMPORTANT NOTE: speculative setup. do your own
due dill. use STOP LOSS. don't overleverage.
READ ENTIRE IDEA BEFORE EXECUTION!
🔸 Summary and potential trade setup
::: ENJUSD D2/candle chart review
::: corrective cycle in progress no
::: spec C&H setup in progress / buy low
::: same structure MAY repeat soon
::: setup still valid as of RIGHT NOW
::: chart is LOG SCALE
::: get ready to BUY LOW later
::: currently/soon CORRECTION MODE
::: BUY LOW after 30% correction
::: entry - late Nov 2021
::: for now PULLBACK/CORRECTION MODE
::: on the right same a/b/c/d/e fractal
::: 2017/2018 fractal from the past
::: resulted in 300% gains off the ow
::: re-test of range lows is likely
::: point d is BEAR TRAP (fake breakdown)
::: SPECULATIVE SETUP
::: do your own due dill
::: and use proper risk management
::: TP bulls is +300% gains
::: details: see chart
::: FINAL TP is +300% gains
::: recommended strategy: BUY/HOLD after correction
::: TP BULLS +300% gains
::: SWING TRADE: BUY/HOLD IT
::: bull run not over yet
::: good luck traders!
::: BUY/HOLD and get paid. period.
🔸 Supply/Demand Zones
::: N/A
::: N/A
🔸 Other noteworthy technicals/fundies
::: TD9 /Combo update: N/A
::: Sentiment mid-term: BULLS/300% gains
::: Sentiment short-term: CORRECTION/MODE
RISK DISCLAIMER:
Trading Crypto, Futures , Forex, CFDs and Stocks involves a risk of loss.
Please consider carefully if such trading is appropriate for you.
Past performance is not indicative of future results.
Always limit your leverage and use tight stop loss.

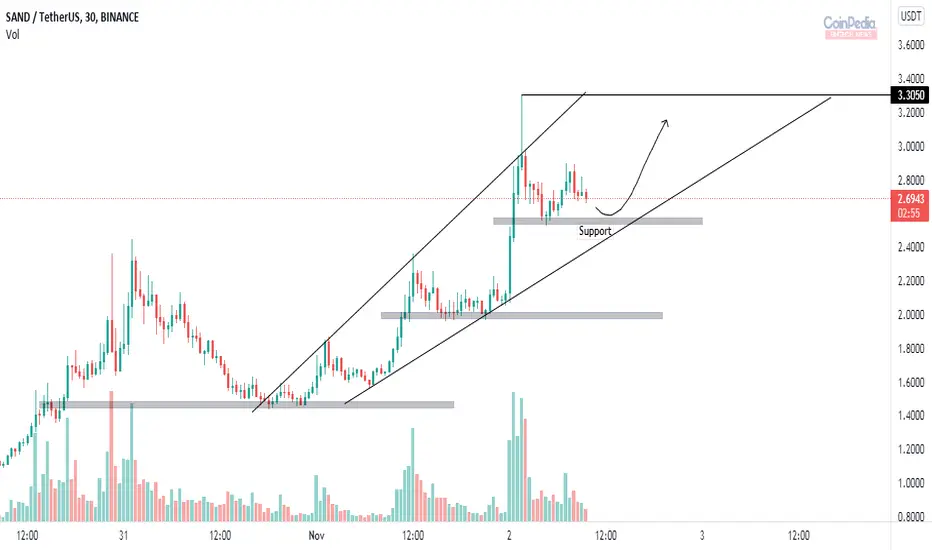
Sandbox analysis, will SAND continue the bull run ?* SAND in 30 min time frame is moving in a Broadening channel pattern.
* If the price gains a proper support near $2.5 we can expect a bounce back to $3.3
ENJ/USDTesting/tracking elliot wave theory. Please do not trade off idea without S/L. Not financial advice.

ENJ/USD 50% returns in coming weekENJ/USD has given a breakout from its consolidation, and also retested the level , now its ready to skyrocket, buy and hold tight to enjoy the ride

ENJ USDT Long IdeaENJ broke out of resistance
Waiting for a dip to my buying Zone
Price making higher lows since May dip
Expecting fireworks soon

#ENJ is starting ✔⚡💥The enjin has broken a long-term downtrend and Pulbeck has also hit that trend, now after stabilizing above the trend line, it can move towards price targets.
I hope you find this analysis useful🌹
Follow for more...
#DYOR

ENJ to the multiverse and beyond$ENG/USDT have managed to hold the fib channel 50% line after testing it for several times. Thus this behavior doesn't show strength, but the fact that the correction held the 50% and not reaching the 38.2% is a good indication. Initial target insight is 7$ per coin, and if the market had a super cycle, we can go up to 40$ per $ENJ.
Good Luck.
