ENJ - Future Projection SeriesDuring the downturns in the market I spent time learning more about utilizing the charting functions in TradingView. I also watch a lot of youtube vids about crypto and charting concepts. I came across a good chunk of info on using the “log” function and what it could possible show me.
At this point in the crypto cycle, even though I feel we are nearing a parabolic stage, it is beyond the point to expect 50X or more from me or any basic Joe who “dabbles” in crypto investing. Think long term. What can I realistically (if that even exists in Crypto) expect a coin to perform in the next bull run. Well the log function gives me a level playing field to do just that.
Using the log function, I utilize a common start date as the beginning of my parallel channel. That date is the big drop Mar/20. The parallel channel runs from the bottom of the Mar/20 drop forward in time along the bottom dips. The top of the channel is the highpoint in the cycle.
Additional note for ENJ: In the cycle, the preceding "mid-high"and following "mid Low" tells me that the following high will be proportionately higher and so I adjusted the parallel channel so the mid channel aligns with the preceding and following arcs.
The first future projection is created using the green trend lines, the first from the top of the cycle peak to the bottom, and another from that lowest point up forward in time to what I estimate as the timeframe for top cycle which approximates end of Q4, and my birthday Jan/7 so thats the future date for all graphs in this series.
The second future projection takes ratio’d growth into consideration. This is done using the blue trend line which starts at the first peak after the Mar/20 drop, using the top of arcs as the guidance. I carry this line forward to Jan/7.
Conclusion; At the time I drew this one the price was $2.55
First Projection $24.80
24.80 / 2.55 = 9.7 X
Second Projection $46.28
46.28 / 2.55 = 18.1 X
Now for a regular old fellow such as myself, a 9 to 18 X on my money within the next few months is a good investment. It literally involves 2 trades. Timing is not a great big deal as long as you get in near 2.55 otherwise the X factors changes a lot. Timing to get out is the top of the curve. This is a day time factor. It’ll be “at the top” for days or a week. You’re not chasing a pump or a knife here, its a month(s) trade. Or a parabolic week so watch close.
I’ve done this for a lot of coins now and the results are sometimes very interesting in that, a popular coin just doesn’t have the numbers or that it really has good numbers. I found as an average I like results in the 5 or above range for the first projection and 15 or above for the second projection. If I utilize this investment concept and choose coins with similar numbers I can reasonably expect a 10-15 X overall. I’ll post a few others I find interesting for this bull run in the coming posts.
My thoughts, not advice Oklah. Cheers
ENJUSDT

GRT facing resistance* GRTUSDT is consolidating in a range between it's support zone around $0.61 and facing resistance near $1.08.
* If the price breaks the above resistance we can see a bullish trend.

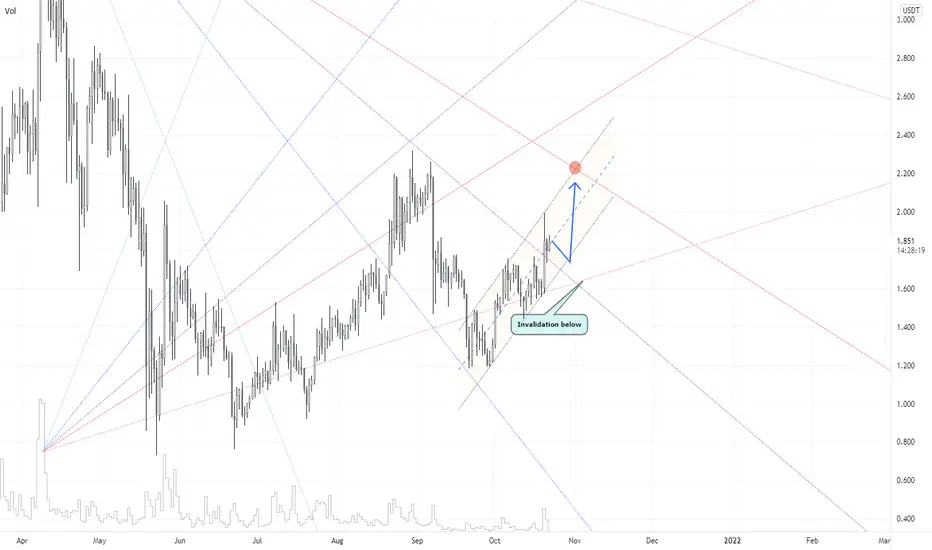
ENJ soon ready to test $2.20ENJ is cooling off on momentum getting ready for the next leg.
Target and invalidation on chart. Close to support area in the channel are the prices to get in.
ENJ as crypto gaming token could take off to past $4I'm playing ENJ short term as a quick trade. Grabbed some in the retracement and with this volume activity took already my 1/3 profit. Looking above here to take a second tier profit and final take profit if it gets above 4. I think it can continue higher but I'm being conservative here.

#ENJ ENJIN 1D CHART - NEEDS TO COOL DOWNEnjin is definitely a good project and a great performer but the daily RSI is really high. If it cooled down for a bit and had an RSI reset, it could push to the next leg up.
What are your thoughts? Comment below and hit the like please. Thank you!
Disclosure: This is just my opinion and not any type of financial advice. I enjoy charting and discussing technical analysis . Don't trade based on my advice. Do your own research! #cryptopickk #bitcoin #altcoins


Enjine to Moon (Becoming Polkadot Parachain)BINANCE:ENJUSDT
As you know Enjine will be integrated into Polkadot Ecosystem by becoming one of its Parachain’s, which should boost the demand and price of the ENJ token big time.
parachains.info
In Terms of Elliott Wave, we finished 4 mayor Primary Impulse Wave moves, and are missing Wave 5 up to the upside to new all time highs. Which should last several weeks or months.
We clear $2.334 USD, a mayor resistance level, next one is about $4 USD. And if we clear that one, we should reach around $6 USD pretty soon. Right now, it is about $2.68 USD.
Mid-term, looks great, both fundamental and technically. Should be an easy doble before year end. With potential to go much higher.
Good Luck to You

MANA and ENJIN Catch the move ENJIN hasn't moved as far as MANA has
they are exactly the same
Catch the move on ENJ, it will be big, like MANAUSD right now

ENJIN is about to takeoffENJUSD has broken out of this triangle that has formed
It could also be considered a Flag, as part of a bullflag structure
You can see the price creeping out of the triangle, a very bullish scenario
Don't miss this one

₿ ENJUSDT 1D ₿ : 29.Oct.2021 (Update)52% Profit after 2 weeks ... Also, the price has been successful in breaking the static resistance and is still advancing ...
Follow our other analysis & Feel free to ask any questions you have, we are here to help.
⚠️ This Analysis will be updated ...
👤 Arman Shaban : @Ar_M_An_4
📅 29.Oct.2021
⚠️(DYOR)

ENJ - Metaverse trending - Send it!Hello guys!
Following the metaverse trending, you should take a look on ENJ right now. As you can see, it has broken the previous resistance so try to buy some at the retest area. TP follow the chart! Thanks!
NFA!

Long-term trend (ENJUSDT LONG)* Long-term parallel channels on the weekly chart for both price and RSI.
* Cup and handle completing along the trendline from mid-cycle top to top of the mid-cycle consolidation phase.
* 21W EMA crossed above 20W SMA.
* If ENJUSDT holds above $2.18, preferably closing a weekly candle above this level, then this bodes well for ENJUSDT.
* If weekly RSI holds above mid-channel, then there is a decent probability that ENJUSDT will go into price discovery; if not, then ENJUSDT will probability reach previous ATH around Dec'21.
* All these are aligned to my wider BTCUSD thesis.

ENJUSDTThe completion of the cup will be a sign of the ascent of Bism 3 and 4 dollars, waiting for the right entry point, the range of 1.9 to 2 can be appropriate.
Of course, be sure to take a look at the status of bitcoin ...

ENJ - Where to enter again!You can enter for a trade with ENJ/USDT pair again. Watch the indicated price range.

ENJ BreakoutENJ/USDT
1D/8H
ENJ has broken out of a symmetrical contracting triangle on the daily having initially rejected off the upper structure within daily supply and creating a falling wedge reversal triangle that created a new higher high and higher low and started a new uptrend. We rejected off the daily supply with a rejection wick on both the 1D and 8H and consolidated below mitigating the sell side pressure above before continuing its upwards move breaking out nicely with little sell side pressure and supporting volume. Momentum on the MADC daily still showing healthy upwards motion as we cross the centrline and volume increases whilst the histogram remains bullish.
Expecting a continuation into the 1.272 fib and into the next level of daily supply where a reaction is expected.
We don’t predict, we react to what the market is showing us.

enjin is ready!$enj looks very strong but please keep in mind that altcoins are not immune to btc movements.

ENJUSDT Technical Analysis⏳ Spot
💎 ENJUSDT has formed an ascending channel and the price has been making HHs and HLs. After several green candles we might see a Pullback before the price continues the move in the channel
🌐 Tradingview
🏁 Short & Medium Term
💵 Invest Only 5% of your Portfolio
🎳 Entry at Market or at 1.700 - 1.780
☕️ TP1 2.000
🍺 TP2 2.280
🍻 TP3 2.510
🍾 TP4 2.800
🍷 TP5
🍸 TP6
🍹 TP7
🎁 TP8
🚫 SL 1.555
Good Luck 🎲
Check the Links in Description and If you LIKE this analysis, Please support our page and Ideas by hitting the LIKE 👍 button. ❤️ Your Support is really appreciated! ❤️
Traders, if you have your own opinion about it, please write your own in the comment box. We will be glad for this.
Feel free to request any pair/instrument analysis or ask any questions in the comment section below.
We will have more FREE forecasts in TradingView soon
Have a profitable day 😊👍🏻

ENJ CHART ANALYSIS UPDATEENJ broke the trend and also got past the resistance around 1.7$
Personally, I bought some when we broke the trend.
I expect it to go to the next resistance level at 2.05$ in the next few hours/days.
If we do break the next resistance level, then I think we can see a new ATH for ENJ in the next few weeks.
Personally, I am aiming at these targets.
TP1: 4$ I take 50% profit
TP2: 7$ I take 25% profit
TP3: 10$ I take 25% profit
This is not a financial advice, I look for long term benefit it's my strategy.

ENJ LONG Opportunity 20211022Signal: Red -> Green
Structure Confirmation: Break Through the Resistance Line

ENJUSDT AnalysisHello friends.
Please support my work by clicking the LIKE button(If you liked).Thank you!
Everything on the chart.
open pos: market
target: 2.5 and 2.7
after first target reached move ur stop to breakeven
stop: ~2 (depending of ur risk). ALWAYS follow ur RM .
risk/reward 1 to 3.5
Good luck everyone!
Follow me on TRADINGView, if you don't want to miss my next analysis or signals.
It's not financial advice.
Dont Forget, always make your own research before to trade my ideas!
Open to your questions or suggestions(Looking for investors!).
ENJ ENJIN Potential AB- CD Long OpportunitySignal: Blue-> Green, set alert
potential AB-CD
ENJ, ENJIN, ENJINCOIN ENJUSD , ENJUSDT ,ENJUSDTP,CRYPTO,CRYPTOCURRENCY
DISCLAIMER
This is only a personal opinion and does NOT serve as investing NOR trading advice.
Please make your own decisions and be responsible for your own investing and trading Activities.

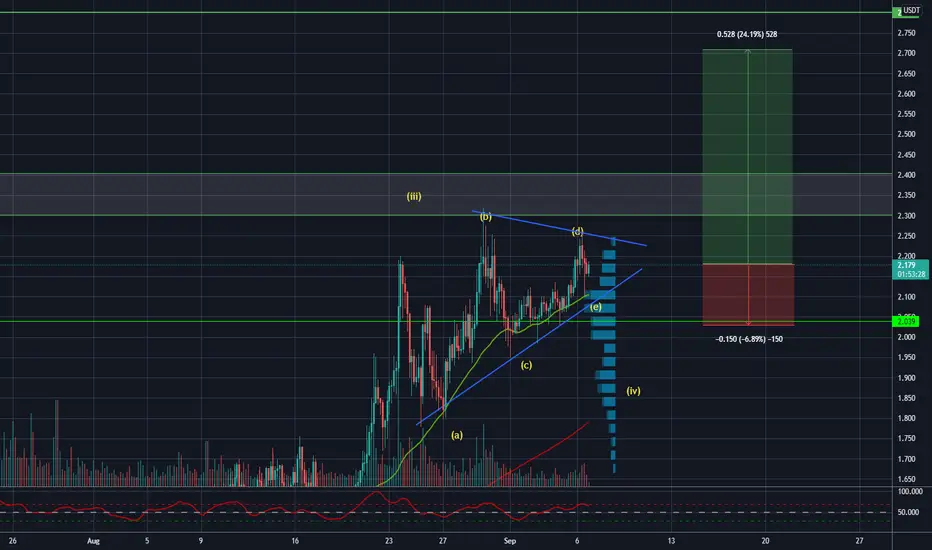
ENJ/USDT { ENJIN COIN } - BULLISH SETUPANALYSIS 🔎
- ENJ/USDT was consolidating in a symmetrical triangle pattern.
- Price brokeout above the symmetrical triangle's inclined resistance.
- This is a bullish signal.
BUY ENTRY ⬆️
- Aggressive entry: current market price.
- Conservative entry: possible retracement.
TARGETS 🎯
- Horizontal resistance level (@2.318).
- Horizontal resistance level (@4.000).
- Fibonacci extension level 1.0 (@5.054).
SETUP INVALIDATION ❌
- Breakdown below the previous swing low support.

ENJUSDT Double Bottom | Breakout & Throwback | 46% Move ExpectedENJUSDT Double Bottom | Breakout & Throwback | 46% Move Expected
NOTE:
1. Q4 Started and highly volatile
2. Do your own analysis
3. High risk involve in this trade
4. Spot trading only
5. Take very low risk
Disclaimer: I will not be responsible for any of your loss or profit.
Entry: 1.545
TP1: 1.686
TP2: 1.865
Final Target: 2.265
SL: 1.454
Trade Risk: 5.89%
Net ROI: 40% - 46%
Do not use more than 15% risk of your account. Do proper risk and money management. Stay away if you don't know how to trade.
