DASH USDT | daily chart | 36% Long > when?In the daily chart of DASH, we have some confirmations which will be supported after hitting the support line.
Gain : 36%
entry : 61.80
TP : 84.17
BINANCE:DASHUSDT
What do you think about this strategy, share your comments below;
Make sure to subscribe!
If you enjoyed this Idea hit the Like button and support us!
Entry

QTUM USDT | 1D chart | Long Position | Possible 50% gainBINANCE:QTUMUSDT
Entry Price: 2.120
Take profit: 3.179
Possible gain: 50%
What do you think about this strategy, share your comments below;
Make sure to subscribe!
If you enjoyed this Idea hit the Like button and support us!

VET USDT | 1D chart | Long position | 44% profit + entry
BINANCE:VETUSDT
The price is more likely to hit the resistance one more time
Entry Price: 0.010377
Take profit: 0.015076
Posible gain: 44%
What do you think about this strategy, share your comments below;
Make sure to subscribe!
If you enjoyed this Idea hit the Like button and support us!

Entry Strategies using Support & Resistance ZonesBrief video tutorial discussing entry strategies using support and resistance zones. How I produce support & Resistance zones can be learnt from the live stream recording HERE
With any trading indicator, it is vitally important to have a sensible entry strategy with entry, stop loss and enough risk to reward to the next support or resistance zone. It is also as important not to fudge your entry and stop to give a decent risk to reward. Frame your charts first with Support & resistance zone, put on your stop and your entry. Then the last thing to do is put on your risk to reward. I cover this in this video and show you how to use the Fibonacci extension tool to work out your risk to reward

TSLA : Technical Analysis - 21 Oct 2020On a daily time frame : TSLA is currently at its possible support level of 415. If it breaks next support level is 390. Share price may face little resistance at 430, if broken next level is 440 and ultimate short term target is 445. It has formed grave stone doji candle showing upside price rejection, intersting fact is, price has not gone down as well as compared to last day closing price. This indicates that the share price is trying to seek a support at the current levels. Also, RSI has started moving up - neutral to bullish move. Volumes were however on the lower side which is not a good sign. For tomorrow : if the stock trades above its pivot point of 425 with volumes, you may seek an entry in this stock. Alternatively, to be on the safe side, you may consider waiting for one more day allowing the stock price to close above the levels of 423 in tomorrow's session and plan your trade for Friday.

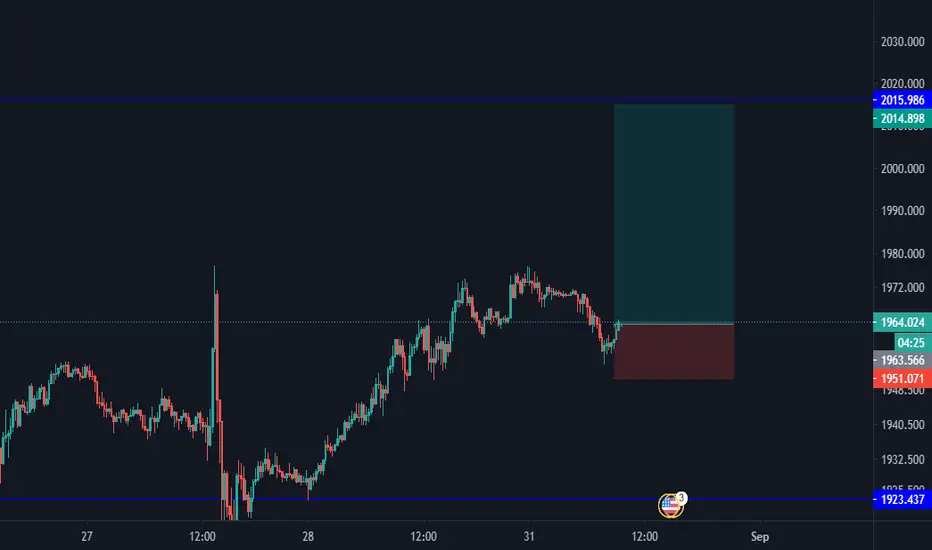
UPDATE - ENTRY XAUUSD SUPPLY ZONEUPDATE - ENTRY XAUUSD SUPPLY ZONE - We have now entered the trade. We will hold it and if stopped out no big deal! Risking 1% of our account!

GBP/CHF - 20/10/2020First position of the week has been taken using this beautiful break and retest. Currently running risk free with 50% partials taken off. Leaving the rest to run.

GBPJPY *UPDATE* ANALYSIS ENTRYYesterday analysis playing out nicely. We have now entered as planned on 137.200 with a 20pip stop loss. The plan is to hold the trade for full 4 days for R:R of 1:8. Please check out my analysis yesterday for this.


NEOUSDT |25% Long | when is the Time ??| 1DIn 1D view of BINANCE:NEOUSDT chart we have a strong support level which pushes the price above this are. Therefore we need to watch the chart for a signal for entry and that signal is our resistance level. If the price moved above this area we can put our long.
Make sure to subscribe!
hit the like button if you enjoyed it!
leave a comment below and let me know your opinion!

EOSUSDT| Perfect Long term Trade Opportunity| 86% LongThe support level (2.3681) has shown its strength for weeks on BINANCE:EOSUSDT and now we are closing to that price level. The best prediction is that we can place our long position after the price bounced back from that level and place our TP at the Resistance level (3.05797).
The second Trade opportunity would be when the price level break the resistance level and place our take profit at the higher Resistance.
.
.
.
Entry 1 : 2.3681
Take Profit 1 : 3.05797
.
Entry 2 : Price crossing the resistance
TP 2 : 5.56
Make sure to subscribe and Like the Idea if you enjoyed it!

can M fill the gap? 5.75 ---> 7.00Today was a green day on M and ill take it. up a solid +%0.04
in @ around 5.72 avg cost.
hoping M will Fill this nice gap upward to about 6 dollars Plus where ill start taking profit hopefully, keeping some to see if she can boost to 7 and beyond.
Looked at the Graphs for fun today she currently sitting at the previous levels of support/resistance which for me is nice entry/gamble Opportunity! If she falls, it is what it is.. I will be thinking about cutting me losses if she starts dropping below Instead of Breaking out.. I want the stock to breakout , not Drop!
Goodluck everyone @ peace.

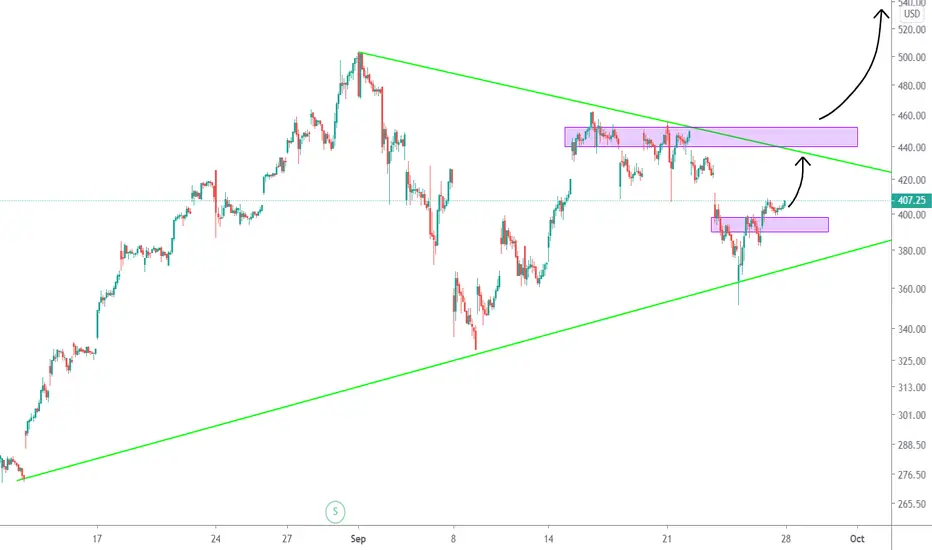
TSLA/Tesla on a big TRIANGLE chart pattern.It seems we will have a BULLISH move after breaking the chart pattern. but we can make profits even thorough the chart pattern and its a good entry point to make some. The next entry could be after breaking thorough and pullback to the triangle chart pattern.
Huge moves waiting for CRWD/Crowd Strike HoldingsGood buying position on CRWD/Crowd Strike Holdings. It has been in a big bullish trend for a long time. and with technical analysis it is a great entry point for making profits.

*XAUUSD* Entry & ExitLets keep it simple.
Buy IF candle closes above 0% level. T/P the level above it
Sell IF candle closes below 38.2% level. T/P the level below it.


Swing #tradeidea Long over $16. Clean BS, Solid longterm play3x EV/sales
13.6x Ev/Ebitda
huge rev spike this quarter
really clean BS
4.8x P/B
gross margins 43.9% in q2 -
q1 gross margins 39.5%
net margins at a healthy 18.5% in Q2- from 13.6% in Q1

AUD/JPY - Sell entryHi, i'ma startin with posting my analysis on TradingView. Hope you enjoy that.
I see strong resistance, triangle here and i enter a short position. You see SL, TP on chart.
I will try to make my analyzes better and more readable for you !!!

$EXR Trade Idea Entry and Exit$EXR Trade Idea. $106.35 has been a strong resistance zone. Looking to go long on $EXR over $106.35 with volume.
AMEX:ERX
