How to Trade Using Volume ProperlyWeakness = Up moves on decreasing volume & Down moves on increasing volume
Strength = Up moves on increasing volume & Down moves on decreasing volume
I usually try to take a look at the general background and get a feel on how weak or strong the currency pair is. When I have determined strength or weakness I will try to mark up confluent zones where sellers (if short) and buyers (if long) are going to jump in.
When price reaches my confluent level, I will look at the 5M chart to pinpoint entry.
Example will be given below, however, not on this chart as this is to old for me to find 5M data but I will give an example that is close enough.
I have not marked any green areas (strength) on this chart after our short entry point.
Entry

Stellar – Already started?Hello everyone,
XLM maybe is one of the best starters in the crypto market.
I see two scenarios in the chart…
Scenario 1 – green line, chance 60%
We have seen the bottom of the huge corrective wave 2 (blue in brackets) at 0.15 and since then XLM has built three 1-2 elliott wave setups. Now it seems that XLM is going in a stable uptrend – ideally as shown in the chart above (green line).
Scenario 2 – red line, chance 40%
Even though XLM is not looking bad at the moment, we have to keep in mind, that a final sell-off could easily surprise us. It is essential to cover all longpositions!
Take care
tgo


WTI (CRUDEOIL) – Finally on the right side! (2)Hello everyone,
WTI is one of the most exciting markets in 2018, I think. There were some trades with good profits, and now we have the chance to catch the final uptrend to 80$+, maybe 90$+. If my count is right, WTI is completing a wave 4 of higher wave degree (purple in brackets), as described in my last analysis (please check link below). A turnaround now would be perfect – in the middle of my blue trading box.
Be careful, because there is much resistance on the upside, so the way up won’t be easy, but I think the uptrend will last several months. So this analysis is for all of you with long-term interests.
Important: we have to keep in mind, that wave 4 has space until 56$, technically!
Don’t hesitate to contact me, if you have any questions or other ideas!
Take care
tgo

Mr. Dow – surfin’ down, but… (2)Hello everyone,
I decided to have a closer look the chart, because the movements of the dow are very interesting now. I think that we are in wave 4 (purple in brackets), as mentioned in my last analysis, but there is another possibility to think of: it is possible that we are in a so-called expanding diagonal. If so, there is a chance for new highs!
BUT: so or so, I think that the next movements will be the same. A good chance to trade even though we are not sure about the superordinate structure at the moment.
Scenario 1 – red line, chance 60%
Superordinate: the dow has completed wave 3 (purple in brackets) at 26.616 and now we are in wave 4 (purple in brackets). Wave A (cyan) and B (cyan) are already completed, so we are in wave C (cyan) of 4 (purple in brackets).
Let’s have a closer look at the structure of wave C of 4…
Wave a of C of 4 looks completed at 24.122 to me, so we are in wave b (purple in square brackets). Waves b are always abc-patterns in substructure. The last uptrend was wave a of b. And NOW we will see most likely wave b of b of C of 4, to be precise.
In short: down (wave b), up wave c of b of C of 4, and finally down wave c of C of 4.
Scenario 2 – green line, chance 40%
The fist movements are the same as described under scenario 2 (grey lines, a and b subordinate in this scenario are 1 and 2, beige)! The question is: is there a chance for an expanding diagonal? If so, the dow is building a five-wave-structure up to complete wave 3 (purple in brackets) much higher, as you can see in the chart above.
We have to decide later on, if scenario 1 or 2 is pushing through. In short term I see a short and directly after that a long to trade profitable.
Please leave a comment or a message if you have any questions or other ideas!
Take care,
tgo

Long play BAT dailyWe’re in the long for BAT daily since the long setup triggered at trade (1). At (2) we took partial profits (off the 4HR chart signals), and reinforced the position at (3), following the re-entry signal strategy. We’re now at resistance (4) and a weak overextension signal. The red line is where we placed our stop according to the 4HR chart.
We have a medium overextension signal at resistance. Looking for the signal to become extreme (red) and for reversal candles following. Let’s see how it plays out..
If you want to try the indicator out, follow us and drop a comment and we’ll get you set up.
Like and subscribe if you enjoy our work!
Stay calm, and happy trading!

Trading Entry and Exit ChecklistsSELF DEVELOPMENT/METHODOLOGY/PSYCHOLOGY
Trading Entry and Exit checklists
Over the past 18 years of trading, it has been a crucial step in my development to constantly critique myself and my trading strategy. I constantly monitor my performance on a daily, weekly,monthly,quartley and yearly timeframe. Listed below is a small simple example of some of the checklists that i have used in the past prior to entering and exiting a trade.
Entry Rules
1. Is the stop loss placed past the strongest support or resistance line?
2. Am i following my trading rules?
3. The risk/reward is acceptable
4. Have i double checked my entry/stop loss and target position?
5. No news announcements that will affect my trade?
6. Bid/ask spread - Is it in normal range for this pair, this session, this time?
7. AM i risking more then my agreed 1%?
8. Correlation - AM i trading against myself with already open trading trades?
Exit Rules
1. Has the market behaved as predicted? If so stay on track
2. Has the trade reached the support or resistance line?
3. Has the stop been placed too far away? or to close?
4. Am i exiting to early?
5. If unsure of trade exit immediately?
6. If i was impatient and entered trade exit immediately?
7. Is there an upcoming news event that will affect my trade?
8. Is the trade changing directions?
9. Don't take profits to early!! Are you exiting before your target line?
How has yours differed? is it similar?

Intel resistance INTC NVDA AMD
Advanced self-driving cars will need processors and GPU's, which means Intel and NVDA or AMD likely. Would you put another brand in with that risk?
Intel as at 618 Fib Retracement near 48.48, actual 48.53 right now and hitting resistance today. Expecting midterm election will drive this up to 500 or higher retrace soon.
4h, day and week are all showing same resistance. Playing that market going up with the big boys needing to put money to work.

S&P 500 – short, but…Hello everyone,
as predicted in my last analysis (long term), the S&P 500 has moved up – so far so good. But now, we want to know, how to trade the next movements (shorter term). Some of you might read my dow-analysis. Often both indices are moving similar, but in detail there are important differences!
There are three scenarios in the chart – same procedure as every time.
Scenario 1 – green line, chance 50%
I think the first stronger move down (wave a, purple in square brackets) is already completed at 2.599. So now I am expecting a shorter wave down (wave b, blue in brackets) and then a move up completing wave b of higher wave degree (purple in square brackets). If so, we then will have a good chance to ride the final wave c of 4 down to the region around 2.100 points, as you can see in the chart of my last analysis (please check link below).
Scenario 2 – blue line, chance 40%
Similar to the most expected movement of the dow (please check), the SPX may also haven’t already completed the first significant corrective wave down (wave a, purple in square brackets). If so, we will see a sell-off down to around 2.500/2.400 before moving up to complete wave b.
Scenario 3 – red lines, chance 10%
The correction might be completed already, so the SPX will go up. This is possible, but I do not think so.
I am expecting scenario 1 or 2 and I am waiting for the end of wave b (purple in square brackets) to trade wave c of 4 short.
Take care,
tgo

Ripple – one final painful sell-off?Hello everyone,
it worries me, that xrp stays at 0.45 without any decision. Because of that, I decided to re-analyze the chart carefully. The conclusion is not very nice, I suppose. Yes, there are three scenarios in the chart, but one of them is becoming more and more likely, especially if xrp stays not moving!
Scenario 1 – green line, preferred (more hope, than everything else), 30% chance
xrp is building the first significant impulsive wave up.
Scenario 2 – blue line, 5% chance
xrp has only built the first significant 1-2 wave setup. It is not much likely, because third waves are mostly very strong. We are seeing all, but not a strong movement at the moment!
Scenario 3 – red line, 65% chance
xrp is still in the corrective pattern starting from all-time high. If this is true, we will see a final sell-off to the level between 0.04$ and 0.02$. If so, the rise form there will be very strong, I could imagine. It could be the chance for us, if this scenario is pushing through!
I think it is very important for us to think about that, so I decided to give you an update on saturdays. Please be careful, when trading ripple now!
Please leave a comment or a message, if you have any questions!
Take care
tgo

WTI (CRUDEOIL) – Finally on the right side!Hello everyone,
now it seems to be clear: the direction was right, but the count wasn’t.
What has happened?
At 75.24$ there was wave 3 (purple in brackets) ending. One wave degree higher, so the actual correction is wave 4 (purple in brackets), and this has to be leading lower. I think we have a good chance now to get in the market to make money with wave 5 (purple in brackets) of 3 (green in square brackets) which should start now or during next week.
I have already placed a trading box (blue one) in the chart, because I think there wave 4 will end and WTI then will turn the direction to new highs. I think we are good to go to 90$ and maybe more. But this, we have to decide later on.
Be careful, because wave 4 has space until 56$, technically. This, we should keep in mind, but I do not think so.
Don’t hesitate to contact me, if you have any questions or other ideas!
Take care
tgo

BTC/USDT 30m - Bullish Scenario This is what I want BTC to do to indicate to me that we are in a bullish trend.

BNB/BTC 3h - Entry TargetThis is my entry target for BNB.
*Ignore my strategy tester below, it's set up for BTC/USD.

NEBL/BTC Warming up for the skyWe're currently into a daily resistance block, and since we still haven't bounced hard off it and are proceeding to make higher lows, on lower timeframe, we can assume that the buyers are trying to push it through that resistance eventually.
Target is based on the weekly + daily resistance blocks.
Two possible strategies for the target of around 5627 to 6400 area.
- Aggressive:
Buy now, stop below previous low (3821)
- Tactical:
Buy on the retrace once it breaks above the daily green block with a stop below it, or based on the lower timeframe that develops in the meantime.
If it starts repeating the same scenario like now when it gets there, there might be even larger targets in play . But we'll get there in time.

What's happened to 'the Gold rush?This is a short screencast showing an excellent entry position. (this is not advice to enter a trade).
The gold market is holding it's breath I think. Keep in mind that generally Gold has an inverse correlation with Stock Markets in troubled times. I suspect that people are watching for a Halloween Effect, or something with the Stock Markets - so they're probably a bit anxious to jump on Gold. If the Halloween effect happens then price of Gold sinks.
But if the stock markets make a conclusive move south, I'm expecting RSIs to go on fire in the north direction. We shall 'have to wait and see' as Mr Trump often says. :))

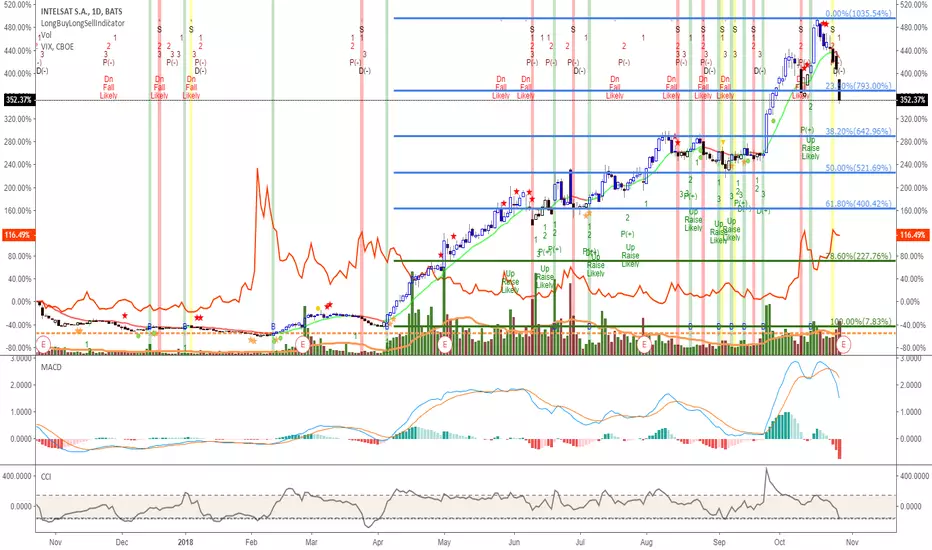
I - Intellistat (Satellite Comms)Comparing Cboe VIX VIX to I I
Currently leaning toward lower fibretracement, but we're talking about low earth satellite comms for 5G, Gov, Mil, all things big data or stock wouldn't have crushed it last 18mo.
Just a note here in case reaching lower fibonacci retracement for entry.
Nice bounce on well-respected support and the 61.8% retracement
NASDAQ:NFLX
NETFLIX had a great bounce here at well-respected support and the important 61.8% retrace. Having closed above the 200 simple moving average this chart offers a decent risk reward setup.
Having said that, one should be aware of the somewhat debatable head & shoulders pattern on the daily weekly.

WTI (CRUDEOIL) – even more 80+ nowHello everyone,
Sorry, but I have to adapt my count. And now, I must say: it’s absolutely good for 80+!
The new count:
Wave 4 (purple in brackets) ended not at 63.57 (this was just corrective wave a, blue in brackets). Wave 4 ended at 64.40. Since then WTI has made a huge 1-2 setup, as you can see in the chart above (blue in brackets). So, if I am right, WTI will start wave 3 of 5 of 5 of 5 of 3 now. This means, that WTI is not even good for 80, but eventually 90+.
If I am wrong, WTI will collapse down under 60. It is important, that 64.40 will hold, if not, the count is dead. So, be careful.
Don’t hesitate to contact me, if you have any questions or other ideas!
Take care
tgo

EUR/USD – the next act? (3)Hello everyone,
still in plan!
Yes, wave 2 (purple in brackets) has strained our nerves, but I think EUR/USD is now good for the next 1-2 Setup. If I am right, sooner or later we will see courses above 1.20, so the potential is huge! Maybe the last chance to get in for this rise.
BUT: If the last low won’t hold, EUR/USD will collapse down to parity. So be careful now!
Please leave a comment or a message if you like!
Take care,
tgo


NAK showing a Bullish divergence All of this is speculative, do your own reasoning. Opinionated analysis.
Okay lets break this down.
GLD in general looks to be making a trend to the up. Obviously NAK would relate to that movement. (or could)
Now on the 4hr Chart I have plotted 2 dotted lines one on the Line graph and one on the RSI.
* a bearish price
* with bullish pressure
the Volume Flow Indicator has also seem to show a nice reversal cup in about a 1 year span.
A Long trade would seem in effect, target unidentified.
Happy trading!

WTI (CRUDEOIL) – Still good to go to 80+?Hello everyone,
Absolutely yes!
WTI has made it nearly exactly as predicted in my last analysis (please check link below).
BUT: WTI is at a sore point now. If WTI falls through 69$ and is breaking the trend channel on the downside, we have to face much deeper courses, as mentioned in my last analysis.
So, be careful now!
Take care
tgo

Bitcoin – boooring… same as two weeks ago…Hello everyone,
Even though or just because BTC is going nowhere since days, I expect a final sell-off as I explained it in my older analysis (please check links below).
I see only a very small chance for a direct break out (5%)! The problem is: we have to be patient, and this is something we all hate, am I right?
Sorry, but it’s the same chart as days ago, because there is no movement… besides sideways…
Please leave a comment or a message, if you have any questions!
Take care
tgo
