$GBPUSD at resistance?STICing it to the chat, but sometime i'd wanna take early entry. Bases on regression S&R, GBP should continue downthrnd following a previous H&S an da retest of resistance.
IF resistance break hwever, we migth see a flip, but not holding my short for the week. Fingercrossed
took early On M15 but it about time to TP.
#Tradesmartly #STIC Algo
Entrysignal

BTC 15M APEX ENTRY Confirmed by 1H TrendThis 15-minute Apex Entry aligned with the 1H trend, avoiding fakeouts and confirming direction.
The Tenoris Apex Suite uses real-time support/resistance detection and multi-timeframe logic to identify breakout entries with zero lag.
I use this method to focus only on trades that align across key timeframes.
Not financial advice – just sharing how I trade.
For access, see profile bio.

Godshield Icon’s Gold Hunt: I Went Short at $3,305.69—Hey fam, I went short on XAU/USD at $3,305.69 on the M30 chart from April 25, 2025, at 09:02 PM WAT, and I’m here to break down my trade setup for you. I’ve been hunting gold all week, balancing my trades with my passions like curating scents at Icon Collections Store, and I’m excited to share this move. Let’s recap the setup, see how it aligns with my checklist, and make this interactive—grab a smoothie from Tastequest.com and let’s dive in!
The XAU/USD M30 chart shows gold at $3,305.51 (sell price) as of 09:02 PM WAT on April 25, 2025, after a drop from $3,306.57 earlier in the session. I entered my short at $3,305.69, just above the current price, aiming to capitalize on the bearish momentum. The chart highlights a bearish order block at $3,306.21, labeled "SELL 0.03," where smart money distributed before the sharp drop to $3,294.71 earlier in the session (as seen in your previous chart). Price retested this order block and rejected it, dropping to $3,305.51, which aligns with my entry at $3,305.69.Let’s run through my checklist to see how this trade fits your criteria, which you’ve fine-tuned over six months:Harmonic Patterns: No specific XABCD structure like a bearish shark is visible here, but the bearish momentum aligns with my earlier analysis this week—bearish three drives, head and shoulders, and a bearish shark on April 25, suggesting the downtrend continues.Market Structure: Bearish continuation is clear—lower highs and lower lows after the drop from $3,306.57. The break below $3,306.21 (the order block) confirms sellers are in control, aligning with the break of structure (BOS) I often look for, as seen on your April 27 chart.Order Blocks: Confirmed at $3,306.21, where sellers distributed. My entry at $3,305.69 came after the retest and rejection of this zone, as price dropped to $3,305.51, validating the bearish order block.Volume Profile: Not visible, but I’d expect high volume at $3,306.21, where sellers defended, and a Fair Value Gap below acting as a magnet, likely near $3,294.71, the session low.Top-Down Analysis: H4 and H1 (not shown but implied) are bearish, as I’ve noted this week with gold dropping from $3,499.99 on April 22. M30 narrows the setup, and M15 would be my strike zone for the retest of $3,306.21 as resistance.Heikin Ashi: Not visible here, but I prefer red candles for sells. Given the bearish momentum and the drop after my entry, I’d expect red Heikin Ashi candles on M15, confirming my sell.Fibonacci: Drawing Fibs from the high at $3,306.57 to the low at $3,294.71, the 38.2% retracement is around $3,299.21, and the 61.8% is near $3,302.21. My entry at $3,305.69 is just above the 61.8%, and I’m targeting the 0% Fib at $3,294.71.Gann Theory: Not drawn, but the descending trendline from my earlier charts points to a target near $3,294.71, aligning with Gann angles I often use.MACD and RSI: Not shown, but based on my system, I’d expect a bearish crossover with a negative histogram on MACD and RSI below 50, likely showing bearish divergence at $3,306.21, as noted in my follower note.Risk Management: I risk small to win big. My sell at $3,305.69, stop-loss above the high at $3,306.57 (88 pips risk), and take-profit at $3,294.71 (1098 pips reward) gives a 1:12.5 reward ratio—higher than my usual 1:3, but I’m aiming for the session low given the strong momentum.Confirmation: I wait for all pieces to align. The retest of $3,306.21, bearish momentum, and likely red Heikin Ashi on M15 were my signals. I entered at $3,305.69, just after the rejection, which is slightly early but still within the order block zone.
Trade Assessment: My entry at $3,305.69 is solid, as it’s within the order block zone and follows the rejection at $3,306.21. However, in my last message, I suggested waiting for a pullback to $3,306.21 for the best entry, which would’ve given a slightly better risk-reward ratio (36 pips risk, 114 pips reward, 1:3 ratio). Entering at $3,305.69 means I jumped in a bit early, but the trade is still valid given the bearish momentum and rejection. I’m targeting $3,294.71, the session low, with a stop-loss at $3,306.57 to protect against a liquidity grab. This trade aligns with my system, which I’ve rated a ten out of ten, but I need to work on my patience—waiting for that exact retest could’ve optimized my entry, as I’ve missed timing before (like on April 23 when I entered a sell late at $3,310 instead of $3,315).
What do you think, fam? Was my short at $3,305.69 a good move, or should I have waited for $3,306.21 as I initially planned? Drop your thoughts below—I’m curious to hear how you’d play this XAU/USD setup! If you’re one of the two ready to join me at Academia for Forex Trading, let’s talk—we’ll hunt these markets together. And while you’re at it, check out Icon Collections Store—does RiverSide, Desire, or Icoca vibe with your trading energy? Let me know!

Examples of invalid setups | Judas Swing Strategy 07/04/2025As traders, it's crucial to spend time in the lab backtesting your strategy and exploring ways to optimize it for better performance in live markets. You’ll start to notice recurring patterns, some that work in your favor, and others that consistently lead to unnecessary losses. It might take time to spot these patterns and even longer to refine them to fit your trading system, but going through this process is what helps you evolve. In the long run, this is what you need to do to become a better trader.
We spent a considerable amount of time refining our entry technique for the Judas Swing strategy after noticing a recurring issue where entering with a limit order sometimes gets us stopped out on the very same candle. After testing a few alternative entry methods and making some key adjustments, we finally found an approach that worked consistently for us. On Monday, April 7th, 2025, this refinement proved its worth by saving us from two potentially painful losses. In this post, we’ll walk you through exactly what happened and how the improved entry made all the difference.
We got to our trading desks ready to scout for setups and were drawn to promising setups forming on both FX:AUDUSD and $NZDUSD. This was exciting since the previous week offered no solid trading opportunities. As price swept the liquidity resting above the highs of the zone our bias quickly shifted toward potential selling setups for the session. But before taking any trade, we always ensure every item on our entry checklist is met. Here’s what we look for:
1. A break of structure to the sell side
2. The formation of a Fair Value Gap (FVG)
3. A retracement into the FVG
4. Entry only after a confirmed candle close
With the first two requirements on our checklist confirmed, all that remained were the final two and at this stage, patience is key. As price began retracing toward the FVG on both FX:AUDUSD and OANDA:NZDUSD , things got interesting. Price came into the Fair Value Gap on both pairs, checking off the third requirement. Now, all that was left was to wait for the current candle to close.
But that’s where things will be clear to you now.
Had we jumped in early with a limit order, we would’ve been stopped out on the same candle. This moment served as a perfect reminder of why we now wait for a confirmed candle close before taking any trade. It’s this extra step that helps us avoid unnecessary losses and stick to high-quality setups.
This entry technique like any other, comes with its own set of pros and cons. At times a limit order might offer a more favorable entry price compared to waiting for a candle close and that can influence both your stop-loss and take-profit placements. On the flip side, there are also instances where waiting for the candle close gives you a better entry than the limit order would have. That’s why it’s so important to backtest.
Your job as a trader is to put in the time to study and test what works best for your system. We chose this candle close entry method because we did the work. After extensive backtesting and data analysis, we found this approach aligns best with the results we aim for in the long run.

$2k in profits after this one trade on NQ!Give it a thumbs up if you guys liked this video!
Thank you for the support guys.

beautiful chart on opusdtso you see a great trend if you look at my finger pointing icons that identify the double bottom before the pump. you see the perfect consolidation after the falling wedge. which built a solid foundation for a support for op to be a strong investment.

AUDUSD New LONG Entry Opportunity Good news to you Traders as this beautiful 😍 currency pair recently broke out of this well drawn Trend 📉 line to Upward⬆️ direction, with a confidence Entry of 0.6510.
Buying range is from 0.6510 - 0.6515.
Guide your trade well with a SL of 40 pips
Always Trade safe with your effective Risk Management.
I wish you Trade Success.

AFL Entry, Volume, Target, StopEntry: with price above 82.72
Volume: with volume greater than 2.71M
Target: 86.95 area (this is an area, you might consider existing early if price drops below a significant moving average such as the 20 or 50 EMA. You might also considering holding some portion of the trade longer as price closes above significant moving averages)
Stop: Depending on your risk tolerance; Based on an entry of 82.73, 81.33 gets you 3/1 Reward to Risk Ratio.
This LONG swing trade idea is not trade advice and is strictly based on my ideas and technical analysis. No due diligence or fundamental analysis was performed while evaluating this trade idea. Do not take this trade based on my idea, do not follow anyone blindly, do your own analysis and due diligence. I am not a professional trader.

NVDA Entry, Volume, Target, StopEntry: with price above 505.48
Volume: with volume greater than 41.61M
Target: 590.09 area. this is an area, you might consider existing early if price drops below a significant moving average such as the 20 or 50 EMA. YoU might also considering holding some portion of the trade longer as price closes above significant moving averages.
Stop: Depending on your risk tolerance; Based on an entry of 505.49, 477.25 gets you 3/1 Reward to Risk Ratio.
This LONG swing trade idea is not trade advice and is strictly based on my ideas and technical analysis. No due diligence or fundamental analysis was performed while evaluating this trade idea. Do not take this trade based on my idea, do not follow anyone blindly, do your own analysis and due diligence. I am not a professional trader.

EURAUD SHORT - WAIT FOR PULLBACK!Waiting for a retest of 1.64521 to short EURAUD back to Daily swing low at 1.58935
If you agree drop a like and if you have any questions leave a comment :)


GOLD POI Gold has a 1-H POI after a BOS followed by a CHoCH ... Looking for short entry after waiting for a choch in 5 min as lower TF

USDCHF SHORT - MORE DOWNSIDE TO FOLLOW!Waiting for a retest of 0.89537 to short USDCHF back to key Daily level at 0.87815
If you agree drop a like and if you have any questions leave a comment :)

NZDCAD LONG - BIG REVERSAL AT PLAY!Waiting for a retest of 0.84176 to long NZDCAD back to Daily swing high at 0.82729
If you agree drop a like and if you have any questions leave a comment :)

SCS Entry, Volume, Target, StopSHORT TRADE IDEA
Entry: with price below 10.82
Volume: with volume greater than average
Target: 8.90 area (this is an area, no guarantee it reaches this price, but you should be selling on the way down)
Stop: Depending on your risk tolerance; I would have a hard stop set at 11.39, 1 penny over the high of the gap up candle.
LONG TRADE IDEA
Entry: with price above 11.38
Volume: with volume greater than average
Target: 5-10% above entry price area or as long as price closes above the 8-10EMA (this is an area, no guarantee it reaches this price, but you should be selling on the way up)
Stop: Depending on your risk tolerance; I would stop out on a close lower than the previous days candle as the market is just not in a good place right now.
This swing trade idea is not trade advice and is strictly based on my ideas and technical analysis. No due diligence or fundamental analysis was performed while evaluating this trade idea. Do not take this trade based on my idea, do not follow anyone blindly, do your own analysis and due diligence. I am not a professional trader.

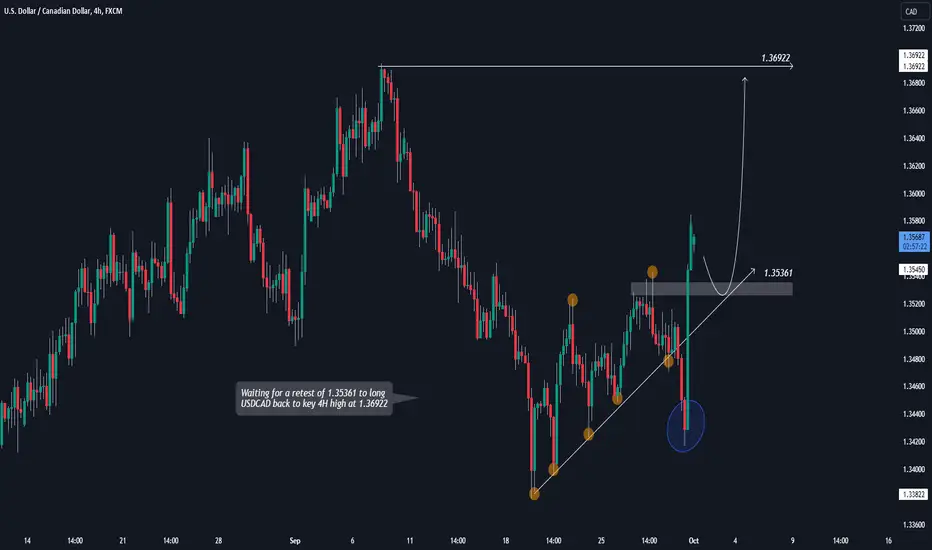
USDCAD LONG - BUYERS ARE BACK!Waiting for a retest of 1.35361 to long USDCAD back to key 4H high at 1.36922
If you agree drop a like and if you have any questions leave a comment :)
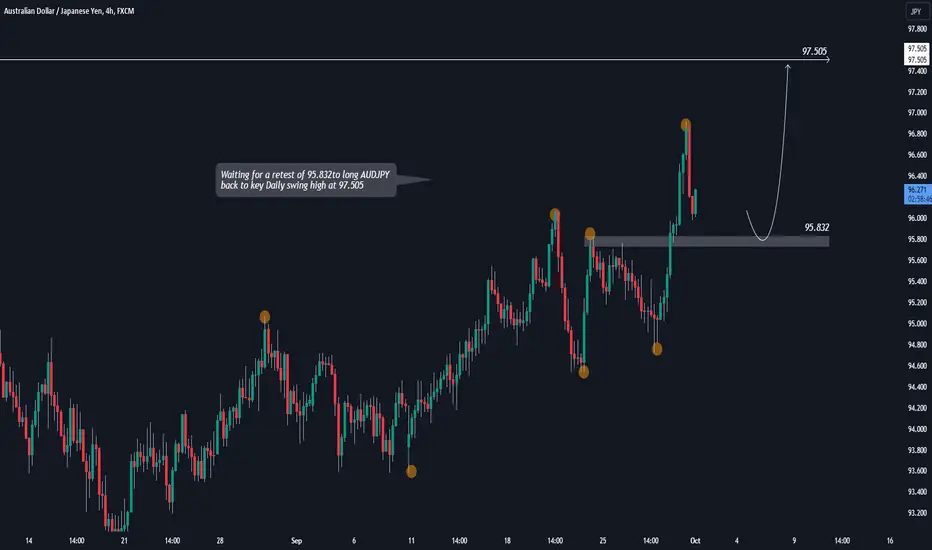
AUDJPY LONG - CONFIRMATION SOON!Waiting for a retest of 95.832to long AUDJPY back to key Daily swing high at 97.505
If you agree drop a like and if you have any questions leave a comment :)
Buying Bitcoin HereTraders,
Due to all the bullish indicators I listed in my last post (video), I will be buying Bitcoin here with a target of 31,600 and SL of around 25,000.
1. Our 25,300 Neckline has held once again!
2. 26,300-26,500 Price has absorbed with accumulation
3. RSI Hidden Bullish Divergence
4. Break/Retest of Descending TL & 50-day ma AoC
5. Bull Flag on the Daily
Best,
Stew

EURUSD Trade SetupTimeframe: 1-H Trade Signal
#Forex #EURUSD #TechnicalAnalysis #TradingOpportunity #Divergence #TradingSignal
Hey traders! 👋 Let's dive into a potential trading opportunity on the EURUSD pair using technical analysis. 📊
📉 Previously Bearish Trend:
Firstly, on the 1-H timeframe, we've been witnessing a Sideways in the EURUSD pair. 🐻
📊 Trade Opportunity:
Currently, we are looking at a potential trade opportunity with a Bullish & Breaish Bias.
💰 Investment Advice:
Please remember that trading carries risks, and it's essential to have a well-defined trading plan, proper risk management, and stop-loss orders in place. This analysis is for educational and informational purposes only and should not be considered as financial advice. Make sure to do your research and consider your risk tolerance before entering any trade.
Happy trading, and may the pips be in your favor! 🚀📈💰 #HappyTrading #ProfitOpportunity #TradeSmart

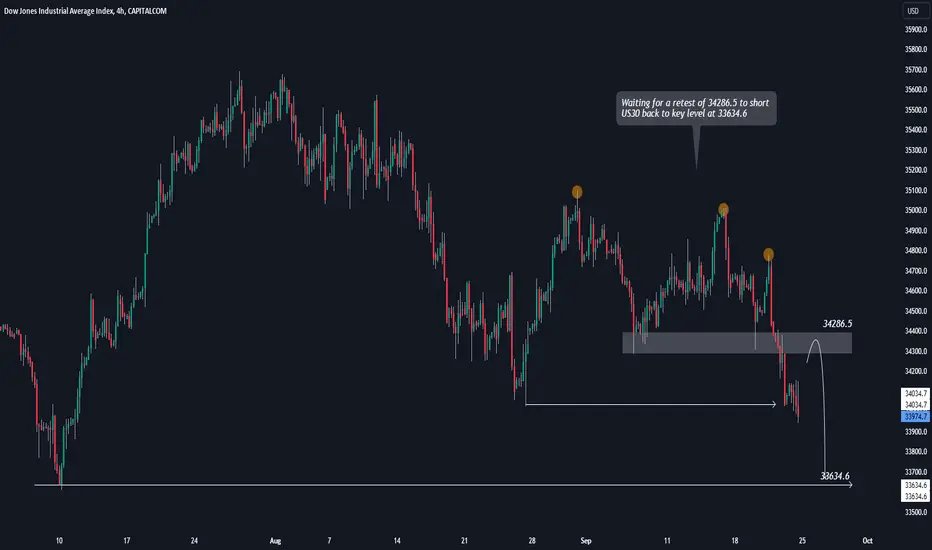
US30 SHORT - FOLLOW THE MOMENTUM!Waiting for a retest of 34286.5 to short US30 back to key level at 33634.6
If you agree drop a like and if you have any questions leave a comment :)
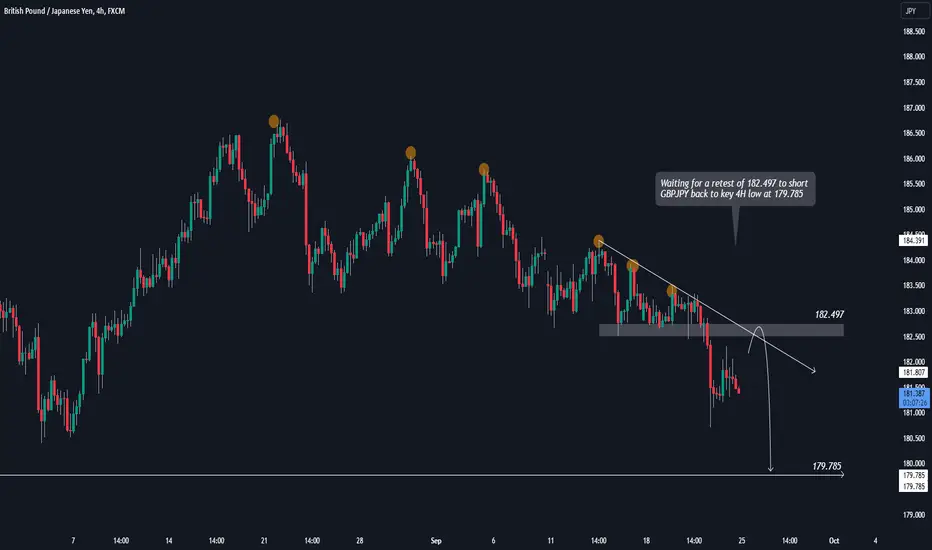
GBPJPY SHORT - BEARS GAINING MOMENTUM!Waiting for a retest of 182.497 to short GBPJPY back to key 4H low at 179.785
If you agree drop a like and if you have any questions leave a comment :)
CHFJPY SHORT - BREAK AND RETEST TRADE!Waiting for a retest of 163.837 to short CHFJPY back to key 4H low at 161.973
If you agree drop a like and if you have any questions leave a comment :)

EURUSD SHORT - CLEAN BEARISH STRUCTURE!Waiting for a retest of 1.06838 to long EURUSD back to Daily key low at 1.05401
If you agree drop a like and if you have any questions leave a comment :)
