When to enter? Does it even matter?With value investing everyone knows: Buy when there is blood in the street, when a good company has a P/E ratio of maybe under 10.
But with currencies, other than the advice "50% to 61.8% fib" and a whole lot of troll "buy every bottom sell every top with the magic indicator or magic drawing on the chart" there is no common knowledge.
We can look at this recent example where the price dropped, went sideways, and then dropped hard.
We could keep looking at winning examples when selling or buying at the top of these bands or ~61.8% retracement
The only way to know how good they are is by backtesting a large number and writing down the stats.
But are there other ways to enter?
Rather than write an entire novel with chapters I will simply go through a list of screenshots
Some say it doesn't matter where you enter...
It does and it doesn't, depends what you mean by that.
First
Second
Third
Fourth
Fifth
Sixth
Seventh
Eight
Ninth
Final
This is all simplified to make my point, or points I guess.
So you can't just say "entry doesn't matter". People that tried trading, failed, got into "holy grail" safe good boy passive S&P in the last 70 years averaged bla bla bla wake me up, they're the ones saying this. Oh so it does not matter if they buy a stock at a P/E of 8 or 280?
Of course it matters!!! Entry matters!
BUT where you enter EXACTLY does not matter. I'm not sure how to put it, but go through the examples and you see what I mean. Sometimes it matters, but even if you miss it there are other ones, and these entries are going to be at least a small area "of opportunity" anyway. Well it's more complicated than a "yes" or "no". There are plenty of ifs. And plenty of ways to approach this.
Look, Warren Buffett bought too early or later and sold too early all the time. And? Most famous investor in the world. Is there an optimal super entry that gives better results than anything else? Statistically there has to be one, so yes. If we spend ages making stats and we find it do we know it will remain this particular one? Probably not... Can we find it without it just being hindsight bias? Probably not... Would having the mighty perfect entry (I didn't say find every exact bottom, that's not actually possible) make a big difference to our results? Lol you might go from 20% returns to 20.5%. Probably even less.
The endless search for the holy entry newbs seem to all be obsessed with... Fool game. It's same as with video games, Starcraft, Lol, Dota, W3. Or chess... Newbs go "I will farm for 40 minutes full eco ignore military, full Nasus q, full catch his pawns, I'll be a monster and they'll see", 15 minutes later "Ok tough guy just wait late game you will feel sorry", 5 minutes later "Victory!" or "GG easy noob", 1 minute later "Report Nasus useless afk trash ebay account". Haha I laugh every time.
They really make all the same type of newbie "late game" and "magnet logic" mistakes, 80% of retail FX goes into "day trading" because "hey I figured out I'll get more trades and therefore grow my account faster duh", "Hey you can't lose if you don't sell", "Hey I have this brilliant martingale average down", "Hey wassup wassup wassup I found a trick", "hey if I go for lots and lots of little wins, take my profit fast I'll win small but very often and scale", "hey if I run conservative robots that only return 1% but I run 500 of them...", "hey if I add all these conditions". What a circus.
Miss the good old days. Can't humiliate noobs with trading their account is secret, they open their mouths when they get lucky then vanish, and it's not a 1 v 1 or 3 v 3 or whatever it's a 1 v whole market. Even if we cooperate and share ideas it's still a 10 v 10 million or idk. There is however the "bull vs bear" thing. But the Bitcoin bulls from 2018 from 15k to 3k almost all left (losers) and the few ones that stayed pretend they won (or they're too dumb to figure out they were on the wrong side of the market). S&P 500 bear tears are pretty delicious at the moment by the way.
You both can say entry matters and entry doesn't matter and be mostly right. Don't waste too much time trying to perfect it. Calculating max risk, probabilities of drawdown, when to exit, when to hold, when to add, how to trail, correlations, those are at least as important as the entry. What I can say is entering very early, far from the stop, out of fear of missing out is bad, and entering very late for a giant risk to reward is greedy and bad. Around 50% retracement is often a good compromise. Stats will help choosing areas and price action (stats such as: over the past 10 years on breakouts would it work out to enter in the big red candle? How about on the previous low? How about 61% fib when the price reacts near the previous low? Etc).
Entry doesn't go alone, for example when you average in a sideways within a trend well you'll want to move your stop each time you add according to your average price. That's a whole other subject. Coming up with a whole strategy even simple and even once you sort of understand the markets and have the basics of price action is still clearly going to take a couple hundred hours at best... Just writing this took me a little over 2 hours, and I rushed it, and I obviously don't start from scratch I researched all of this. Just writing an intro like this about entries and stops and targets and trends and pullbacks and breakouts and timeframes and risk and all the other stuff, not even with stats, that alone probably would take 100 hours by itself. How long it takes to convince yourself to hold winners and cut losers and quit a gambler mentality however = infinite time, just quit now you'll save time (thousands of hours!), investing is not for you.
Oh and finally, an entry "signal" is a joke. You don't go from 0 to 100 "wow this would be a great buy because of this entry", that's beyond ridiculous. You are supposed to be watching something before getting in and waiting on certain conditions to enter (pullback after breakout), never heard of anyone that had "entry signals". When George Soros went short the GBP it was "because of the entry" but he had a whole theory. The "entry" wasn't a magical signal it's simply he was close to the floor, well ceiling, and had a big RR with big odds! And he explains how "I was selling weeks before", he actually "dollar cost averaged" as I explained. He didn't wait for a certain magical point, he wasn't greedy waiting for a 1 pip stop.
Entrysignal

Bitcoin / USD - Reaching $50'000 today?The price is in an uptrend for the past 3 days (since Sept. 13) and broke to the upside the descending channel it was in.
NOW
For the past few hours, the price of Bitcoin has touched several times and struggle to break the resistance at $48750. This resistance is materialized by the SSB (Leading Span B) and Kijun on the 4H timeframe.
Entry signal for a long and targets
If we close on the 1H timeframe above $48750, our first target will be $49185, and the second target $49900.
What do you think?

long nowwe could go up a bit from here
sl ~47200
get out at SL or if PA is weak in the candles that follow (which is quite possible on Sunday)

Double bottom pattern in ANTUSDT ???With the Bitcoin trend is this will come true? Don't worry about that, u just need to know now is the same chart in Mar 24 (Ant test and failed support trend) this mean the bull run are starting.
And next target is $6
If break 6$ e can expect min or more than $13 in this season
Anything that doesn't make sense, please give me a comment. Please motivate me to develop myself and help someone needed.
Don't forget click like, it's a hug for me. Thank you!

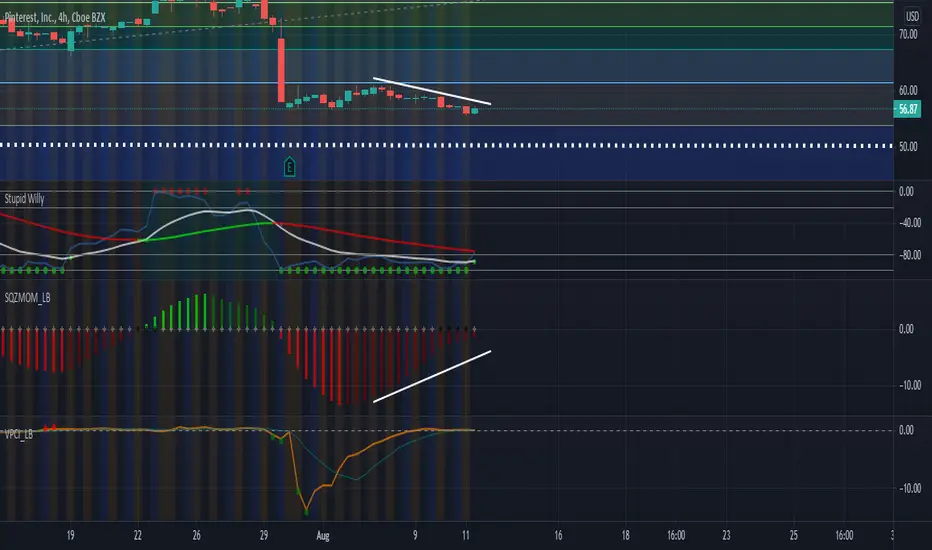
PINS divergenceAlthough we have seen reductions in selling momentum the stock has steadily moved lower following more buy signals by the Willy Oscillator. What gives me great conviction in this play is that regarding gap downs, they tend to act as support. We also have a VPCI buy indication on the daily which tends to give early buy indications. My signal to get out of this play is if the selling momentum starts to ramp up. I believe the probabilities on our side, therefore this is a great entry.
Bullish Signals
-Bullish Divergence
-Gap Down(support)
-Willy Oscillator
-VPCI (daily)
Gap Up Target
-70
NASDAQ SHORTS ONGOINGDue the high confluence on the actual zone, we can expect a full sell setup, with a high R:R ratio

READY FOR LIFTOFF?Lookin at a decending wedge, you have price touching the bottom trendline of a rising channel.If price falls below this zone your looking at the next zone below between $1.85-$1.61. Coming closer to the bottom of this wedge I don't see price retesting the lower trendline of the wedge, but anything is possible. 1st target looking at $9.75, if we get past that I'm projecting a 2nd tarjay @ $19.00, where we have the next major monthly supply zone and some resistance. Let me know your thoughts.

AAPL Daily Long EntryAAPL long entry signal above today's high. The price is at the bottom of a triangle pattern and today it had a small retracement day coinciding with confirmation from MACD crossing into positive territory. Stop should be under the 6/3/21 low.

XRP Breakaout?If XRP smashes through strong resistance and trend channel we might be going up more! Wait for a retest if you want confirmation.
Notice we are currently on a down trend and if it rejects trend line it will dip lower.

ETH Entries . . . Short?Possible entries for Long & Short
Low Vol. Looking more short!
What do you think?


INJ/USDT %75 potential from here.#INJ/USDT
$INJ currently trading at $18.150
Entry zone and strong support - $16.3 - $17.3
Resistance:- $22.2/$26.760/$30
Please click like button and comment below.
You can follow to see the real time crypto update.
Thanks...

may be time for continuation tradeSome of my methods suggest that a pullback may be deeper.
However this may be a good time for continuation trade. As per chart.

Xpeng: X Bang! 💣💣💣Although the heading can be slightly misunderstood, we believe it represents the potential of this stock the best. For the Xpeng stock, we do not see a way in which this can explode in the negative sense. Rather, we expect the price to skyrocket so at least $121 – and this is only the beginning. In the first place, the price needs to clearly stabilize above $37.50. After that, there will be a massive bullish run.
It’s not too late to hop on the train!

OragniGram: Money Trees 🤑🤑🤑It is working almost perfectly here! One target box after another is reached and we are currently preparing to experience the next breakout from the yellow box. What is important now is that we do not fall under C$3.03 in the current downward movement, but we only give this scenario a 25% chance. In general, we see amazing potential in this stock, and we hope you do, too!
Stay tuned!

RSI highly oversold --> Pullback expectedentry price: 8.75 --> above current price for assurance
Stop loss: 8.25
take profit: around 18 or higher.

EUR/CAD: The Entry Point Is Coming 🔜🔜🔜Euro has lost value against the Canadian Dollar over the last couple of months in the course of a longer correction. But tough times never last, only tough people last! So, we patiently waited and still need to wait a little longer, as we are not quite within the designated trading zone, which is indicated as the yellow box above 1.48593 CAD. Once we dip into this area, we expect a turnaround. What is important, however, is that we do not fall below 1.48593 CAD.
Good times coming, stay trading!

BTCUSD 1H STE PULSE STRATEGY INDICATORSTE Indicator shows Long Green Column Signal.
STE Indicator shows Long Green Column Crossover.
STE Indicator shows Entry Signal.
STE Indicator shows Stop Loss Signal.
STE Indicator shows Take Profit Signal.
PM me if you have any questions about our STE Pulse Indicator.

Is the USDJPY setting up for a push lowerThe USDJPY recently pushed lower off the 106.000 zone and we see price is again hovering up at this resistance area. We are watching for weakness to come into the action especially if the USD index holds above the 90.000 area. Key area for us to watch now is around 105.769 and for a lower high shoulder to play out and pressure buyers for a move down.
-------------------------------------------------------------
WE TRADE WHAT WE TEACH
Check out our recent Live Streams from our profile page!!
-------------------------------------------------------------
** If you enjoy our free content, please support and follow our profile, by hitting the Follow button to get further high quality ideas. **
** If you are following our ideas any comments and likes are most welcome and will be greatly appreciated **
** With quality alerts and correct Risk Management, you can learn consistency and grow your account **
** With quality portfolio management and defined risk levels to help your account grow and achieve steady profit targets while increasing your trading edge. **

XAUUSD 4H EFC REVERSAL INDICATOREFC REVERSAL INDICATOR
Shows Long/Short ENTRY Signal
Shows Long/Short EXIT Signal


