Qualcomm - 5G cell phone chipsNeed some snack food stocks. 5G chip manuf. QCOM at full retrace from recent rise. Buying some and setting 20% lower standing offer good til May.
Make you own decisions. Robotics, AI and other uses. Awaiting CCI pushing over 0 on weekly chart for strong wave up.
Entrysignal

USDCADHello trader,
as you know we have talked before about USDCAD for a delay chart it is for bullish.
And there is many of you don't have time to wait for a delay.
So, we see there is a chance for entry day (during a day). as 15 - 25 points.
the Target on the chart.
Good luck.

Comprehensive Trading Strategy - ConsensioDisclaimer: If you are primarily interested in copying other people’s trades then this is not for you. However, if you are willing to put in the work that it takes to learn how to trade for yourself then you have found the right place! Nevertheless please be advised that you can give 10 people a profitable trading strategy and only 1-2 of them will be able to succeed long term. If you fall into the majority that tries and fails then I assume no responsibility for your losses. What you do with your $ is your business, what I do with my $ is my business.
Identify Time Horizon
First and most important is identifying the time frame that you want to trade. I primarily trade the daily chart using Tyler Jenks’ Consensio. It was designed to capture long term trends. If followed it will ensure that you do not miss out on a trend and it will also get you out before it fully reverses.
“We want 90% of the cookie” -Tyler Jenks
There will be times when we cost ourselves a small amount of opportunity but that will be peanuts in comparison to the larger trends that will be captured.
Even though it was designed for higher time frames (TFs), specifically the weekly, it can still be used on smaller TFs based on your understanding and time availability. Decisions need to be made each time a candle closes, therefore you need to be available, or out of all positions, every time that happens.
I trade the daily chart because I know that I will be available every day for the candle close. I also like to trade the stock market, commodities, and FOREX as well as crypto because the daily closes are staggered throughout the afternoon and it gives me time to manage my positions.
If you prefer to day trade then this strategy can be used for the 1m - 1h candles. However it doesn’t seem to be too conducive to anything above 1h, if trading 24/7 markets.
For example: if trading the 4h then will not have enough time for position to develop before going to bed.
Regardless of what TF you select you can zoom out to determine longer term trends, however you should only use one TF for making decisions.
For example: I trade the daily chart and will zoom out to the weekly when I am looking for major reversals. However, if the price is signaling entries on the weekly then that is irrelevant because I make decisions based on the daily chart.
Identify Trend
“The purest form of Consensio is three Moving Averages without the price” -Tyler Jenks
Once you know what time frame you are going to trade then you need a reliable way to identify the trend. I have found Consensio to be the single most powerful tool for recognizing trends (as well as signaling entries, exits and reversals).
It is a system that seems very simple on the surface and potentially even unoriginal. However the deeper you dig the more you will uncover.
To start you need to go to the source directly:
Consensio - A New Trading System
Deep Dive Into Consensio
The notes that I have on it span well over 100 pages and I couldn’t possibly sum that all up in this post. Nevertheless I will attempt to cover the most important parts of the puzzle.
Important: Watch the videos above or else below will not make sense.
I have four subcategories for trending markets that are somewhat similar to Elliott Waves.
1) Short, medium and long term trend all in alignment. For bull trend: price > Short MA > Medium MA > Long MA (Strong trend)
2) Minor Correction (Small pullback moves against overall trend)
3) Major Correction (ABC type of correction that forms lower high but finds support at major boundary levels - Long MA, horizontal or trend line)
4) Potential Reversal (Price closes below long term MA and starts turning it over)
The moving averages should be dialed in to your specific time frame to help identify each subcategory above. When the asset is in a strong trend you want to see the Short Term MA act as support / resistance. A close above / below the Short Term MA indicates a minor correction. When there is a minor correction you want the Medium Term MA to act as support / resistance. A close above / below the Medium Term MA indicates a major correction taking place. When there is a major correction that doesn’t quite reverse the trend then you want the Long Term MA to act as support / resistance. A close above or below the Long Term MA indicates a potential reversal. If in a strong trend then expect price to quickly react from the Long Term MA and continue the trend.
For example: in a bull market the long term MA should act as strong support / provide a strong bounce. If it doesn't and the price closes below it instead then that is an indication that the bull market is getting exhausted.
When the Long Term MA starts to show signs of a reversal then I will add a Longer Term MA (default is 200) and / or I will zoom out to the weekly chart. This really helps me to understand if it is just a major correction within a market that is still trending or if a full on reversal is to be expected.
Being able to distinguish major corrections from reversals is the hardest part about consistently beating the market in the long run. Once you are comfortable with that then it mainly comes down to patience, discipline and diligence in regards to acting on signals and managing risk.
Entry & Exit Signals
5% when Price crosses Short Term MA (default is 4)
10% when Price crosses Medium Term MA (default is 9)
15% when Short Term MA crosses Medium Term MA
20% when Medium Term MA turns over (if it was trending down, then watch for it to turn up)
25% Price cross Long Term MA & Long Term MA flattens / turns over
25% Golden Cross with the Medium Term MA & Long Term MA
If multiple happens at once then sum the %’s.
For Example: P close < S & M MA then enter 15% .
If I am not in position then price crossing MA’s would trigger entries. If I am in a position then it would trigger exits. In rare cases I will flip my position by exiting a short and immediately entering a long, or vice-versa.
Entries and exits are done as soon as possible after the candle closes. I trade the daily chart so I will wait for the daily candle to close before making decisions and then I will try to make sure I get filled within 30 minutes (will take a market order if necessary). If you try to front run the candle close then you will make more mistakes than it is worth. It is very important to only make decisions after the candle closes. Everything else is noise and you cannot make decisions based on noise.
I may pass on signals if it would enter me against a longer term trend.
For Example: Price closes above Short Term and Medium Term MA’s and they cross over in a bullish manner. 30% - 50% long entry signaled. May choose to pass if Long Term MA is bearish.
I can completely pass on this entry in favor of waiting for a short if the price is below the Long Term MA and the Long Term MA is in a strong bear trend. In this case I will expect Long Term MA to act as strong resistance and will wait for price to close back below shorter term MA’s to trigger a short entry.
It takes time to reverse a trend. In the above example the Long Term MA is in a strong bear trend while price appears to be rallying through it after 50% long entry is signaled. I would pass on long entries and be very confident that the price isn’t going to blow right through my Long Term MA (due to the downward angle).
It very well might reverse the trend, however that will take time. If the price is above a Long Term MA that is angled down then the MA will act as a magnet for the price until it flattens / turns over.
Passing on the first long entries that are signaled does not mean that I will pass up on it all together, it just means that I think it is too early / risky. I would strongly prefer to wait for a golden cross with the Long Term MA flattened, or angled up, to go ahead and fully enter. In the example above I would wait for a pullback to the Long Term MA. If it supports above and gets a golden cross with the Medium Term MA then I would be much more inclined to take that entry.
It is very important to understand the difference between opportunity cost vs capitalizing on a loss. As traders we need to be completely comfortable with missing out on opportunity and extremely diligent about avoiding / minimizing losses. Therefore it is okay to pass on possible entries that are less than ideal however it is not okay to pass up on exits that feel similar.
Stop Losses & Risk Management
I determine my position size and leverage based on the amount of risk that I would be assuming. If an entry is triggered then I will use the Parabolic SAR or the Bill Williams Fractal to determine my risk.
If SAR is too tight then I will use the Fractal. I use the medium and long term MA’s to determine what is or is not too tight. Prefer stop to be above long term MA but has to be above medium MA.
I am trading Consensio, and it does not allow for stop losses in this manner. Instead it demands that you hold onto a position through the candle close and that you scale out in pieces (see above 'Entries & Exits'). This is best in 99%+ of the time.
However that really limits the leverage that can be used. If trading the daily chart 3X - 5X would be the absolute max. I tend to prefer 5X - 10X leverage for a number of reasons:
-Minimizes exchange risk
-Can minimize slippage
-Still gives me plenty of flexibility to place stop above prior Fractal / SAR
Below shows an example entry triggered and my thought process for where to place the stop along with a risk / leverage calculation.
Once I understand the risk, then I can calculate the position size. You should always think of risk as the amount you stand to lose opposed to exposure amount. I do not care about the exposure amount. I care about how much I stand to lose... how much I am risking. I care about controlling my downside and limiting it to less than 2% of my trading capital.
In the above example the risk is 7.10% and the max leverage is 14.08%. I never use the max leverage because getting liquidating comes with significantly higher fees. In this case I would use 10X or less leverage and I would make sure to set a market stop loss below the liquidation price.
If you get liquidated then it will likely be a ~22% fee. If you take a market stop before the liquidation triggers then it will be a ~2% fee.
I currently like to cap my risk at $500 per trade. $500 (USD I wish to risk) / 0.071 (calculated risk based on wick above Fractal) = $7,042 (exposure)
$7,042 is my maximum exposure. With 10X leverage $704.20 is the most I will need for margin. Once I understand my position size, leverage and margin requirements then the position size can be easily calculated based on the Entry & Exit Signals above.
Trailing Stop Losses
I consider myself 100% entered when I have $500 at risk. If the price moves in my favor then I will trail the stop loss. If I trail it to the point where it is at break even, or better, then I will not consider myself fully entered anymore.
Even though I still have the full original exposure, I am no longer assuming any risk and the latter is all that matters to me. Therefore I would feel comfortable adding to my exposure up until the point where I am risking another $500.
In the example above we get a great entry before a strong trend starts (also happened to follow descending triangle breakdown which provided great confirmation). The price quickly moves in our favor to the point where the stop is adjusted to break even, or very close to it.
With no risk I do not consider myself to be fully exposed anymore and I feel comfortable adding to my position up to an amount that would risk $500. Need to be very careful with this because adding to a profitable position after a big move can completely ruin your trade.
I will use the TD’ Sequential , RSI and Average Directional Index to confirm that the trend still has room to go. I will also check horizontals and trends to make sure I’m not selling support / buying resistance. In the example above I would really like adding because all of the above are in my favor.
This can be thought of as manual unbalancing which is the opposite of how most people approach allocating capital.
Automatic rebalancing will sell the most profitable positions and add to the lesser profitable positions in order to keep the same allocation percentages.
For example: if allocations are 50% Apple and 50% Amazon then Amazon outperforms. It will be something like 45% Apple and 55% Amazon. Rebalancing would sell Amazon and buy Apple so that it is 50:50 again.
I have always thought that is completely backwards. I want to allocate my capital to the best performing assets. If I am in a position that is really moving in my favor then I am thinking about adding to it. I would never take away from a more profitable position to add to a lesser profitable one just for the sake of balancing my portfolio.
Conclusion
What is outlined above is enough to ensure that you do not miss out on a trend and it also ensures that you will get out before it fully reverses. Don’t take me word for it, go do some backtesting yourself. That is when the power of Consensio will really come to life.
When trying out a new strategy I always recommend to start with an extremely small amount of money that is > $0 and I also recommend zooming in.
I think that it is very important to have some skin in the game so that you feel the pain and pleasure of losing and winning. However I think that is should be very nominal. If you have a $10,000 trading roll then I would take $100 and trade the 3m chart. Focus on learning the intricacies and making sound decisions. Also focus on ROI and how long it takes to generate 10%, 50% or 100%+ returns opposed the dollar amount being returned.
Regardless of what time frame you decide to trade I would always start with a very small TF. The reason is that the daily / weekly charts could take years to teach what the 3m and 5m charts can teach in days.
The decision making process should be exactly the same regardless of the TF. There are a ton of variables and intricate situations that you can put yourself into by trading small TF’s. Thinking your way through these situations is how you internalize and gain confidence in the trading system as well as the decision making process.
Facing these situations before you have significant money on the line is what I consider batting practice.
“We don't rise to the level of our expectations, we fall to the level of our training.” -Archilochos
After a couple weeks of trading the shorter TF’s I felt comfortable putting significant money to work on the Daily chart. However, I consider myself a fast learner and that process could take longer for others.

CV Sciences - day shortCVSI CBDS GWPH
CVSI is going to pay spades as some point and today it's just a day trade.
Fib retracement overlaps as 4.13 and now at 4.18 and going up on 5/30/1h
Pain therapy stock in CBD Oil, watch earnings.

GE - MACD vs DPOHere DPO shows where money is made much more simply than MACD for General Electric.
Let's say not showing an entry point using DPO on 1 day chart.

EURUSD 1H BITCOIN SIGNAL STRATEGY INDICATORBitcoin Signal Indicator works on all markets and time frames
Bitcoin Signal Strategy Indicator shows entry and exit/take profit signals
Bitcoin Signal Strategy Indicator has an adjusted trailing stop
TP is adjustable. This pair was a 2 to 1 reward risk ratio
1st trade exited with price hitting the trailing stop
2nd trade is still active rising to take profit level
PM me if you have any question i can help you with.

BTCUSD 1H BITCOIN SIGNAL STRATEGY INDICATORBitcoin Signal Indicator works on all markets and time frames
Bitcoin Signal Strategy Indicator works on all cryptocurrency pairs
Bitcoin Signal Indicator shows entry and exit signals
TP is adjustable, this pair was set for 4 TP to 1 risk
PM me if you have any questions I can answer for you

IPG Photonics shows entry timing by DPO vs historical growth48% down from earlier 2018 high. Detrended Price Oscillator shows entry crossing zero on 1 day chart near $138 and down from earlier high of $260.
www.tradingview.com(DPO) Read more here on DPO on Tradingview.com/wiki.
Volume: 494K shares traded Friday and typical higher and near 800K shares.

BCCBTC Bitcoin Cash the entry pointSigns of mid term bullishness:
1. Recently breaking a narrow boll
2. Uptrend RSI / MACD DIFF / KDJ
For now the price is still in downtrend, with D>K
We aim at getting back into the market at:
1. Somewhere between 50EMA and 50SMA
2. Support zone around 0.08
No rush.

USDJPY 15M STE PULSE INDICATOR STRATEGYSTE Pulse Indicator Strategy post entry - stop loss - take profit signals
Once take profit is hit indicator adjusts stop loss and new take profit level
Pulse bars on bottom of chart -
Bright red/green indicate breakouts
Dark red/green indicate pull backs
PM me if you have any questions I can help with

Hong Kong LNG stock - break out of more dolldrumsThis has full retrenchment, as China demand for LNG for clean energy until they can build enough nuclear power had not gone well this year. Watching this one for break-out as standby on China's markets.

CADJPY 15M STE PULSE SHORT TRADESTE Pulse Strategy Indicator
Red column painted on chart for a short signal
Next red candle open is entry @ 86.35
1st sell take profit is 86.28
2nd sell tke profit is 86.05
SL above current fractal high

RED Light - GREEN Light, sorry GREEN Light - RED LightCRONOS Group likely going full retracement to low $6's.
Oversupply, VIX, profitability, recent losses and await when larger institutional buying allowed Federally. November review watch. Few others here.
CRON
CGC
ACB
APHQF
CVSI
CBDS
Pick'n shovel stocks:
SMG
BLOZF
KSHB
IIPR
OTC:MNTR
NASDAQ:MSFT
NYSE:BE

IGC High Flying Days are over, where is good CCI entry?India Global Capitalization days of high flying money pumped in and out are over, so the question is what signal is best for watching for opportunities?
Thoughts: Set CCI to 110 on chart and review as needed. Does anyone use CCI for entries along with charts? Let me know your best practice, in case adding candlesticks for hammer up/down, volume, etc.

ETH-USD Descending Triangle Trade Continuation [UPDATE]I am writing an update to my most recent idea posted, the ETH-USD Continued Decline off of a Bear Flag formation following the descending triangle trade;
While I still believe this trade has potential to be a solid short position, I decided to take a step back off of the 30 minute and look at the 1hr movement relative to my proposed pattern. I jumped in and out of that trade very quickly, as I chose to be more conservative and review the pattern on a different timeline. I have made several successful short trades off of these patterns as can be found in a couple of my recent posts and updates.
This updated idea reflects my further analysis and updated time frame. I've extended out the flag pattern based upon the new data points that formed in the last couple hours. I see $196.59/ETH being a strong entry point with potential for a decline to the $188/ETH range we just recently saw Ethereum hit. A cross on the MACD 1 hr would also likely occur if the price falls below that point and doesn't promptly recover, that is the main indicator I am watching for right now before entry.
A breakout below that point could mean there is potential for a sub $165 price on Ethereum. I am playing this trade tight as ETH seems to be fluctuating very frequently. Each time the patterns seem to be confirmed I have entered and seen successful trades, however at each point the price decline has been less than I expected so play it carefully.
Best of luck mates. Fair winds and following seas.

XRP Buy ScenarioAll of the Details are on the Chart this time,
Trying something New!
Thanks!
The Ozark Trader.

CCJ - Cameco Corp. Mining - domestically sourced energy sourceNYSE:CCJ
Recent changes to using domestic sources of Ur (Uranium symbol) for nuclear power.
Cameco Corp. is also at an extreme low due to the 2011 psunami that hit Japan that
had back-up power failure causing a melt down and Japan shuttering 32 Nuclear
Power Plants until they had full double fault protection to prevent such from ever
occuring again. They are now getting ready to start back up, which will drive up the
prices of Ur futures (UX) and thus profits for domestic suppliers, as no new power
plants are being built these days. CCJ pricing in near break-out of 9.75-9.81 resistance
level.
View the 1w, 1d, 1h, 1m chart and look for pricing to go past 9.80-9.81 range for entry
upward and simply know prices are going up. Lower Fib retracement is 9.50 which it
quickly bounced off today. Below this 9.13 is the low and not likely with current
dynamics.

CRXPF - 420 REIT breakout in volume readying for Oct. 17th??US Cannabis REIT Crop Infrastructure breaking out since early Sept. in heavy volume.
CRXPF IIRT
1865 Acres added this month. Several customers have submitted dried crops for testing (pesticides, THC, etc. for legal sale) and looks very promising. 15 business days to go.
october 17th is Canada legal date, Crop Infrastructure Corp, formerly Fortify Resources Inc, is a Canada-based company engaged in the Real Estate Investment Trust business Sector. The Company is primarily engaged in the business of investing, constructing, owning and leasing greenhouse projects as part of the provision of turnkey real estate solutions for lease-to-licensed cannabis producers and processors offering operations. The Company's portfolio of projects includes cultivation properties in California and Washington State, Nevada, Italy, Jamaica and a joint venture on West Hollywood and San Bernardino dispensary applications. CROP has developed a portfolio of assets including Canna Drink a cannabis infused functional beverage, US and Italian distribution rights to over 55 cannabis topical products and a portfolio of 16 Cannabis brands.
Currently cost is at 236 Fibretracement and baseline of current trajectory, yes trajectory excitement beware and still entry signal showing on daily chart.

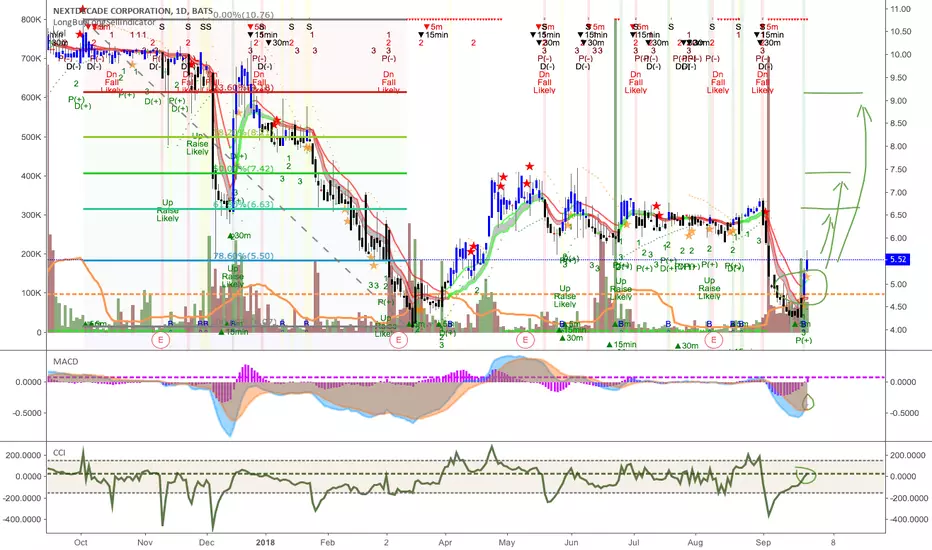
NEXTGEN energy crunchNEXT LNG GLNG SHI TELL
LNG prices not as hit by US-CH trade ware as thought as these are all take it or leave it 10 year contract energy deals.
If you can make it cheaper you make more. Floating refineries and floating transfer stations have cut out thousands of miles of pipeline and handling
costs. I'll let you figure that part out on own.
Fibretracement from 786 showing entry signal and quick 5 to 6.50 coming, or better above this 612 to 500 or above this. Strong volume and
potential here. Sorry for fib retrace values in crappy spot. Need to modify fond to bold, suggestions??
LNG gas expansion entryLNG gas prices becoming attractive and not at mercy of US-CH trade war 10% tax as first thought.
China leads the pack in LNG imports and has 10-yr contracts, wahahhaha.
LNG GLNG SHI TELL NEXT
Here shows a solid entry with strong legs from Fibretracement at 786 on love it the 1w chart and not as good on 1d chart, so more confident to hit higher highs from current $9.
LNG gas will do well provided ships run, weather good, but it's hurricane or monsoon season.
Target 1 over $12 and Target 2 more likely $15 up.

CANNTRUST HOLDINGS - TEIR 1 STOCKCNTTF CRON CGC TLRY APHQF
* CannTrust Holdings breaking out on harvest time sales about to commence....profitability as a Top Tier Cannabis stock, usually the least favored of this group I might add.
* Buy low, sell high, don't loose your money.
* chance to get more or first half share at $9 382 retracement after buying market order, can always buy more on the dip.
* Oct. 17th coming folks
* longbuylongsell by @MarxBabu Note: CCI shows excellent agreement to blue entry timing here with day chart, so MACD left out.
Disclaimer: Sorry volume with left handed index of volume # makes chart so busy and would love to have a reducting to 1/2 or better 1/3 the size.
About: CannTrust Holdings Inc is a Canada-based company, which produces pharmaceutical-grade medical cannabis for patients. The Company is a federally regulated licensed producer of medical cannabis products. The Company operates a hydroponic facility and an onsite laboratory for testing and research on the medical use of cannabis. The Company's exclusive pharmaceutical partner is Apotex. CannTrust Holdings Inc's products are divided into the following: Products Type, such as oil, dried cannabis, accessories and patient ready; Strain Type, such as hybrid, sativa dominant and indica dominant, as well as Strength, such as strong, mild and moderate. The Company's products are sold online through its Website.

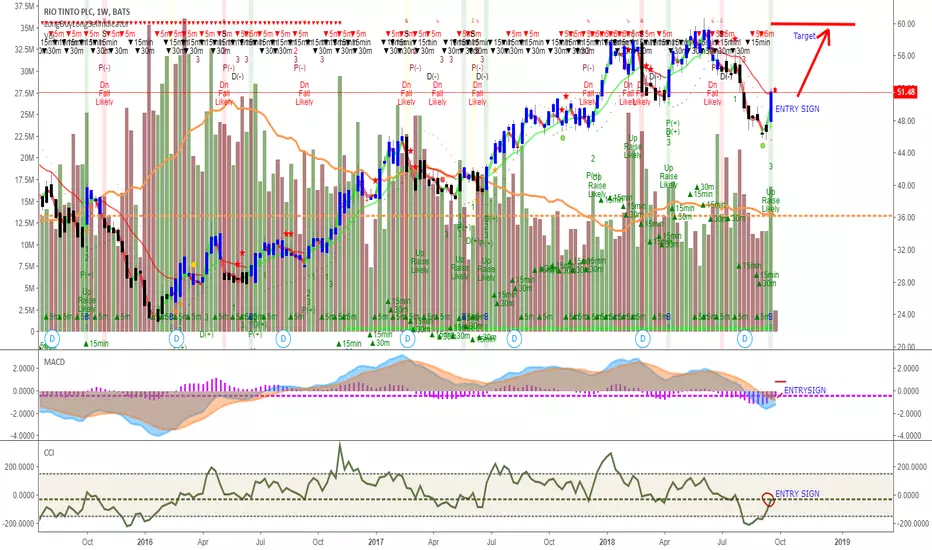
RIO Mining set to jump 15%Rio Tinto ( RIO ) is showing entry signal in buying, MACD, and CCI.
Supplier of iron oxide, bauxite for AL, titanium dioxide for paints, coatings, copper, diamonds, and uranium as large-cap mining stock.
Metal prices have been bottomed and starting to climb, along with domestic sourcing needs for steel and uranium will send this one
to $60. Currently $51.48 and target is $60 by Pedro (Martinez) Lynch.
COMEX:HG1! COMEX:ZA1!
Argentine Telecom deep discount breakout on falling wedgeTEO breaks out of deep falling wedge from half its value earlier in year.
* Paid a 17.45% dividend last year and known for double digit dividends
* Telecom 5G play for new subscribers in 2019, or watch until 2019 entry at higher price, likely near $30.
* Growing mid-cap telecom, cable, cellular provider
* Fell out of favor on negative earnings miss building infrastructure
* Revenue growth +35%, Revenue change +24%
* Currently only 20% large fund ownership, which will grow with 5G emergence
* Breaking out from bottom just above $15 and below $20 and going up.
Viewers come to own conclusions with charts and investing.
