EOS have chance to show us some hope!eos just hit one heavy demand zone there is gr8 chance that eos pump so dont miss the bus i will buy it in 2 steps.
share ur idea with me i will be happy to hear them <3
EOS

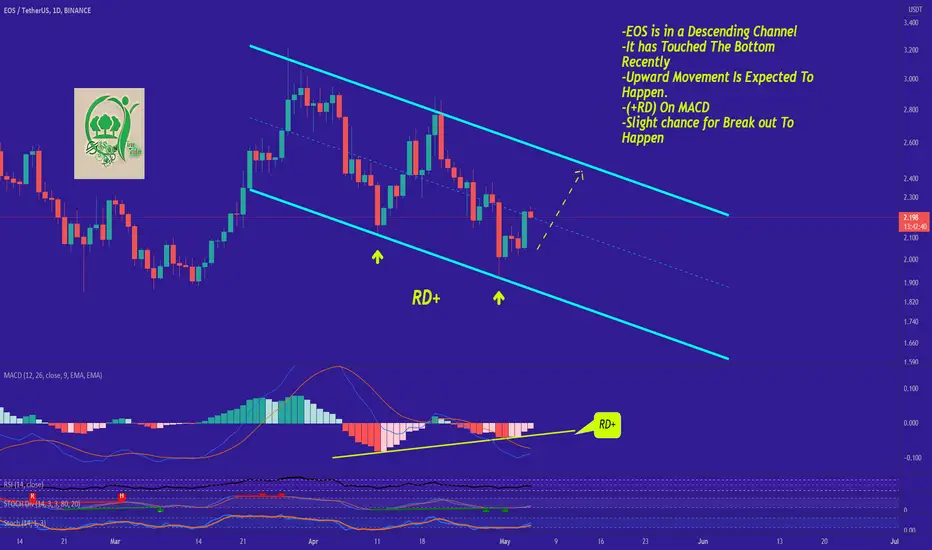
EOS Can Be bullish For a whileEOS is in a Descending Channel. This means the Price is gonna Be bearish (For Now!). So The Price has Recently Touched The Bottom of the channel and It is Expected For The Price to move Upward From Here.There is also a Regular Bullish Divergence On MACD as well (+RD) Which means the Price Can Easily Reach the Top of the channel! There is a Slight chance for Break out To Happen.
_ _ _ _ _ _ _ _ _ _ _ _ _ _ _ _ _ _ _ _ _ _ _ _ _ _ _ _ _ _ _ _ _
Thank you for seeing idea .
Have a nice day and Good luck
EOS, ready?Hey traders,
EOS has reached 2 weeks long ressistance line. Will it make a breakout? Possibly.
If so expect 20-30% growth in next couple of days. After that we'll be close to meeting few months ressistance line, IF it breaks it, adios I'm buying house on Hawaii.

EOS inverse H&S and bearish flag#EOS/USDT
$EOS 15 min
🐮 inverse head and shoulders can increase price to upper line of parallel channel.
break out from parallel channel can increase price to 0.5 fib level of daily swing down around $2.3
🐻 rejection from upper line or middle of channel can shape bearish flan and drop price to $1.78

EOS TREND LINE LONG SIGNALNice to meet you, everyone
I'm an alt trader
I am a South Korean soldier
I'm analyzing and recommending things that are similar to my personality among many alt coins
EOS is really a coin that doesn't go up.
There is a high possibility that the retest will fail
Close to breaking up
EOS is officialy BULLISHHi traders,
I've been idle recently.
A lot of things happen since my latest post, but overall I've been bearish back then, globally am still now, but we might see some small bull activity.
EOS
This coin is just creating bullish divergences one by another. Prices hitting LOWER LOWS while momentum indicators (RSI and MACD in my case) hit higher low (RSI) and created some kind off double bottom (MACD).
This coin might not be popular, but has always been 'kind' to me.
It is as well in some kind of FALLING WEDGE, so if it manages to break out of the upper ressistance I think we're going to see some fireworks ladies and gentlemen.
That's all from me for now.
Trade safe, and do your own learning and research.
Yours, TradingInformator!

Time to Buy?is it time to buy this crypto? what do you think? it's just another trading plan with target and stop loss. Do you have another perspective?

BTC to 45KLooks like BTC is going to 45K if $38493 is not taken out. If $38493 is taken out then we are going to 31K.
Why I think it will go higher and not lower. This is just my opinion and not financial advice. I hope this helps you make an educated decision.
1. It's highly unlikely we are going down considering ALT coins are all in a good setup to go higher. I will post some of the ALT coins that are ready for take off.. not to the moon but at-least like 30%-40%.
2. It should go to 45K because BTC is doing an ABC. We have completed AB and should go up for C. I have covered it in the chart.
3. Down Jones (DJI) was expected to come down to retest 33.5K and it has done it. There is not much left to go down on the Dow.
4. Finally - Narrative is so negative out there BTC will do the opposite. :)
IF $38493 is taken out then we are going much lower.. not like $35000 that you see on Twitter. We are definitely going to 31K breaking the parallel channel which BTC is in for the last few months. We should then ascend higher and not go down to 20K or 24K. BTC will not go to these level without completely its full retrace.

EOS - Video Top-Down Analysis!Hello TradingView Family / Fellow Traders. This is Richard, as known as theSignalyst.
Here is a detailed update top-down analysis for EOS .
Which scenario do you think is more likely to happen? and Why?
Always follow your trading plan regarding entry, risk management, and trade management.
Good Luck!
All Strategies Are Good; If Managed Properly!
~Rich

$EOS JUICY LONG SETUP! What is EOS?
EOS is a platform that’s designed to allow developers to build decentralized apps.
Is it a good buy opportunity right now?
If you look at the chart, you see that it is oversold again and price trading at a very strong support zone! every time price touches it price goes +600%.
What is the risk?
In this trade, you get 1:12 RRR which is insane. risking a reasonable amount of your capital for this trade shouldn't be considered risky at all.


EOS / ETH ↗️Buy Signals:
- Bullish Divergence BB%B
- Fibonacci Confluence matches div ( 3rd Fib cluster )
- Potentially bottomed in large channel
Other Signals
- Bollinger Band Squeeze ( potential large move in either direction )
- BBW all time high( existing trend is ending )
- Pending price action when price approaches the cloud.
Invalidation:
- Increased Volume and rejection in or before the cloud. ( strong resistance )
- BB%B fails to make a higher high and double tops.
- Rejection of the first Fibonacci price cluster.
Target Price:
- 1rst target: 0.0017-0.0018 ETH
- 2nd target: pending price / volume action in 1rst cluster.
- 3rd target: pending price / volume action in 1rst cluster.
- Ultimate target: 0.0065 ETH ( anticipate price to touch the beginning of the div )
Stop Loss:
0.0006712 ETH
Strategy:
- Dollar cost averaging while under first target.
Type of Trade:
- Long Swing Trade
- Ongoing purchase for contract deployment as insurance for increased contract costs.
Why buy:
- Ideal trade for any developer planning to migrate from ETH to EOS, potentially saving on EOS smart contract deployment costs.
Fundamental
- Unpopular opinion: Despite its controversial beginnings, EOS is a genuine blockchain with a unique resource model allowing feeless transactions, it only lacks a larger following, development of more trendy products, and is often overshadowed by its genesis.
- EOS EVM is being launched.
Long term outlook:
- EOS is highly inflationary and unlikely to create a long term bullish trend against ETH, however in the short term is likely to outpace ETH.
- EOS/USD is a different assessment.

EOS/USDTesting/tracking elliot wave theory. Please do not trade off idea without S/L. Not financial advice.
Link to previous chart:
The previous chart count is incorrect. I have more data with this current chart and with that I know where wave (0) begins. We are still working on impulse wave (3) and price target remains the same @$40. If this count is correct then we might see something crazy; the sub cycle waves are in with wave 1 $8, wave 2 $1.5, wave 3 $15 and wave 4 $1.8
Wave 4 went right where wave 2 is so this is the bottom for wave 4. Going any lower will invalidate these counts. If the counts are correct then we should be working towards the last impulse wave (5). This sub cycle wave 5 is long and it would make up for the length of the current cycle wave (3).


Eos skyrocket soonEos is situated into a huge falling wede with lot of bullish indicators
Macs about to poop up
Stochastic bullcross
Rsi going up also
Eos is situated near the resistance line
ENTER on this trade only after the breakout and re-test of wedge line.
The last target is 3.91$
Easy peasy with lot of good news in May which trigger bots buying activity
Wait for the breakout and re-test
Have fun

EOSUSDT 4H TA: Resistance ZoneAs we can see in the chart, it is located on the resistance range and also has the static resistance of the trend line. If this upward trend line is broken, we will increase the price. So if this range is broken, we offer to buy. Otherwise, we will see more suffering of this currency or suffering in this region.
Its not Buy or Sell SIGNAL
DYOR
BY : Mohamad Teriz - @AtonicShark

EOS - Wave C completion ✅EOS is currently in a higher timeframe ABC correction. The chart posted is showing the C wave in detail, which has 5 subwaves. We can see that subwaves 2 and 4 are ABC corrections and now we are currently in the 5th and final subwave.
We have marked out the extreme lows for EOS which falls at 1.365. It is possible we may retest that level before we start the bullrun. For the 5th subwave we are currently in, its likely we'll see a descending correction for the completion of C wave. The bigger trade is the buying of EOS from the bottom, which we can identify better once more price action appears.
Trade Idea:
- Wait for more price action to appear
- Likely it will be a descending wedge, which we can mark out
- Watch for break of descending wedge and enter
- stops below the wedge
- Targets: 3.6, 6.4.
- Longer term targets: 9, 14
What are your thoughts? Let us know below!
Goodluck and as always, trade safe.

What are you up to EOS?If you zoom out on a daily chart, EOS had quite a brutal 12 months, from braving $15 (14.9-ish) to barely worth half a bottle of Fiji water.
It looked like EOS was ready to retrace a little yesterday, but I was early on volume, it was 50/50. Today however volume % is in a decent range, and general TA metrics are ripe for a retracement (again).
Two things can happen at this S/R grey channel, Bulls will try to pump last minute, or a mild retracement towards 2.44.
Volume profile shows the Bears dominating today, making the retracement a more likely outcome (but I'll wait a few hours to make a decision).
Burdened with 2 descending channels, EOS is still eyeing 2.8 and 3-2.9 range. Both are Fibonacci levels, so it's not set in stone. Either way, channels are king on this chart.
This is my Thesis, targets are purely hypothetical based on my analysis.
This is NOT Investment and/or Trading Advice.
Happy Trades!
❤️ If you enjoy my ideas, Please like/comment, it means a lot, Thank You! ❤️

EOSWhy EOS?
Over the last few months, members of the $EOS community formed the EOS Network Foundation. The community voted to effectively fire B1 and to instead take power into its own hands. This made EOS the world's largest DAO, other than Bitcoin.
One reason $EOS received so much early hype is that the technology is superior to every other chain. This allows developers to build applications that aren’t possible on other blockchains. 4 years later, $EOS remains the most performant & battle-tested Ethereum alternative.
The issue for $EOS was a lack of leadership & coordination. Everyone expected this to come from B1, but it never materialized, so most people left $EOS for chains like Avax, Fantom, Solana, etc…that has now changed because of the EOS Network Foundation.
This change is why you see people like Dan Larimer and many others returning to $EOS and saying they are “all in”.
Next month, a catalyst event is coming: EOS EVM. This will bring plenty of dApps and users to $EOS. Lots of developers are planning to build apps on $EOS this year because the tech will enable next-gen apps. Plus, transactions are FREE.
The other major catalyst that is taking place right now are all the #EOSIO chains uniting and working together. That means you have
$WAX, $EOS, $TELOS, etc working together.
$EOS at one point was the #3 coin in all of crypto. Its price was over $20.The chain finally has leadership, funding & coordination thanks to the EOS Network Foundation.
Best regards EXCAVO

EOS Fibonacci levels + targets for coming weeksEos creating beautiful falling wedge pattern.
expect to test fiblevel 0.618 soon and maybe
breakout afterwards to targets.
- No FA
- Do your own research

EOS Price Targets and Stop LossEOS/USDT
Entry Range: $2.18 - 2.44
Take Profit 1: $2.95
Take Profit 2: $3.48
Take Profit 3: $4.85
Stop Loss: $2.05

EOSUSD Potential for Bearish Dip | 14th April 2022Price is near sell entry of 2.3655 in line with 23.6% of Fibonacci retracement and 100% Fibonacci projection. Price can potentially dip to the take profit level of 2.1257 in line with 61.8% Fibonacci projection. Our bearish bias is supported by price trading under Ichimoku cloud.
Any opinions, news, research, analyses, prices, other information, or links to third-party sites contained on this website are provided on an "as-is" basis, as general market commentary, and do not constitute investment advice. The market commentary has not been prepared in accordance with legal requirements designed to promote the independence of investment research, and it is therefore not subject to any prohibition on dealing ahead of dissemination. Although this commentary is not produced by an independent source, FXCM takes all sufficient steps to eliminate or prevent any conflicts of interest arising out of the production and dissemination of this communication. The employees of FXCM commit to acting in the clients' best interests and represent their views without misleading, deceiving, or otherwise impairing the clients' ability to make informed investment decisions. For more information about the FXCM's internal organizational and administrative arrangements for the prevention of conflicts, please refer to the Firms' Managing Conflicts Policy. Please ensure that you read and understand our Full Disclaimer and Liability provision concerning the foregoing Information, which can be accessed on the website.

EOSUSD LONGMarket just finished 1 to 5 Elliot wave Theory, and we are forecasting that this is the end of an ABC correction, because B point is after breaking a structure and at 50% fib zone of the fifth Elliot wave and C is retracement to a downtrend line, so now we expect price to start rising.
Entry: 2.231
Invalidation: 1.803
Target: 4.170
