NEED HELP WITH ALTCOINS?Now that we are in the middle of the correction season, lots of you might need help with the altcoins you're dealing with.
I've decided to do a few analyses for you guys.
All you need to do is CLICK LIKE, name a coin, and then tell me if you need the short-term, or the long-term analysis. And I will analyze the most mentioned coins for you guys.
Follow me to get the analysis you asked for.
Happy Trading
Good Luck
Like and Share
EOS

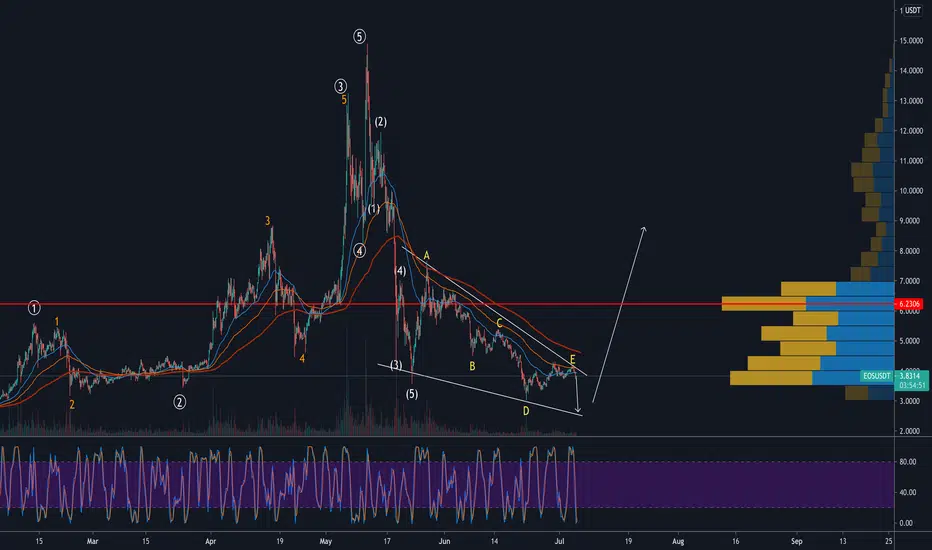
EOSUSD short It has been a while since i have posted my charts here, i had some requests to do it again
with enough feedback/ interest i will continue to do so
Now let us go to the chart
i expect eos to finish this wave lower (maybe a little push up before further downwards momentum) and hit one of my targets that are on the chart.
After this i think we get a significant bounce up.
i expect the same for BTC and XRP which i would post also
Trade Safe and always use a SL ... nothing is written in stone and the market can always surprise you!!!
If you have any questions regarding to my charts or about ew in general pls post them below and i will try to answer them asap

EOS - Resistance (Update)EOS too, is fighting resistance as predicted and now is consolidating around that area.
It might see a bit of price drop but the support areas can hold the price up.
I'll get keep this chart updated for more info.
If you're into opening long positions wait for the price to pass the resistance and then aim for the TP areas.
Current Market Price: $3.94
Good Luck
Tell me your ideas. Like and Share!
Follow for more updates.

EOS good long term holdEOS is at its base and will not go down anymore from here so the only direction from here is UPSIDE.

EOS in accumulation rangeEOS / USDT
EOS almost touched 15$ in may
And now trading around accumulation range again
Below 4$ was very interesting area for investors of EOS
but before we buy ...we still want bulls to prove themselves here ..we didn't get any action yet
Are they interested to buy current rate or lower in the range because this is bit wide range
If you are investor ....EOS must be in your watchlist for a potential buy soon
Best of luck

EOS - Fighting ResistanceJust like Bitcoin and ETH... EOS is also strong.
It broke 2 resistance areas since 48 hours ago and we're still on profit.
If you're into opening long position, wait for the price to cross the resistance or close a candle above that area and then open your positions.
The price still have room to go up even if it wants to form another bearish pattern. let's use it!
Current Market Price: $4.1451
Good Luck
Tell me your ideas. Like and Share!
Follow for more updates.

EOS 50% to 100% profit coming. Hello trenders,
Eos created a nice trendmark that may be now the new support.
The next push is going up to 6 Usd levels, maybe 8 Usd according to redistribution so that can be light to pump in the coming weeks.
Timeframe need more study but the idea is bullish.
M.M.M Make Motherfuc.in Money
Be wise: don´t work for the money, make your money work for you.

EOS - 6h. Below $ 3.7, buyers will have problemsThe tense situation in the altcoin market and the weak reaction to BTC's attempt to start growing is starting to worry. Analyzing the EOS cryptocurrency over the past two months, buyers have completely given the initiative to the wrong hands. If in the period of June 8-13, buyers had every chance to reverse the local sellers' trend, now we see a lack of support and desire:
On the 4 hour timeframe, we showed how buyers held the important range of $ 4.4-4.7 for a month, which has now become their main problem. On May 19, during a massive fall in the cryptocurrency market, EOS buyers kept the price in this range. However, a month later, sellers without volumes were able to lower the price lower and take control of this important range without any problems.
On the 12 hour timeframe , you can clearly see that the EOSUSD price is moving in the white channel of the fall from May 27:
The lower trend line works out especially accurately. Yesterday, buyers had a chance to go beyond the white channel and break the sellers' plans. However, as we see on the chart with such trading volumes, it is very difficult to reverse the medium-term trend.
Local scenario for the EOS market.
On the 6 hour timeframe, the price moves in a black wedge. The critical point for the continuation of the upward trend is at $3.7. Below this level, buyers will lose local initiative and will again have to prove their strength at the level of $3.35. Therefore, below $3.7, we would not recommend holding this coin for local speculation in the EOS market.
If the mark of $3.7 is held, we will expect the price to continue to rise to $4.4-4.7. At this point, it is worth thinking about fixing profitable short-term positions.
If we look at the global situation in the EOS market, we can see that the price is practically at a historical low:
On the EOSBTC chart, it is noticeable that globally buyers are gaining a large position since January 2021 at the moment, if we see another wave of decline in the EOSBTC market, this will give investors an opportunity to buy the coin for a long term in the range 0.0000725-0.0000850.
To summarize our analysis:
Local continuation of growth is possible after the price fixes above $3.7
The target of the local growth trend is in the range of $4.4-4.7
The loss of the $ 3.35 mark will open the way for sellers to $2.5
The first big target for the growth of the EOS market is $8.
_____________________________
We create both short-term ideas (for a local understanding of the market situation) and medium-term forecasts of price movements.
Subscribe to us and get daily concise analytics!

EOSUSDT 🟢 Ready! Couldn't be betterEOSUSDT is now at the Dip, everything is showing weakness in a bearish pattern. therefore based on our strategy and after the recovery from the support area, we expect EOS to Start the Bullish pattern.
there will be a possible drawback at the first resistance area.
Pls, give share your opinion with me in the comments section.
And don't forget to follow me!

Eos (EOS) - June 30Hello?
Welcome, traders.
If you "follow", you can always get new information quickly.
Please also click "Like".
Have a good day.
-------------------------------------
(EOSUSD 1W Chart)
We need to see if we can move above the 5.1 point to continue the uptrend.
If the 5.1-6.4053 section breaks upward as an important section, it is expected that there will be a movement to create a new wave.
(1D chart)
We will have to hold the price in the 4.0178-5.1376 zone to see if it can turn into an upward trend.
If it goes down, you should check to see if it finds support at the 3.4579-4.0178 level.
-------------------------------------
(EOSBTC 1W chart)
In order to transition into an uptrend, it needs to find support above the 0.0001470 point at least.
To continue the uptrend, it needs to move above the 0.0003040 point to find support.
(1D chart)
We need to hold the price in the 0.0001113-0.0001343 range to see if we can turn into an uptrend.
An uptrend cannot be accelerated until it deviates from the downtrend line.
------------------------------------------
We recommend that you trade with your average unit price.
This is because, if the price is below your average unit price, whether it is in an uptrend or in a downtrend, there is a high possibility that you will not be able to get a big profit due to the psychological burden.
The center of all trading starts with the average unit price at which you start trading.
If you ignore this, you may be trading in the wrong direction.
Therefore, it is important to find a way to lower the average unit price and adjust the proportion of the investment, ultimately allowing the funds corresponding to the profits to regenerate themselves.
------------------------------------------------------------ -----------------------------------------------------
** All indicators are lagging indicators.
Therefore, it is important to be aware that the indicator moves accordingly as price and volume move.
However, for the sake of convenience, we are talking in reverse for the interpretation of the indicator.
** The wRSI_SR indicator is an indicator created by adding settings and options to the existing Stochastic RSI indicator.
Therefore, the interpretation is the same as the traditional Stochastic RSI indicator. (K, D line -> R, S line)
** The OBV indicator was re-created by applying a formula to the DepthHouse Trading indicator, an indicator disclosed by oh92. (Thanks for this.)
** See support, resistance, and abbreviation points.
** Support or resistance is based on the closing price of the 1D chart.
** All descriptions are for reference only and do not guarantee a profit or loss in investment.
Explanation of abbreviations displayed in the chart
R: A point or section of resistance that requires a response to preserve profits.
S-L: Stop Loss point or section
S: A point or section where you can buy to make a profit as a support point or section.
(Short-term Stop Loss can be said to be a point where profit and loss can be preserved or additional entry can be made through split trading. It is a short-term investment perspective.)
GAP refers to the difference in prices that occurred when the stock market, CME, and BAKKT exchanges were closed because they are not traded 24 hours a day.
G1 : Closing price when closed
G2: Opening price
(Example) Gap (G1-G2)

WAN/BTCWanchain is a decentralised blockchain interoperability solution provider and they are working hard and having many upgrades ahead. Technically WAN on horizontal support on 1D timeframe and looking good. Buy now for quick gain in short term.
Targets: 1850-2000-2400-2700
If you liked my idea, follow me for more.

EOS - Getting back for now!Hey guys, same as other coins:
EOS has now entered the red zone of resistance. Main line is at 4.44.
It can hit support and go back to do a retest on that. but now the sell volume is getting higher and people are opening short positions.
So don't open long positions for now until we touch support. You can however, open short positions and aim for supports but do it with low leverages.
Current Market Price: $4.19
Good Luck
Tell me your ideas. Like and Share

Im Bullish On EOS in the upcoming daysBINANCE:EOSUSDT
💥 as we can see in the chart, MACD shows a bullish divergence against the price movement (recent lows)
⁉ if the price could break up the bearish trendline and be verified as a valid break in the next candles we could expect to see a bullish trend...
🟢I found some expected target points according to price action + using #Fibonaci projection (trend-based fib).
👁🗨 this is my personal analysis and opinion. :)
💬 so what you think?

EOS is on SaleLooks like EOS sub$4 is a good deal.
The MACD looks like it's ready to break to the upside.
Historically you would have done well if you bought at this RSI level and held for a bit.
I think once we close above $4 we might start moving faster.
(Not financial advice)

NEED HELP WITH ALTCOINS?Now that we are in the middle of the correction season, lots of you might need help with the alt coins you're dealing with.
I've decided to do a few analysis for you guys.
All you need to do is to CLICK LIKE, name a coin, and then tell me if you need the short-term, or the long-term analysis. And I will analyze the most mentioned coins for you guys.
Follow me to get the analysis you asked for.
Happy Trading
Good Luck
Like and Share

XRP/USDTAn intense decline in XRP prices yesterday morning did not allow buyers to test the orange level of 0.700 USD. As a result of the pullback, the pair returned to the area of the 0.600 USD mark.
Today, in the morning, buyers will try to test the upper border of the descending channel, but they will not be able to break through the red line of the down trend. At the end of the week, we should expect a re-test of the green support of 0.500 USD.
If you liked my idea, follow me for more.


EOS - One Target AheadEOS has already passed the resistance and flipped it into a mild support area. so the possibility of getting a bounce from that range is high.
The Bollinger middle band is supporting the price and the buy volume is still high so we can say we might have a sure target if you're looking into opening long positions.
DOn't forget to use low leverages!
Current Market Price: $3.870
Good Luck
Tell me your ideas. Like and Share


Why not use the left-side trading strategyInvestment has always been diversified, many people choose to bargain, low suction and high throw; some are on the right. The method is not good or bad, but for different markets, we should choose a suitable way, rather than mechanically mechanically.
Buffett is a typical left investment, many times he can hold for ten years or more, so everyone respect him as the god of shares. But that is the fundamental logic, there is the target of long-term investment value. But in the digital currency market, altcoin does not have solid fundamental support, so the left trading method may bring huge losses.
I made a simple count on the weekly chart, where most altcoin s have fallen over 70%, but is that the bottom? In the last bear market, altcoin mostly fell 90%. Regardless of the time cost you need to cover, that is, there is 20% in space. If your source of money is borrowing and using leverage, how much pressure will you bear? The reason why many people can not maintain a good attitude is not that they are naturally urgent, but under the pressure, can not maintain a good attitude.
Therefore, I have always suggested that you use the right trading standard, on the one hand, we can avoid the uncertain time cycle, many times, at the bottom will be sideways for a long time, even if you buy a low point, but can not make profits, that is, lose the opportunity to invest in other targets, will also let their doubts, resulting in the imbalance of mind.
Summary: For the lack of consensus, lack of fundamental support, lack of institutional funds, we should adopt the right-hand trading strategy.


eosusd almost doneIf you play only for the market rather than feelings...
that is great...
Eos is almost done.... Hopefully
