EOSBTC


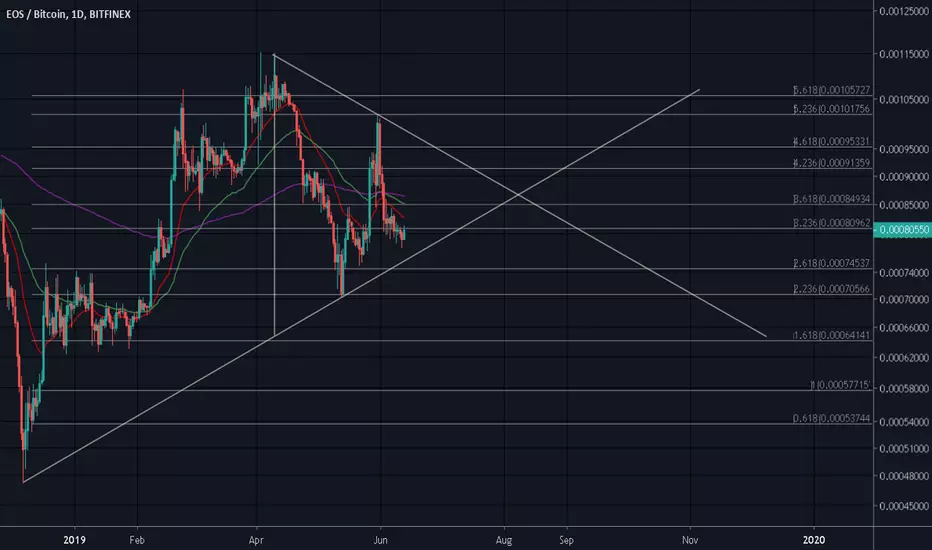
EOS double parabolic shapeJust before the bitcoin dump we had an hour ago, i posted this chart in my channel and was about to write an analysis but then things went pretty fast. It doesn't change a lot now, so far just a small drop. But it did break the bullish pattern so 2 options now.
1) We continue to drop and a lot when looking at the chart on the left. There are a few support levels in between as we can see on the right, but if we get to see a high volume dump when the 6.8ish breaks, there is potential up to 5.0 even.
2) We don't make big drops with high volume, but move sideways/down out of the curved line on the left. If that happens, it will become much more likely that it doesn't want to drop and we could see it move higher again after this correction ends.
In the mean time, as long as we stay below the 7.2ish, bearish pressure remains. Bull need to break that level to take away the bearish risk that EOS has at the moment.
Please don't forget to like if you appreciate this :)
Previous analysis:

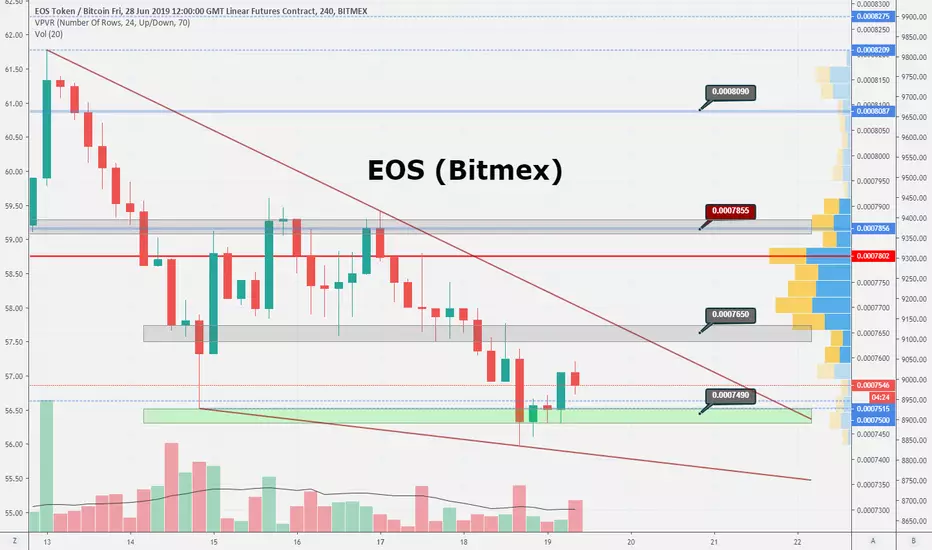
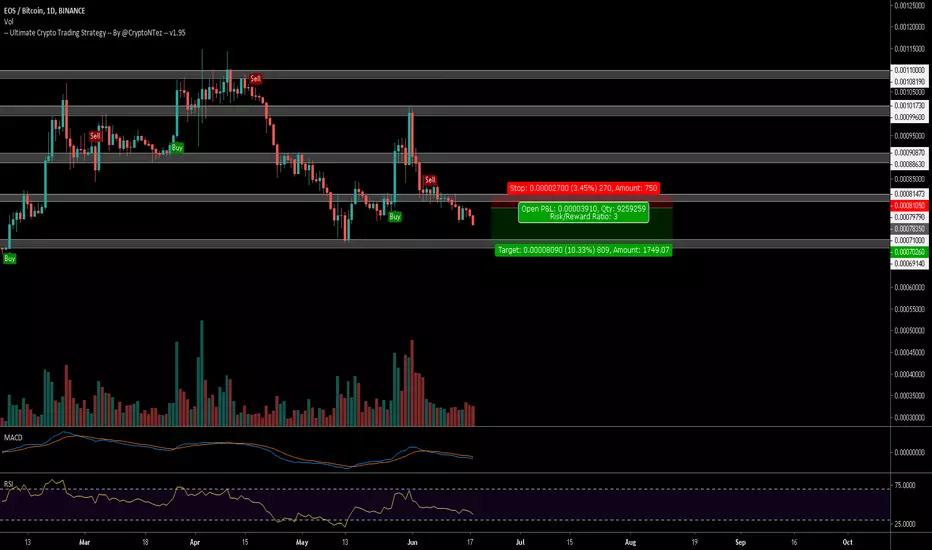
Awesome trading opportunity from channel.EOS is currently inside a very nice 4H upward Trend Channel. This gives awesome trading opportunity if you can play in both directions.
For long: You will bet the 7-7.1 region to hold: In that case the EOS bulls will have the chance to reach the upside of the channel again at 8 Dollars, giving 10% profits.
For the case we break it down (which is more probable right now, esp. if BTC rejects at $12k), we will have the chance to reach the previous crucial S&R zone on the Daily at 6,5 psychological, giving 7% profits.
So there you go, the levels are clearly on the table. But can you read the chart yourself just like I did, or are you still dependent on other people like myself to read it for you? Are you an 'illiterate in charting'? Do you have a trading plan with sheets, or are you trading from your head? Are you already making gains over the long-term, like a casino, or are you losing over the long-term, because you have no idea what your strategy is? => Those are all important questions, where are I can help you with. I wish you a good trading! :)
Edgy is providing online mentorship & trading metrics only. We are not a financial advisor, nor do we hold any formal qualifications in this area. You're trading at your own risk. No matter what you do, please set your stop loss. Please be aware, that you can lose all your money on the online exchanges.


EOS/Bitcoin "Medium term perspectives"Good prospects for medium-term purchases in the range 0.00063-0.00055.
Stop price - 0.00047.
The target level is 0.00165.

Eos/btc soon will pump hardEos/btc analysis soon will made a big pump
Buy zone :6259~5796
TARGET : 13649~14989~20671

You Don't Have to Love it to Long it - EOS! (EOSBTC)Hello Friends!
Our last EOS analysis was just a bit of playing around with Fib Times, and an update on EOS was requested so I figured I would sit down and do a real analysis on it.
As you can see, EOS is trying to establish itself with some ascending support, and a strong reaction from there in Nov/Dec 2018 resulted into an uptrend that carried us all the way to April of this year. Since then, EOS has been correcting and having bounced once off the 62% retracement, I think now it is looking to give one more opportunity to buy there, around 7000 - 7500 satoshi, before continuing upwards.
The support here is pretty clear, so a stop loss can be easily defined by a break below the fib channel to which I've added the red sell box.
If the bullish scenario plays out, hopefully EOS will see a reaction to the .886 or 100% fib time zone, and trend upwards to a breakout of the 50% fib resistance (red line under the buy box)
The dotted line/arrow, is what I believe to be the most probably scenario. Either way, a breakout or breakdown is easily and clearly defined on EOS now, all we have to do is wait...
So, you can either buy on a retouch of 62%, or on a breakout in the green box. Then, a stop loss can be set most likely a bit under 7,000 satoshi.
Good luck traders!

Possible breakout for EOS.Hello Crypto community :)
Let's take a look at EOS 4H chart, as you can see EOS could breakout to the upside, it is currently trading in this descending channel.
MacD and RSI looking good too.
Keep an eye on EOS
have a nice Friday guys :)
No financial advice.

EOS Ready to Break Out of Its Recent Slump?As anyone who has tried their hand at trading altcoins knows, it is a risky game. I usually try to avoid trading altcoins for this very reason... but some analysis of EOS' recent price movement has me tempted to pull the trigger.
The month of June has been unkind to the coin. Looking at the second Enhanced Linear Regression Indicator, we can see that EOS price has been on a steady decline for the past 3 weeks and still is clocking in with a negative slope.
While this downtrend won't be looked at favorably by EOS diehards (lol), wise investors may see it as an opportunity to accumulate the coin while its price remains low. The Profit Z Chart shows the price has fallen below the lower bound of Z-Scores, indicating the relatively low current price.
The "K2" chart, which is based on a modified double CCI, shows the price is quickly approaching an oversold state. When the two blue area charts are under the red line and begin their upwards climb, we will know that we've reached an ideal entry point. Based on recent patterns, I think the optimal entry point will come in the next 48 hours when the price falls under the .000675 mark.
Finally, the current vortex gives another hint that a positive reversal is approaching. With a large difference between the positive(teal) and negative(pink) trendlines, we can expect the VI+ line to reverse its course and begin its upwards climb. If all goes as expected, we should see the teal line rise above the pink, resulting in a bullish signal and rapid positive trend movement.
Again, never been much of an altcoin fanatic, BUT this looks like a decent opportunity to enter a long position before EOS begins its recovery.

EOS Potential Long trade
EOS seems to be bouncing off the diagonal trend line.
VA indicator signaled No Supply candle along the trend line (green arrow )
Stoch Rsi is rising
BUY- Near the Buy Zone or closes above the white line
Targets are on the chart
SL - Below previous support or -5% of buy-in
always beware of BTC volatility before taking any trade

EOS/BTC UpdateOn 1 Day timeframe
DMI , DMX(strenght momentum) is fallen sharply while dmi+(green line/bullish trend) below dmi- (red line/bearish trend) and still closing with each other indicate a bearish momentum is slight dominate over bullish trend with low strenght currently.
MACD, macd line and signal line is get rejected back to bearish area although the seller histogram is decreasing it's strength and ready to switch into buyer histogram near future.
This 'potential' symmetrical triangle will be invalidated once the price action by prolonged side ways movement.
Peace
EOS found supportEOS found support at 4470-4500 zone and making its first attemp to break the bearish trend. All volume for current 4 hour candle comes from resistance breakout attemp, which failed, but proved it has strong bullish intentions. Now most probably it will pulback to the same support zone, recharge and make another attemp.
Targets 7630-7660 and if breakout next 7700 - 7800 - 7855

$EOS Heading straight to 71k sats support after breaking down $EOS Heading straight to 71k sats support after breaking down from current level..
Selling volume increasing while RSI is about to reach oversold levels
UCTS Sell signal since June 6th
Aiming for a bag at that low level could be a good option (IF bitcoin doesn't go crazy)
#EOS
EOSBTC - What to expect on 4hr - BINANCELooks like a nice rejection here on the 4hr, and with rejection comes testing local lows, which is where we are now. I expect it to hold this next move down to levels. But nothing is 100% so we wait for closes below or above the markers on the chart and get in on the pullback. My gut wants to go long but we are waiting for the setup. NOT FINANCIAL ADVICE. TRADE SAGE.

EOS/BTC Bull flag pattern
Hello! As you can see on the diagram, the EOS shapes a bullish flag. You can look at the next achievable points thanks to the indicators (Fib.retracement(golden levels),Fib.Time zone,Bull flag patern).
That is not financial advice,just possible targets and possible dates.
Have a nice trade!

EOS/USD: EQ Breakout!EOS broke out of the previous Daily EQ range, yet again. As EOS is a high beta version of BTC, we definitely have the potential to move higher to the previous HL at 7,2 , if BTC also keeps going higher, with breaking the 9k next week towards 10k. We can perfectly see that EOS is basically doing everything of BTC, just more leveraged, as both the EOS/USD and EOS/BTC charts are identical:
If you had some value from my analysis, give it a thumbs-up & comment it, because the mechanism shows my analysis to other people then. Make also sure to follow me so you get notified on my Crypto Analyses! I wish you a good trading! :)
Edgy is providing trading metrics & online education only. We are not a financial advisor, nor do we hold any formal qualifications in this area. You're trading at your own risk. No matter what you do, please set your stop loss. Please be aware, that you can lose all your money on the online exchanges.

$EOS On a descending channel after losing support at ~85k sats..$EOS On a descending channel after losing support at ~85k sats...
UCTS Sell signal on the daily chart (10% down)
Volume is decreasing
Wait for a recover of previous support or a test of the 75k sats range as potential support..
#EOS

EOSM10 BUY ZONEyU NOW THE dRILL...
1-2 BUY orders in GREEN
1- (Bigger) BUY Order in Aqua
Stop LOss Below Red
TP1 & TP2 Yellow
TP3 Pink


QuantRsi Tutorial - trends, templates and alerts on EOSQuick tutorial on QuantRsi - drawing the trends with QuantRsi on EOS/BTC Daily and 4Hour charts.
Set up drawing templates so your trends only show on the applicable timeframe
Create an alert on the QuantRsi trend you want as support / resistance
(note, in current version of QuantRsi, use "alert trigger" instead of "plotcandle Close"
