EOS/ETH Inside a Rising WedgeEOS has been beasting out as of late but finds itself inside a Rising Wedge Reversal Pattern.
I have EOS completing its final 5 impulse wave and preparing for a correction.
OBV is staying strong while StochRSI is riding at its peak and will need to reset before another run.
I think the correction will end around 0.0216 - 0.0212
Good Luck!
EOSETH

Can EOS Put Ethereum Out Of Business?EOS (EOS) is not a new coin. In fact, it has enjoyed a rather strange reputation as “Ethereum killer” for quite some time. EOS (EOS) and Ethereum (ETH) are competitors but until now they were more like Google and Bing or Nvidia and AMD. This is because Etheruem (ETH) is the second largest coin by market cap with more than 90% of the ICOs ever held on its platform compared to EOS (EOS) which ranks as the fifth coin by market cap right now thanks to its 22% price spike today. With EOS (EOS) in the fifth spot, the debate of Ethereum (ETH) vs. EOS (EOS) has come to light once again as both coins are direct competitors with EOS (EOS) claiming as being a more sophisticated and advanced platform for smart contracts and decentralized applications.
Read Full Analysis Here: cryptodaily.co.uk

This has to be subwaves.... has to be a 1-2 move impending or 5TH Wave is going to be super short and garbage..... Just doesn't make since. If these are subwaves after this retracement the 3rd wave is gonna be HUGE


EOS April 17, 2018 Daily - 2018 - Big Winner Again In 2018 EOS just completed Minuette Wave (i), the second 5 full wave count it has completed in a short few months, during a bear Crypto market. EOS is one of perhaps 5 coins I have seen over the past few months consistently increasing in value. It has shown phenomenal strength against a super negative market pushing higher all along. Currently, it is correcting after completing (i) after which I expect it to commence forming its Minute wave (ii) where it will set several new highs beginning soon and into summer. It will likely prove along with EOS to be one of 2018 best performing crypto in my opinion and per Elliott. It is on a definite track at this point to continue into the Minute wave completing it within the next 3-4 months if historical patterns hold for this one.

EOS Where i whould buy in for mid termEOS moving in channels.
Bigger channel (red) longer term bullish, smaller channel (purple) shorter bearish.
Previous wave movement could repeat in the last one.
So i would consider good entry points the Fibonacci retracement levels around 7.64$ and 7.19$
and i expect upward movement when price is near the red channel upward trendline.
Pay attention when price will be near the trendline in the middle of red channel too.

Eos starting wave 4. 1 more wave up Breaking all time high 13333EOS Is hot just watch the bounce already hit 236..... 382 next possible candidate if we dont bounce heavy

#EOS Ichimoku Breakthrough Imminent - Expect ralliesSee chart.. previous large rally in Dec had a similar rapid upward movement and volume. This may still be early on, but it's possible we may break right out of the top of the 1D ichimoku resistance cloud, turning it into a support cloud.
On the 1H chart, I'm seeing the potential for another 10-15% within the next 6 hours.


Looking for signal to longLooks like EOS is in strong uptrend. Lets watch for signal to buy in on 6h chart. First take profit would be at 0.0165. Stop should be somewhere around 0.0139

EOS/ETH in a Falling WedgeLooks to me like EOS is in a reversal pattern and getting ready to bounce!


EOS/ETH Ready to Retest ResistanceAfter a clear breakout of a Bull Flag (or down channel), EOS is setting up to rest past resistance (red line).
Obv is staying strong, and StochRSI is showing bullish divergence.
I think EOS will retest the Red Resistance Line and allow StochRSI to reset by creating a confluence zone before we break through and see new highs.
Good Luck!


EOS/ETH UpdateAfter breaking out of another Bull Pennant, EOS is following a nice uptrend (green line).
At the peak, EOS double tapped higher low, and will consolidate before forming a new leg UP!
StochRSI has been logging higher lows and on the 1HR chart, it's showing a reset and priming for another jump. Plus OBV is still soaring strong.
Aiming for 0.016
Fundamentally, EOS will have airdrops in April, and their token swap will be taking place in June.
Good LUCK!

EOSPossibly the fall will continue, wait the short or long signal
Short if breakout the support line or long if go above de bearish line

EOS/ETH little consolidation before another leg?EOS found bottom and broke out of the downtrend line.
Seems to be consolidating in a symmetrical triangle pattern.
If EOS falls through the triangle, there will be support from the red solid lines.
From the 1hr and 30min charts, StochRSI looks to be resetting and primming for, what I think, is another leg!!
Good luck!

EOSBTC cup & handle to 0.00085 -> 0.0021Hi, I have just had an epiphany by looking across EOSBTC, EOSETH, & EOSUSD:
EOSBTC is having a classic cup & handle. We may see it touching 0.00085 (.618x of the cup) before jumping to 0.0021.
This would tie EOSETH & EOSUSD together as well.
I made a YouTube video (uploading in an hour) to explain in more words.

EOSBTC ShortEOSBTC broke another trend line.
Take Profit: 0.00918570
Stop Loss: 0.00119511
Entry: 0.00114700

EOSUSD ascending triangle, to wait for EOSBTC touching .618xToday I had an epiphany: to understand EOSUSD we must look at EOSBTC & EOSETH together.
EOSBTC is having a classic cup & handle (to accelerate before bouncing hard):
Meanwhile, ETHBTC is correcting before the next jump:
In this context, I think my previous post about an ascending triangle may just be right.
While the current pattern could potentially be read as a rising wedge (which has the opposite connotation), I think against the broader context it should be the ascending triangle.
I made a YouTube video that I'll be uploading in an hour to explain in more words.

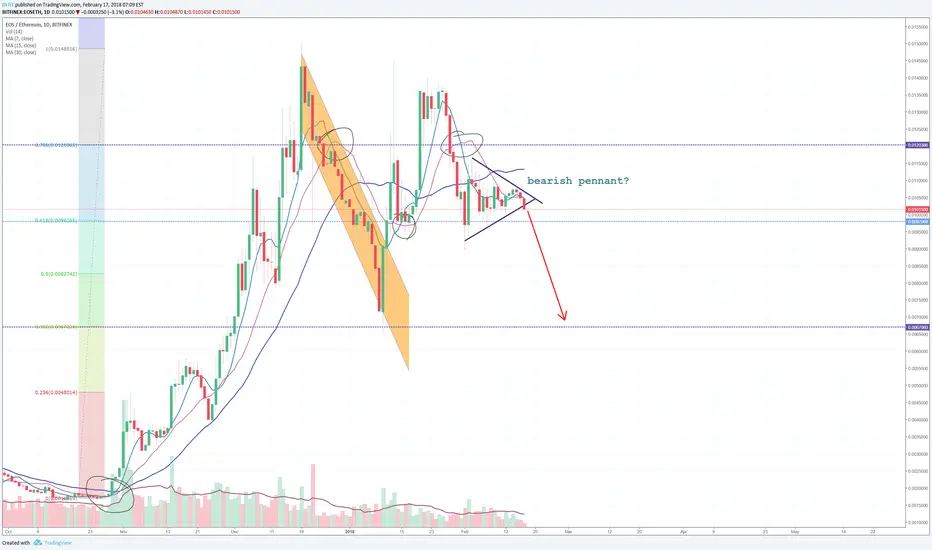
EOSETH potential bearish pennant to 0.007?As the chart shows, there's a possible bearish pennant forming.
It's perhaps a good idea not to invest in EOS at this point.
$EOS.X / $ETH.x Looking bullish!Breakdown of EOS vs ETH. I put this up after looking through Binance and wanting to take a bit of a closer look at the charts.
Breakdown is hourly and moving average looks strong to the upside.
Thoughts or comments welcome.
This is not financial advice... Invest and trade at your own risk.

EOSETH - Explode or Implode?EOS is at a very important stage long term. It is either going to go top 20-30% or fall out of these support levels that have held up for so long. I would pay close attention to EOS right around right now to see which direction it takes off to. A new high or a back to its lows to take off there again?
Indicators & good support says it should go up. Although we all know of that works!
Let me know your thoughts!
