EOSUSD


EOS, let the waiting game beginsEOS/USDT is still maintaining its support level on the weekly fib channel, also it is printing a potential Wolfe wave scenario. It have been consolidating for over 3 years period. and a lot is happening with the EOS community right now. I think EOS is wise pick for those who seek high reward and low risk.
my Targets would be the wolfe line and the fib extension 1.618

EOS $~90 Realistically Still In PlayEOS is one of my favorite alts, besides XRP and DASH. It has great price history, and it did perform exceptionally well in 2017/18. It is still listed on the biggest exchanges and so therefore i still believe that this market cycle will have its turn to shine.
If we extend fib. extensions over previous bull run, where level 1 is sitting at ATH, it just so happens that level 0.236 sits on top of the rally prior to capitulation. This further confirms that levels could be respected and price to eventually reach $90, maybe a bit more but not by much.
You can also see that if we overlay the first 2017/18 rally from the recent bottom you can see that if we did something similar in length now, we would get to near $90. That is even further conformation for me for that target.
I am not a financial advisor so non of this should be taken as a financial advise. Be well
BITFINEX:EOSUSD

EOSUSD | Watch For Buy Opportunities EOSUSD formed two sets of higher lows on the price chart. Watch for buy signals on the way up.

EOS HISTORY REPEATS?Lets see how we slide into the new year this time.
Based on last years correction before the run in early '21, things could repeat on same scale into '22
EOSUSDWe could be in for a incredible bull run to 12$ per coin, considering the extreme price, good luck to everyone.

EOSUSD H16: BULLS 50% gains BEST LEVEL TO BUY(SL/TP)(NEW)Why get subbed to me on Tradingview?
-TOP author on TradingView
-2000+ ideas published
-15+ years experience in markets
-Professional chart break downs
-Supply/Demand Zones
-TD9 counts / combo review
-Key S/R levels
-No junk on my charts
-Frequent updates
-Covering FX/crypto/US stocks
-before/after analysis
-24/7 uptime so constant updates
🎁Please hit the like button and
🎁Leave a comment to support our team!
EOSUSD H16: BULLS 50% gains BEST LEVEL TO BUY(SL/TP)(NEW)
IMPORTANT NOTE: speculative setup. do your own
due dill. use STOP LOSS. don't overleverage.
🔸 Summary and potential trade setup
::: EOSUSD 16hours/candle chart review
::: 5 waves sequence BEARS in progress
::: currently WAVE3 in progress
::: BULLS reload low once W3 completes
::: BUY/ACCUMULATE near 2.10/2.20 USD
::: BOUNCE PLAY for 50% gains
::: up to 50% gains possible later
::: short-term pullback possible
::: bulls wait for Wave3 to complete
::: SPECULATIVE SETUP
::: do your own due dill
::: and use proper risk management
::: TP bulls is +50% gains
::: details: see chart
::: FINAL TP is +50%
::: recommended strategy: BUY/HOLD after correction
::: best entry near 2.10 USD
::: TP BULLS +50% gains
::: SWING TRADE: BUY/HOLD IT
::: bull run not over yet
::: good luck traders!
::: BUY/HOLD and get paid. period.
🔸 Supply/Demand Zones
::: N/A
::: N/A
🔸 Other noteworthy technicals/fundies
::: TD9 /Combo update: N/A
::: Sentiment mid-term: BULLS
::: Sentiment short-term: BEARS/DIPS
RISK DISCLAIMER:
Trading Crypto, Futures , Forex, CFDs and Stocks involves a risk of loss.
Please consider carefully if such trading is appropriate for you.
Past performance is not indicative of future results.
Always limit your leverage and use tight stop loss.

Strong Case for EOS if $3 HoldsI've been watching EOS for quite some time and the platform if pretty great.
My goal is to invest in blockchain platforms mainly and this to me looks like a great risk/reward opportunity. Even if EOS goes down honestly, I'd be mad at myself if I didn't at least pick some up at these low prices.
Great project. Good price.
But you decide for yourself ;)

EOS, The Accumulation PhaseThe Accumulation Phase:
The accumulation phase is a stage of consolidation. There is no clear trend, and the stock is usually trading in a range. It’s a span of time in which traders and institutions are slowly accumulating shares, but the market has not broke out yet. It’s also referred to as a “basing” period. It begins after the completion of a downtrend where the sellers have started to let up and short sellers have started to take their profits.
Target Points: 30-45-70
Stop loss: 1.88$

EOS trend changing challengeEOS Has broken the short term downtrend and with strong divergence like this I think It can test the long term down trend and even break this downtrend too ...
To put it simply; it's highly probable that #EOS be much more profitable comparing #BTC...

Reversal H&S target 3.665Following 4h chart.
In short term, there is a good opportunity for a reversal H & S.
TP 3.665
SL 3.263 ( Plase wait for candle close to stop)

EOS/rating #48EOSIO operates as a smart contract platform and decentralized operating system designed to deploy industrial-scale DApps following the decentralized autonomous corporation model. The smart contract platform is supposed to eliminate transaction fees, and it also conducts millions of transactions per second. EOS Software (EOS) represents a blockchain architecture designed specifically for scale-up and scale-out of decentralized applications. With EOS, you can leverage accounts, authentication, databases, asynchronous communication, and distribute applications across multiple CPU cores and / or clusters.

EOS trending to $6EOS' first target can be $6 then another low at around $2-3 can be formed. Later, another move up and above $10 could be a possibility.

EOS, don't hesitate to short it!3.3-3.5 are very good positions for opening positions.
A stop loss at 3.7 is more appropriate.
The ultimate goal is 2.5.
good luck!

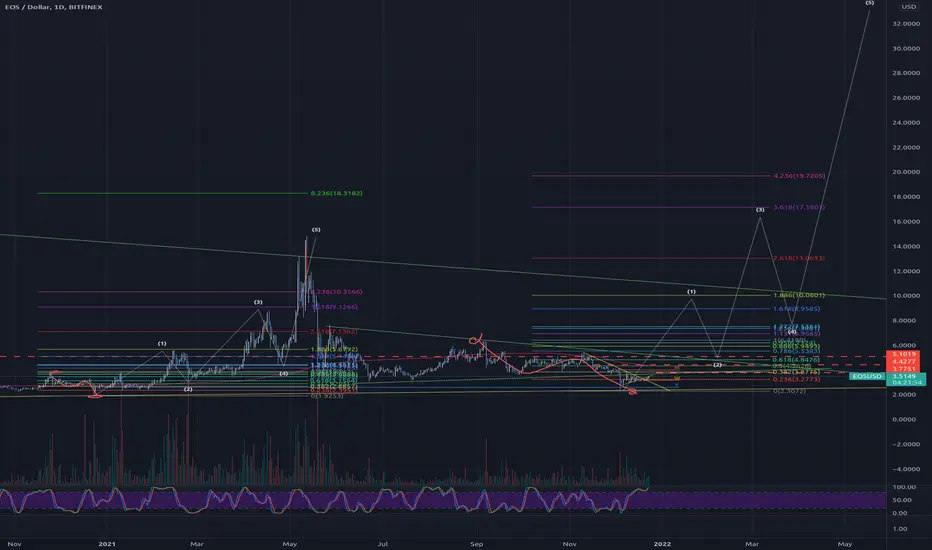
EOS Resets with Continued Large Wave 2 PullbackEOS (EOSUSD) appeared to have the much-sought-after 1-2,i-ii setup in place, but then it crashed right through support below and invalidated not only the nested setup but the entire 1-2! The primary PURPLE pattern is invalidated , which means that the correction that started after our May 2021 top has continued all the way into present-day. In other words, EOS has followed our bearish RED alt pattern that had been lingering all along! BCH, ETC, and FIL have suffered similar fates as they, too, have hit lower lows.
Well, that's a lot of doom and gloom. What's the silver lining?! Since the big pullback never ended in the first place, that means we never actually started our big 3rd wave rally. And that means that our unimpressive former 1-2 setup is dead. And THAT means that we may actually see a better 1-2 setup now. EOS can go as high as it wants now since there is nothing in place at the moment.
That said, 1st subwaves typically project to the 0.382-0.618 extensions of the previous higher-degree impulse, so I have a rough target range of 6.04 to 10.86 for a minimum 2x return (shown with the new GREEN primary pattern ). This GREEN pattern sees the larger correction as a double-zigzag, which is a zigzag pattern whose subwaves are also 3-wave corrective zigzag patterns. Double-zigzags (or double-threes) are notated with W-X-Y nomenclature in order to reduce confusion with the A-B-C subwave labels within each wave.
If that's not exciting enough, there is a strong confluence at the 1.00 extension overhead at 28.00... If not on this rally, the 3rd subwave could certain stretch there or higher!
There is no strong sign that this pullback is over, so we may still dip lower in EOS. However, if you've got moxy, it may be a great time to buy EOS. And if you're not sure but would like to get in on the action, dollar-cost averaging (DCA) is highly recommended. So far, we have a micro 1-2 possibly in place but will need to see more bullish action to convince us that there won't be a lower low. BTC and ETH, meanwhile, have had much more vigorous and convincing bounce-backs since the crash.
Bigger picture, wherever EOS tops, it would likely coincide with the MAJOR top for Bitcoin and Ethereum. While BTC and ETH will likely crash really hard, the altcoins may only pull back correctively into a lower-degree Wave-2, which could set us up for astronomical returns farther out in time. We may get many months to load up on EOS and other altcoins whose 3rd wave rally may coincide with a bear-market rally within BTC and ETH (a B-wave rally during the major 2nd wave).
I use Elliott Wave analysis to project price levels for different assets and asset classes. EW is a form a technical analysis that is absolutely NOT based on fundamentals. Please be aware that this is not intended to act as financial advice. I am not a trained or certified financial professional. You may invest based on a strategy tailored to your own skill and risk-tolerance levels.
#eosio #eos #blockchain #venezuelablockchain #eosvenezuela

EOS price analysis
EOS loses 13 percent in price after the latest crypto recession
EOS records one of the biggest declines over the past 24 hours after losing 13 percent in price
Trading volume fell 35 percent as the price moved below the 50-day EMA
The Crypto market recedes into another mass-scale dip
EOS price analysis over the past 24 hours shows one of the biggest declines in the market for the token. Price fell more than 13 percent on the day, moving as low as $3.28. In doing so, EOS also fell below its crucial 50-day Exponential Moving Average (EMA), which suggests that a significant bearish outlook is on the cards. The extent of the decline was also seen in the trading volume for EOS that fell more than 35 percent over the last 24 hours, indicating the formation of a stagnant market.
The larger cryptocurrency market fell into yet another large-scale dip, the third already for this month. Bitcoin dropped more than 6 percent, sitting at $47,600, whereas Ethereum dropped 7 percent to find itself just above the $4,000 mark. Major Altcoins showed the biggest dips, led by LUNA (8 percent), and Cardano, Solana, and Litecoin receding 7 percent each. EOS took the biggest losses on the day with its 13 percent decline.


EOS Next Potential MoveWe need to wait price reaction on the next week, if the price cant break green line support, it will be a good sign to buy, and then EOS will go to 5.5 resistance, be patient, don't rush on weekend

the bottom is in for EOS WOW that was crazy were back down at the floor support level.. looks like EOS will be on accumulation phase until the next bull cycle 2025.

EOSUSDT - 1D - LONG💡💡#SIGNAL 💡💡
EOS / USDT
▶️ Buy Now + Block
🔴 SLT - 1D (Trigger) (Close 1D candle below)
When TP is triggered, SL is transferred to the breakeven
#EOSUSDT_1D_251121

EOS the best ICO back in 2017I'm bullish for EOS next year 2022.. start accumulating this coin now while its still less than $5
